Energy, Staples, Utilities and Healthcare Lead in 2024
Halliburton, Pioneer and EOG Go for Breakouts
Packaging Corp Forms Triangle after Surge
Disney Forms Wedge After Breakout Move
The next Chart Trader will be posted on Tuesday morning, January 9th.
Systematic Mean-Reversion vs ChartTrader Setups
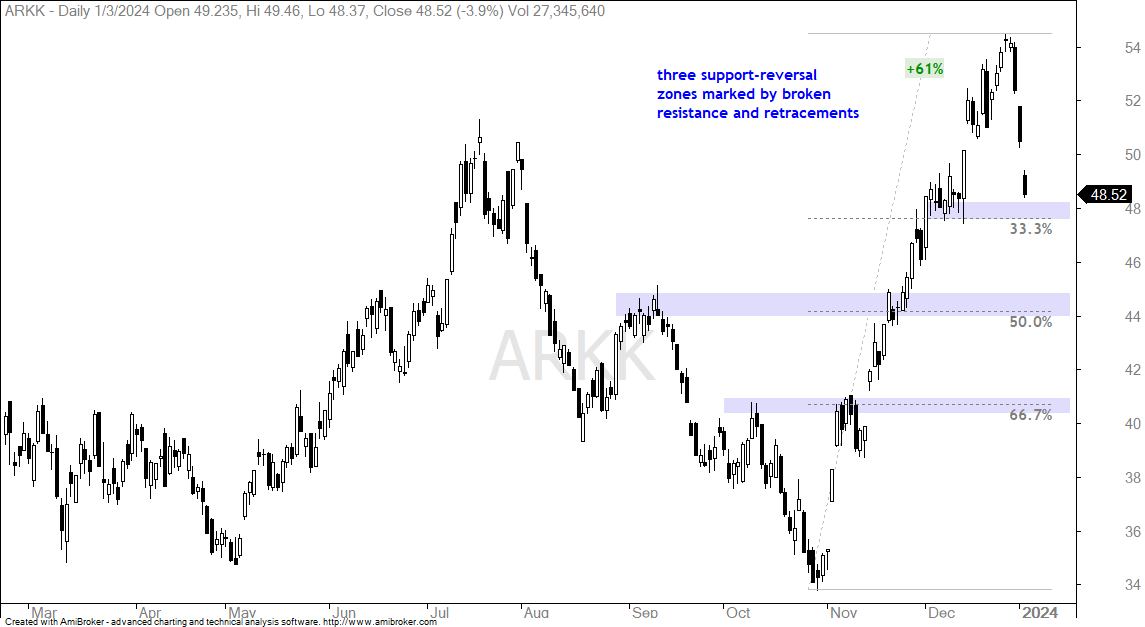
Stocks are starting 2024 a bit different than the last two months of 2023. After big advances into yearend, stocks fell the first three days of the year. High-beta stocks and ETFs led the way lower with some falling more than 9% (MDB, AMD, ARKK, ARKF). These sharp three day declines create very short-term oversold conditions for a mean-reversion bounce.
The chart below shows the ARK Innovation ETF (ARKK) surging over 60% and then falling over 10% the last three days. The stock is clearly oversold and near a support-reversal zone marked by the early December lows and 33% retracement. This is a mean-reversion setup for a short-term bounce, but I do not see a tradable pattern.
Short and sharp declines do not create tradable setups for ChartTrader. I am looking for pattern setups, such as a falling flags, wedges, pennants or triangles. I would also consider a decline back to a breakout or support-reversal zone. Such setups usually take a week or two or three to evolve. There are, however, some setups emerging in the energy sector. I will also highlight two stocks with bullish continuation patterns.
SPY Falls from 52-week High
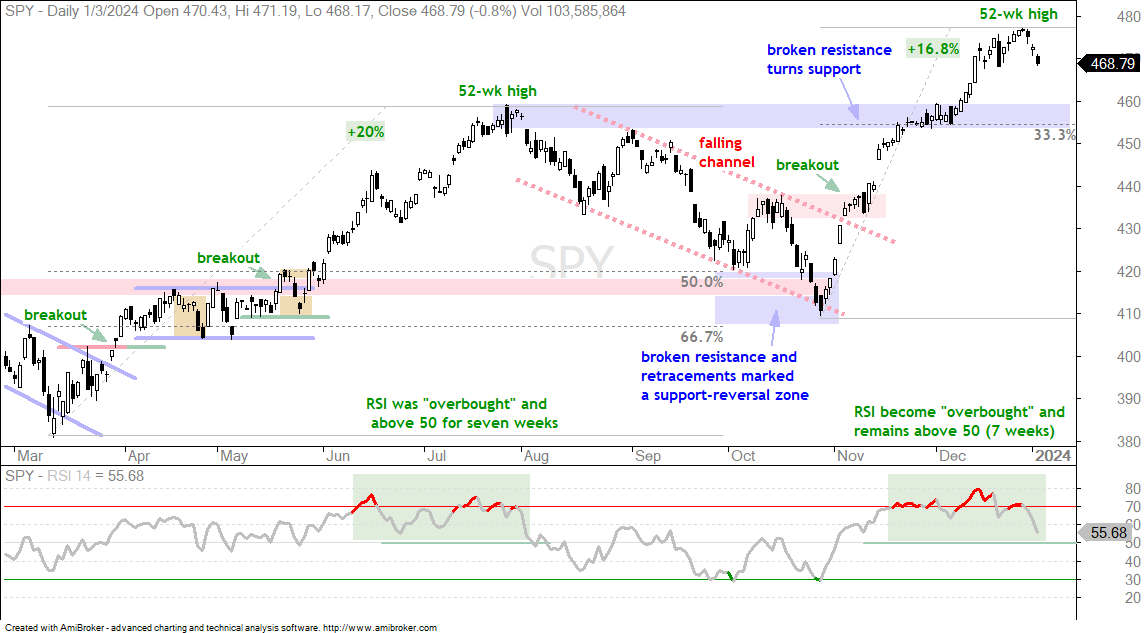
SPY fell 1.6% the last three days. This decline seems larger because many of the high beta names were down big. Note that this 3-day 1.6% decline comes after a 42-day 16.8% surge that was pretty much straight up. The rate of ascent from late October to late December was unsustainable. Timing a pullback within a strong uptrend, however, is difficult. At this point, I do not see a tradable pattern, such as a falling flag, wedge or triangle. ChartTrader is about tradable patterns and I will have to wait for one to develop. For now, I am setting the first support-reversal zone in the 450-460 area. Broken resistance turns support here and this area also marks a 33% retracement of the October-December advance.
The indicator window shows RSI moving above 70 on November 20th and then remaining above 50 for some seven weeks now. The move above 70 shows strong upside momentum and upside momentum remains net bullish as long as RSI holds above 50. Previously, RSI moved above 70 on June 12th and then held above 50 for seven weeks. The move below 50 in early August signaled the start of a corrective period.
QQQ Signals Start of Corrective Period
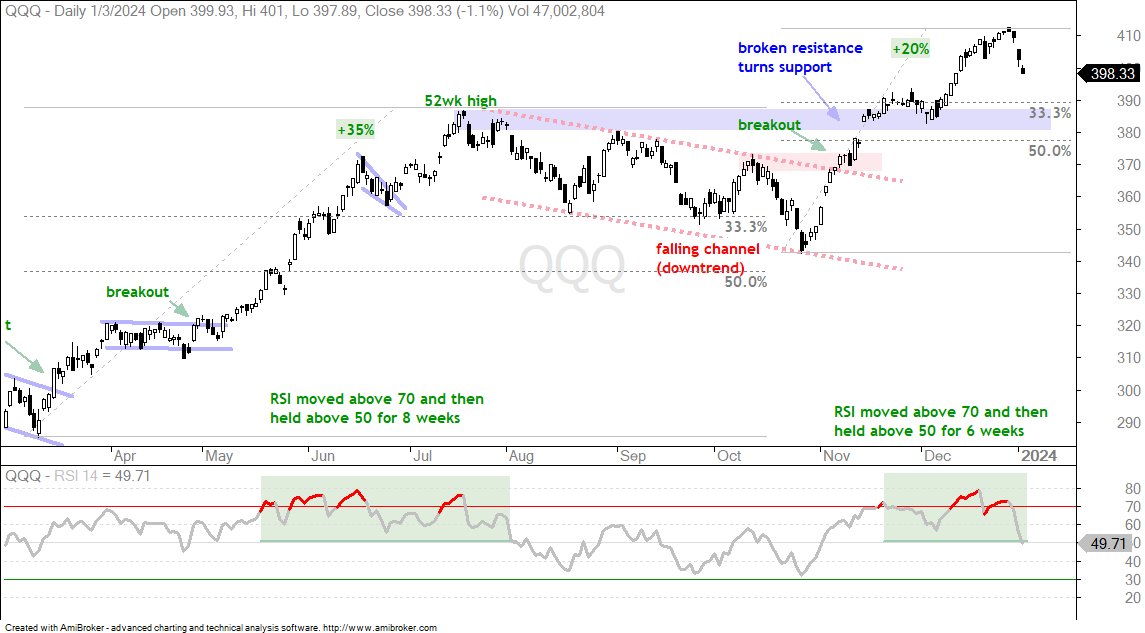
QQQ fell 3.15% over the last three days. This decline followed a 20% advance from late October to late December. As with SPY, the first support-reversal zone is set using broken resistance and the retracements (33-50%). RSI moved above 70 on November 20th and then held above 50 for some six weeks. RSI moved below 50 on Wednesday and this suggests that a corrective period is beginning. Keep in mind that corrections can be based on time, price or both. A time correction would be a sideways trading range. A price correction would be a pullback to the 380 area. Usually, we get a combination of two. A zigzag pullback that takes a few weeks or even months.
RSI Breaks 50 for XLK, IGV and SMH
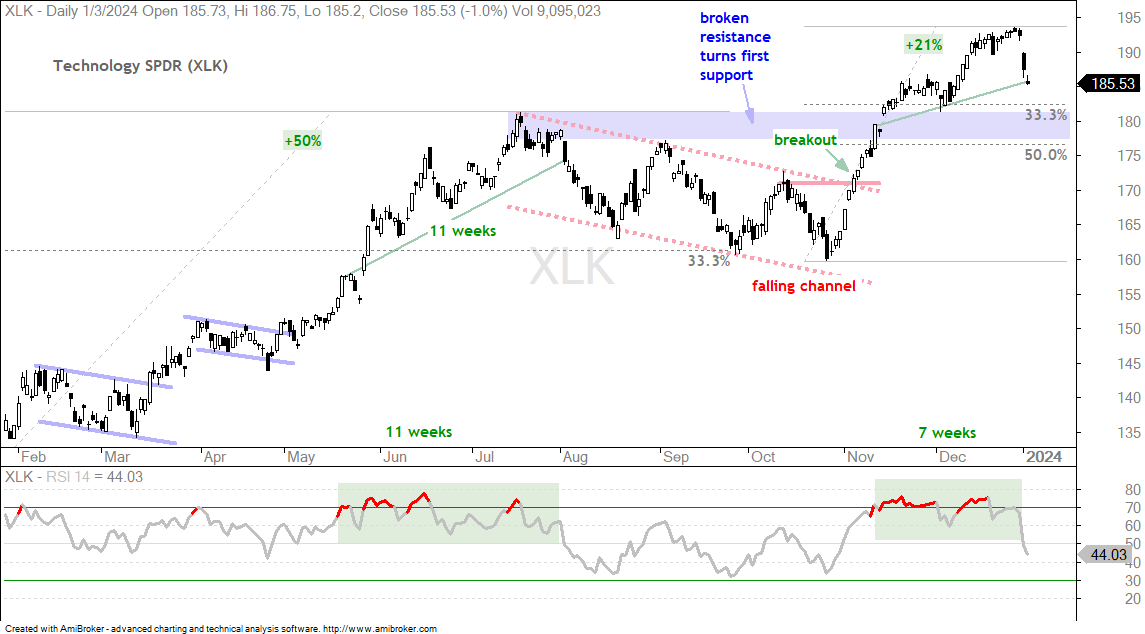
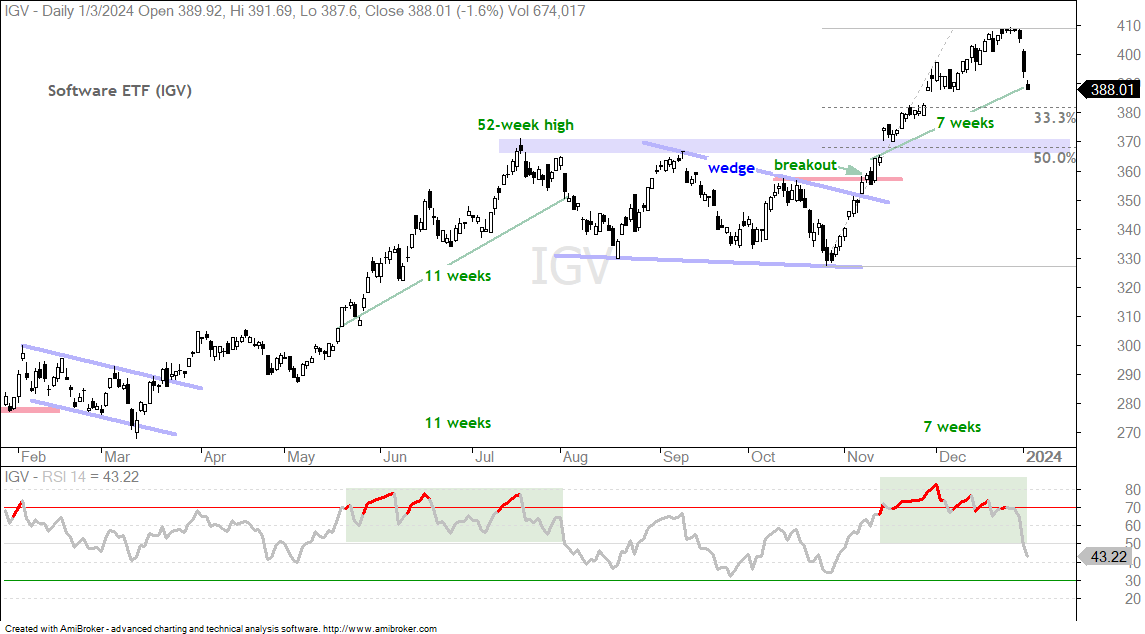
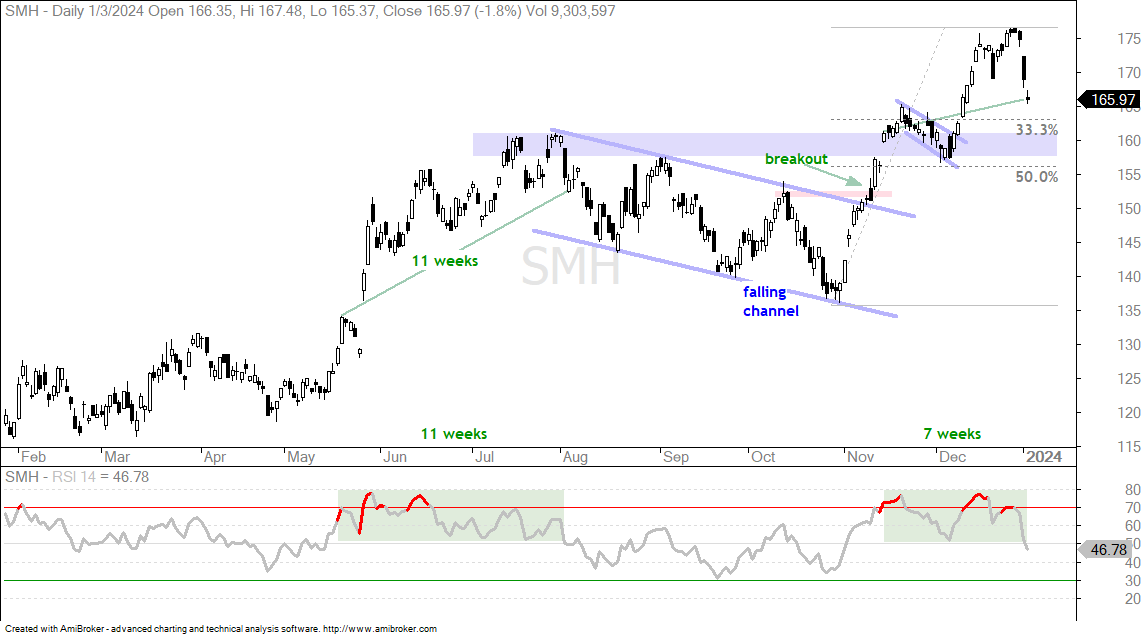
The next charts show RSI exceeding 70 in mid November and then remaining above 50 until January 3rd (yesterday). The Technology SPDR (XLK), Software ETF (IGV) and Semiconductor ETF (SMH) led the market from late October to late December. All three were holding strong until yesterday when RSI moved below 50. This shows weakening momentum that could lead to a corrective period. Note, however, that there will be bounces along the way and there are plenty of money managers looking for entry points after the big run into yearend. All three are short-term oversold after these three day declines and these conditions could give way to a mean-reversion bounce. I do not see a tradable pattern though.
Chart Analysis, Setups and Trading Ideas
Energy, Staples, Utilities and Healthcare Lead in 2024
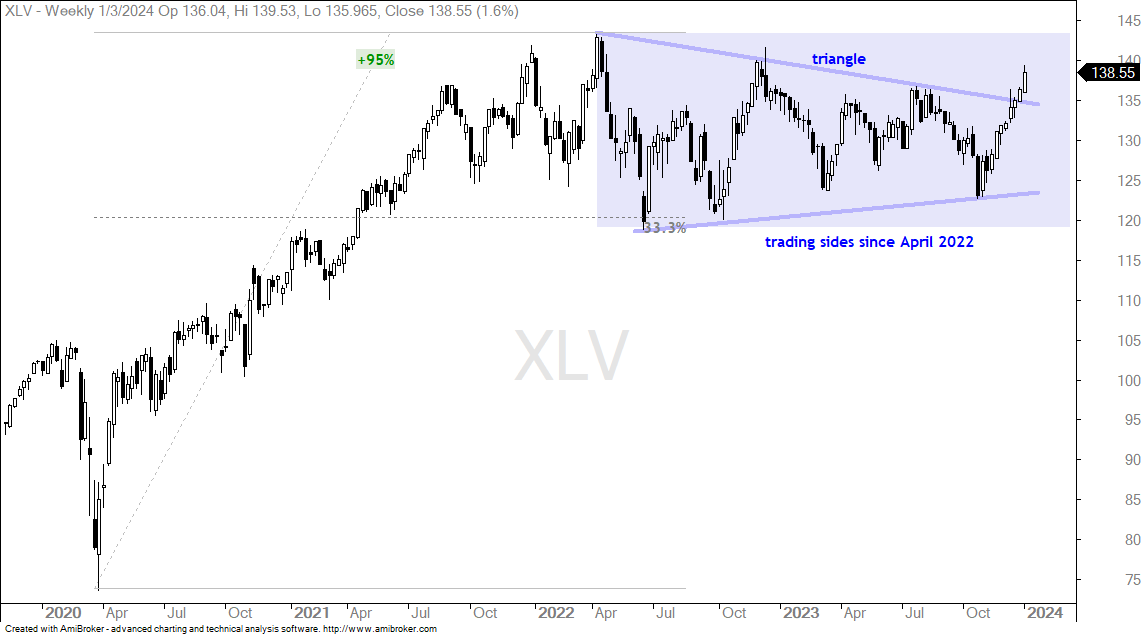
Only four of the eleven sectors are up this year. These include the Energy SPDR (XLE), Consumer Staples SPDR (XLP), Utilities SPDR (XLU) and Healthcare SPDR (XLV). XLV actually recorded a 52-week high and is the only sector that hit this milestone this year. The chart shows XLV with a 95% surge from March 2020 to April 2022. XLV then embarked on a trading range the last 18 months and a large Symmetrical Triangle formed. This is a bullish continuation pattern and the breakout opens the door to new highs. Short-term, XLV is quite extended so it would be prudent to put it on the watch list and wait for a tradable pullback.
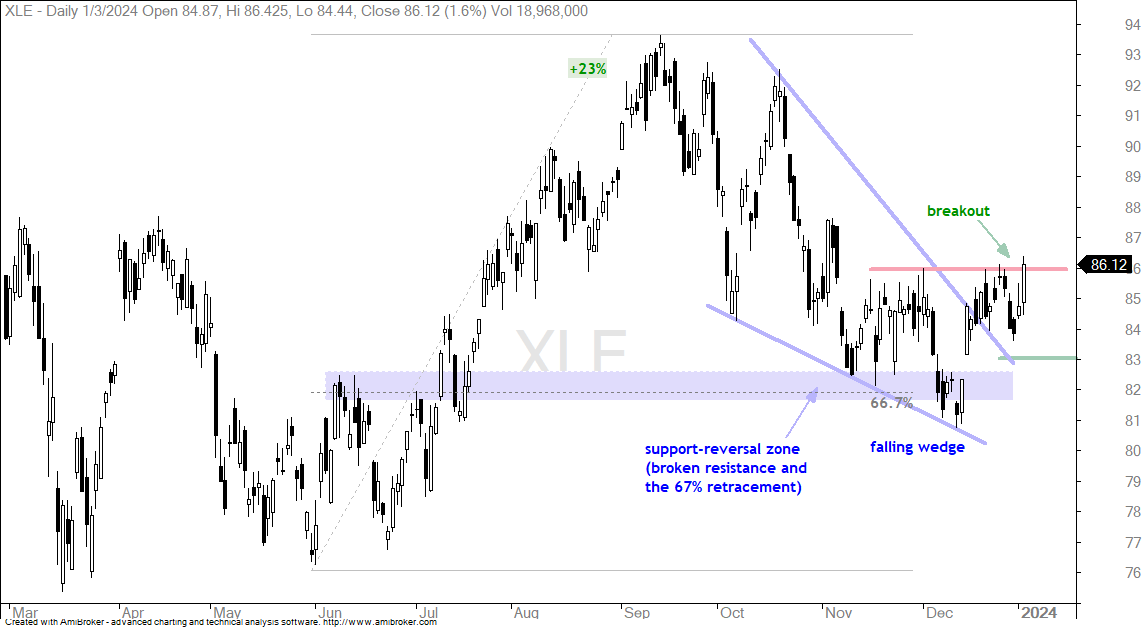
I do not see setups in XLP or XLU, but I am seeing a breakout in XLE. The chart below shows XLE with a 23% surge into September and a falling wedge into December. This wedge retraced 2/3 of the prior advance and returned to the July breakout zone (blue shading). This represents a support-reversal zone. XLE surged in the second half of December, fell back in late December and broke 86 with a surge the last two days. This is bullish with first support marked at 83.
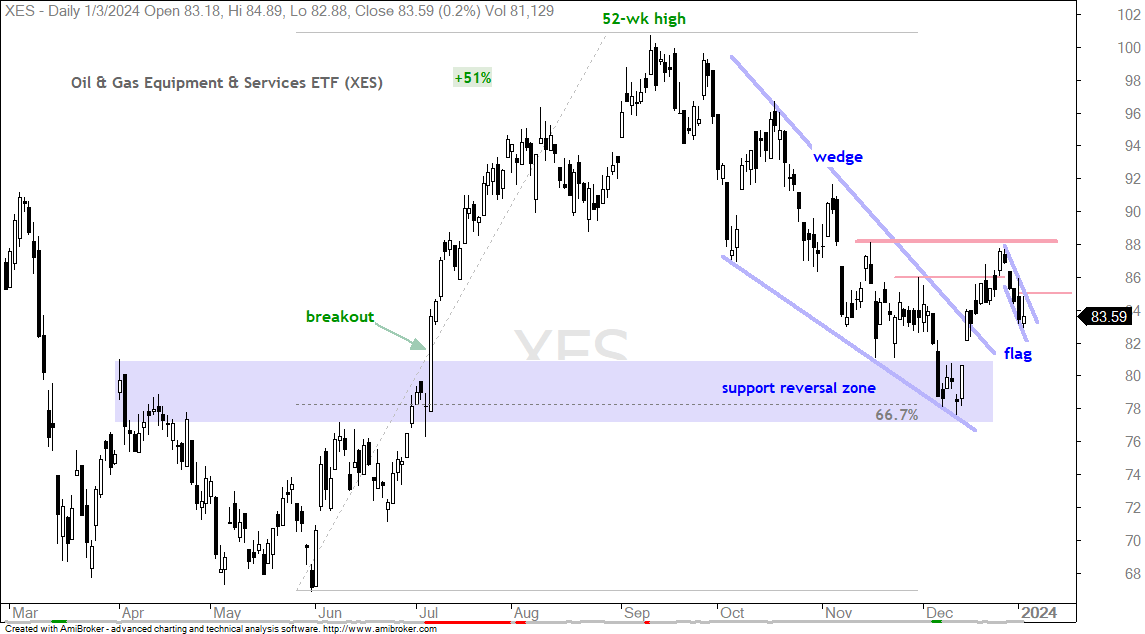
The next chart shows the Oil & Gas Equipment & Services ETF (XES) with a similar setup. Short-term, XES fell back the last four days and a falling flag formed. A breakout at 85 would be short-term bullish and increase the odds of a bigger breakout at 88. Upon a breakout at 85, I would mark re-evaluation support at 82.
Halliburton, Pioneer and EOG Go for Breakouts
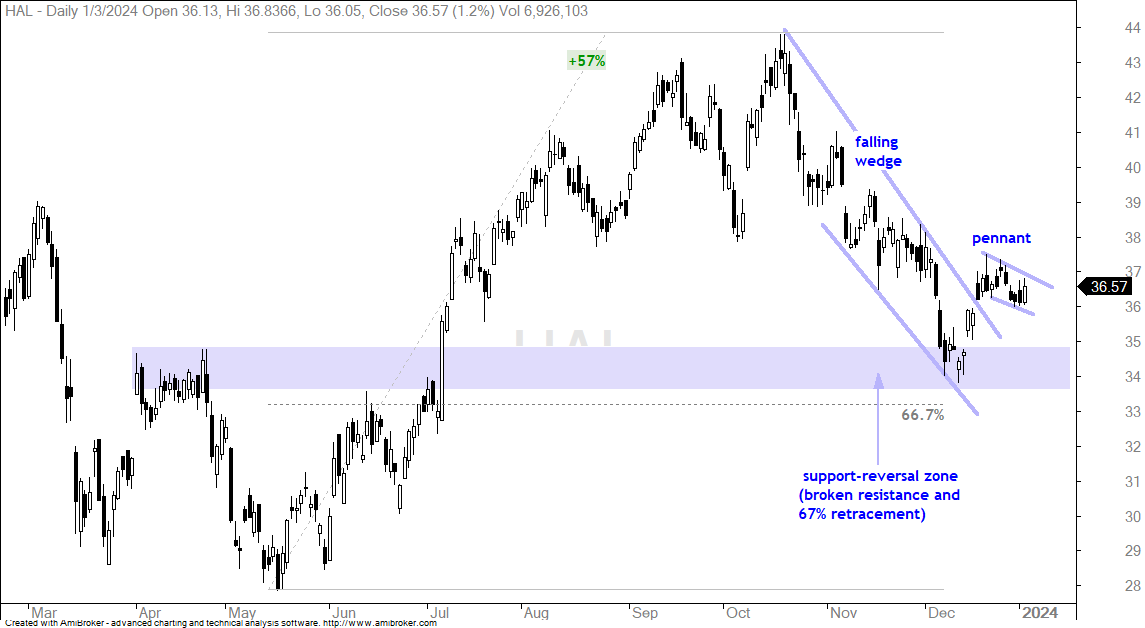
The next chart shows Halliburton (HAL) with a 57% surge into October and a sharp decline into December. This decline formed a falling wedge, retraced around 2/3 of the surge and returned to the July breakout. The blue zone marks the support-reversal zone and the stock surged in mid December. HAL then formed a small pennant, which is a bullish continuation pattern. A breakout at 37 would keep the bigger wedge breakout alive.
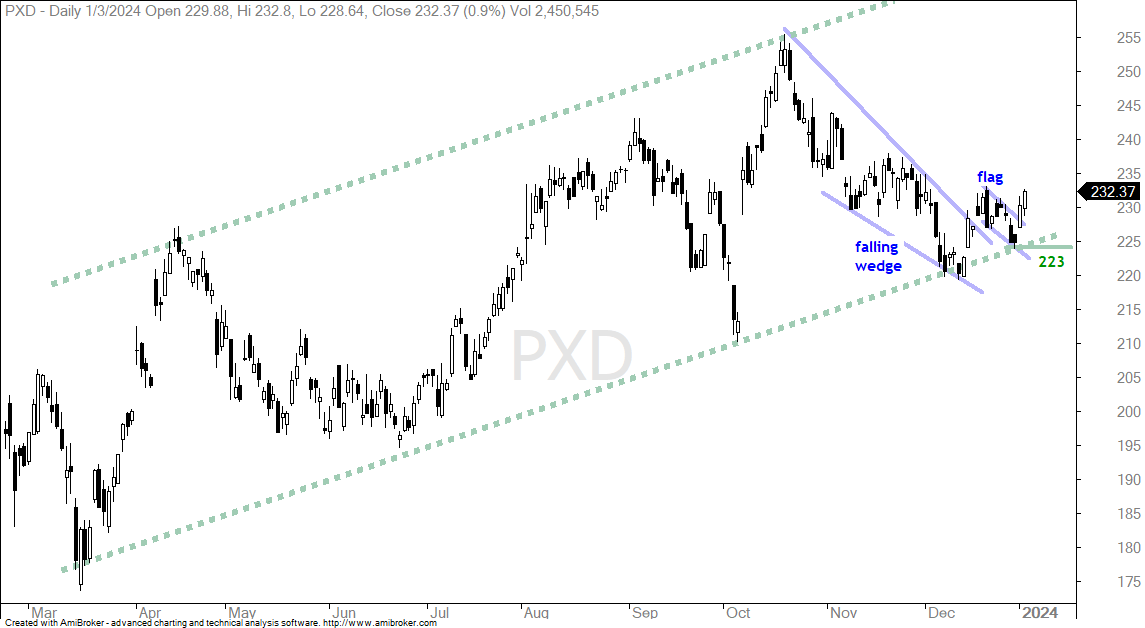
The next chart shows Pioneer Natural Resources (PXD) with a large rising channel in play since March (green dashed lines). PXD fell with the rest of the energy group from October to December. A falling wedge formed and the stock broke the upper line in mid December. PXD then fell back with a falling flag and broke out of this flag with a surge the last two days. This is bullish and I am marking re-evaluation support at 223.
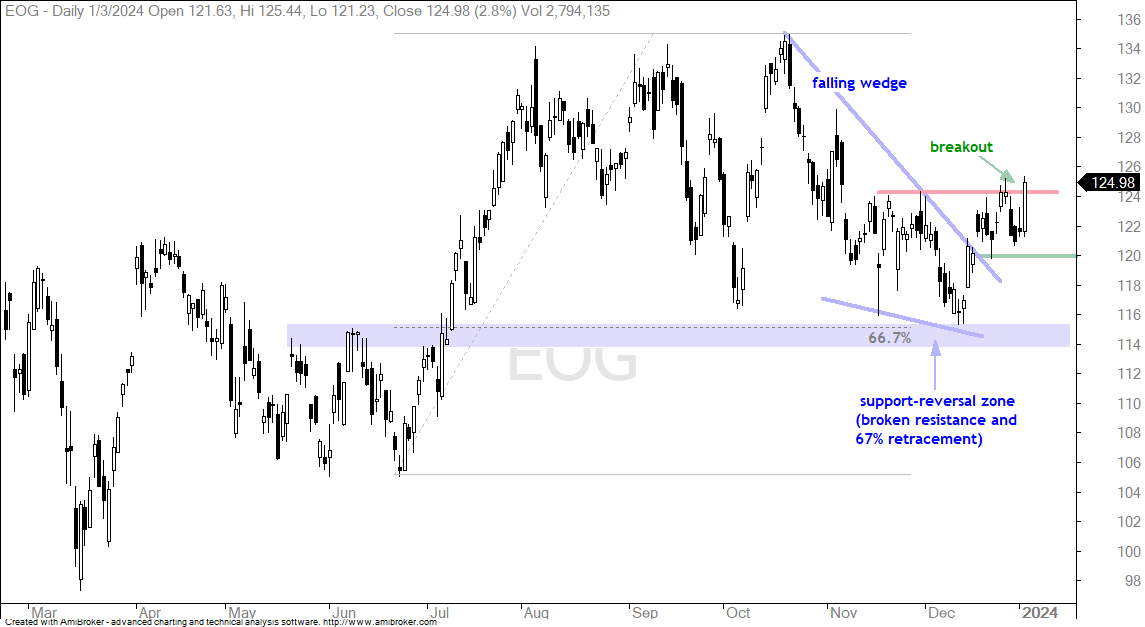
The next chart shows EOG Resources (EOG) with a breakout and re-evaluation support marked at 120. Note that stocks and ETFs in the energy sector are highly correlated. This means they move in the same direction. The degree of movement, however, is different. XLE is much less volatile than XES, which means XES has more risk … and also more reward potential.
Packaging Corp Forms Triangle after Surge
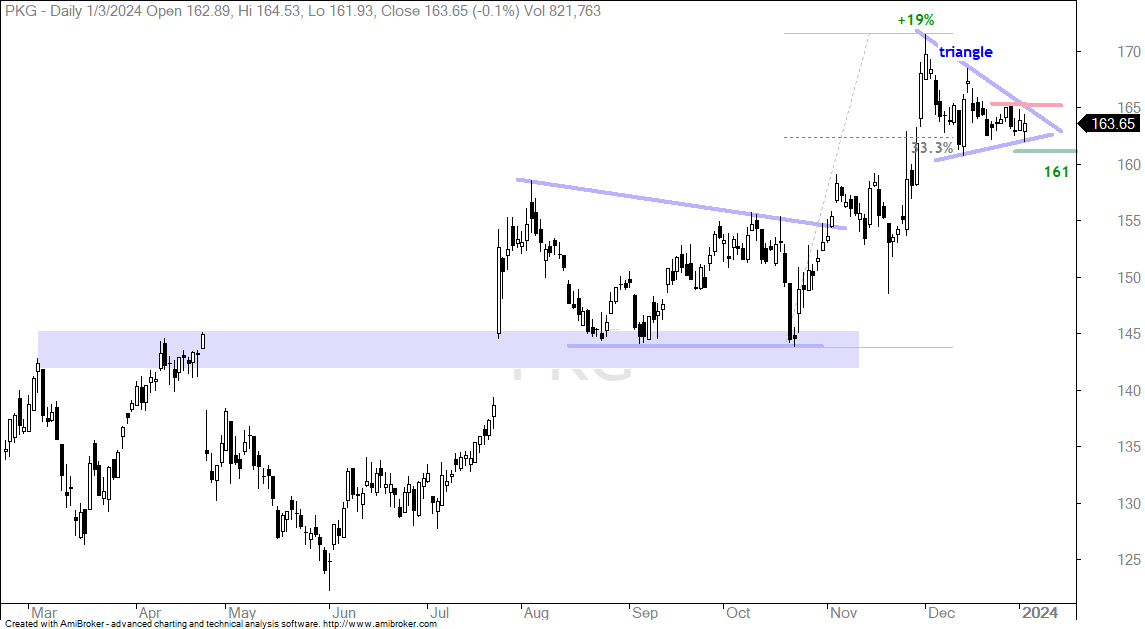
PKG surged 19% from October to early December and hit new highs in the process. The stock became short-term overbought after exceeding 170 and worked off this condition with a triangle consolidation. The decline into mid December retraced around 1/3 of the 19% advance. PKG then consolidated with a narrowing range and I am watching 166 for a breakout. Such a move would be bullish and I would then mark re-evaluation support at 161.
Disney Forms Wedge After Breakout Move
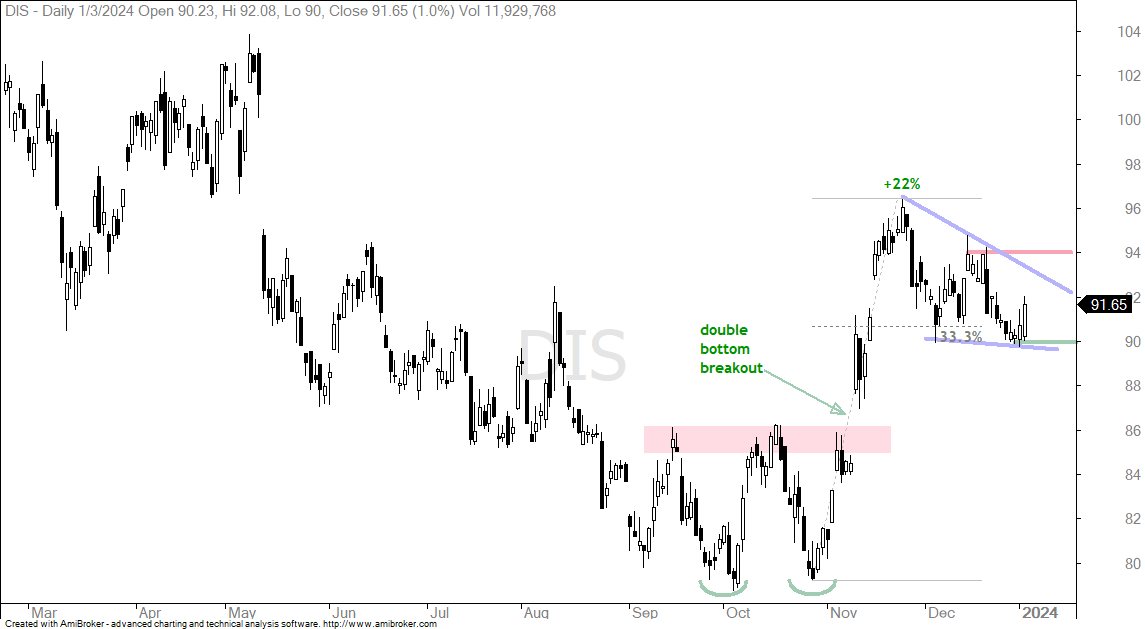
DIS forged a Double Bottom breakout with a 22% surge into late November. Prior to this move, the stock was a serious laggard and down year-to-date (January to October). This move reversed the downtrend, but the stock was quite extended at the end of November. DIS worked off this overbought condition with a falling wedge into late December. Notice that this wedge retraced one third of the prior surge, which is the minimum retracement. The falling wedge is a bullish continuation pattern and a breakout at 94 would signal a continuation higher. I am already seeing signs of strength here in January because DIS is up year-to-date. This could be a precursor to a wedge breakout. Re-evaluation support is set at 90.