The next Chart Trader will be posted on Tuesday morning, January 30th.
The Technology sector, the Communication Services sector and Nasdaq 100 stocks are powering the S&P 500 SPDR higher. I am also seeing strength in the Healthcare sector. Outside of these groups, the market is struggling in 2024 and weakness in short-term breadth has me concerned. My concern is not for a bear market, but for a pullback in the broader market, and SPY. QQQ and tech stocks are also getting quite frothy as the current advance accelerated over the last 12 days.
Large-caps and Equal-weights Diverge
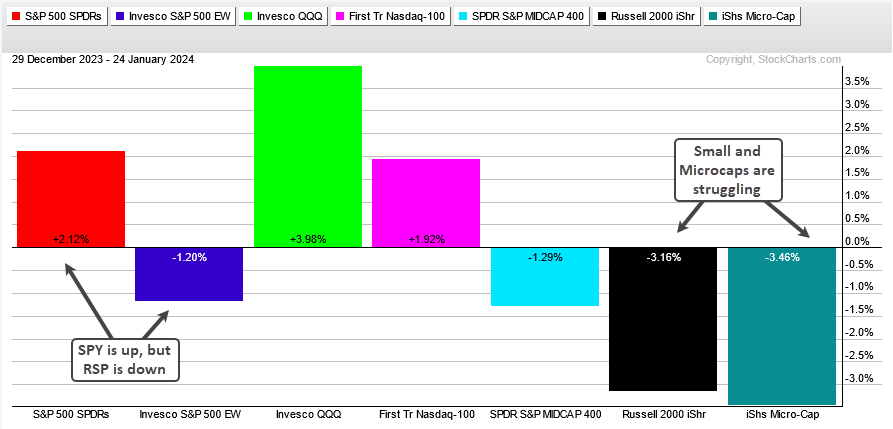
SPY is up 2.12% year-to-date and trading at an all time high. QQQ is up 4% year-to-date and also trading at an all time high. The Technology SPDR (XLK), Communication Services SPDR (XLC) and Finance SPDR (XLF) also hit new highs this week. Stocks are in great shape if you are only focused on large-caps and large-cap techs. The story is different when we look under the surface.
The PerfChart below shows SPY up 2.12% and the S&P 500 EW ETF (RSP) down 1.2% (blue bar) this year. Right there we see that the average stock in the S&P 500 is struggling this year. QQQ and the Nasdaq 100 Equal-Weight ETF (QQEW) are both up, which means the average stock in the Nasdaq 100 is doing well. The rest of the market is decidedly negative. The S&P MidCap 400 SPDR (MDY) is down 1.29% (teal bar), the Russell 2000 ETF (IWM) is down 3.16% (black bar) and the Russell Microcap ETF (IWC) is down 3.46%. Small-caps are struggling this year.
Tech and Communication Services Lead the Way
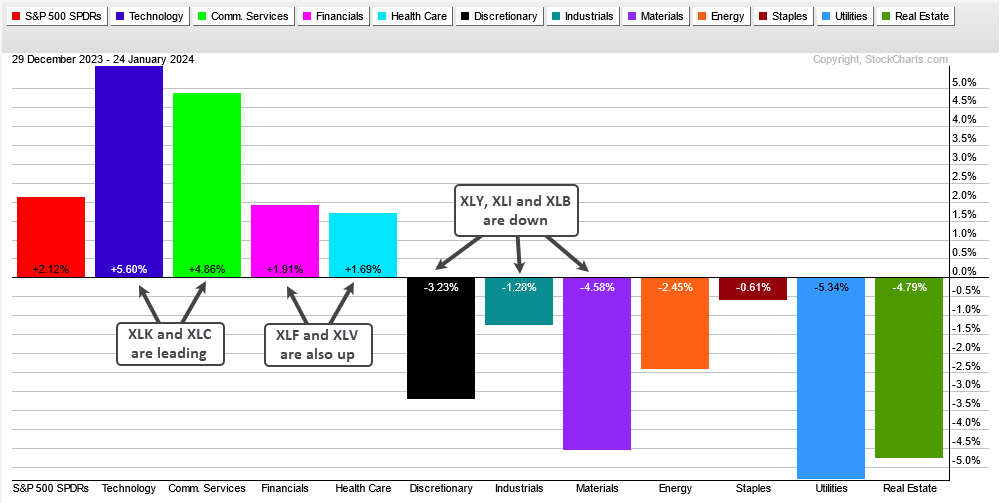
Even though SPY is up year-to-date, the majority of sectors are down year-to-date: seven are down and four are up. The next PerfChart shows SPY with the 11 sector SPDRs. The Technology SPDR (XLK) and the Communication Services SPDR (XLC) are leading the way with big gains (left side of chart). These two sectors account for 39% of the S&P 500. The Finance SPDR (XLF) and the Healthcare SPDR (XLV) are also performing well. These two sectors account for 25% of the S&P 500. Note that Berkshire (BRK.B), Visa (V) and Mastercard (MA) account for 28% of XLF.
On the right half of the chart, we can see the seven losing sectors. The Consumer Discretionary SPDR (XLY), Industrials SPDR (XLI) and Materials SPDR (XLB) are down. These sectors represent important parts of the economy and they are not confirming the strength we are seeing in SPY this year. Elsewhere, the Consumer Staples SPDR (XLP) is holding up the best of the losing sectors with the smallest loss (-.61%).
Fewer Stocks Above their 20-day SMAs
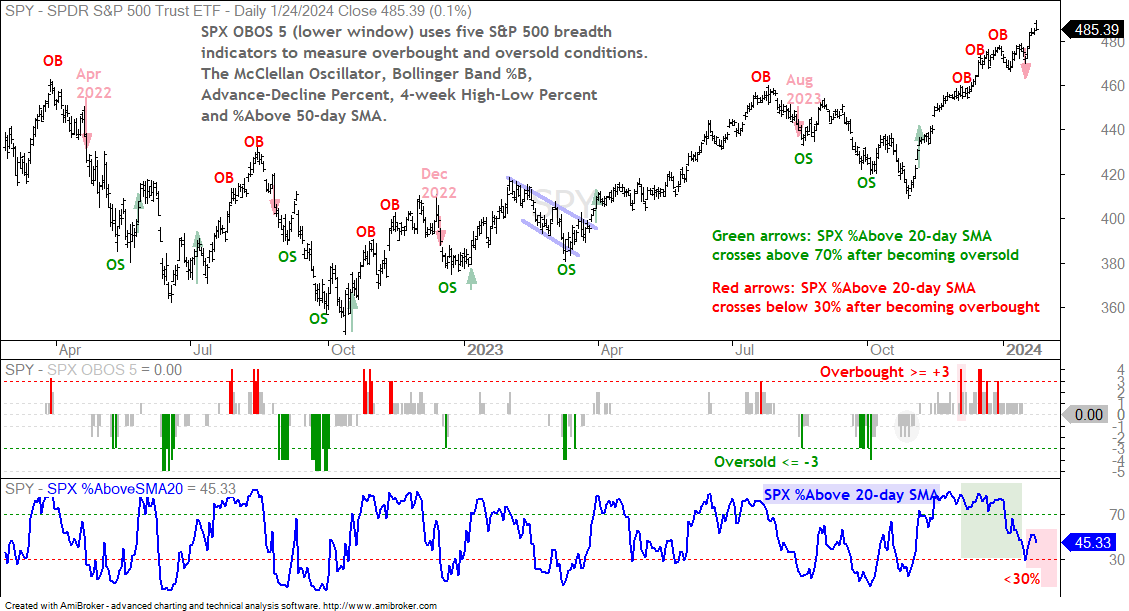
The next chart shows SPY with the SPX OBOS Composite in the first indicator window and SPX %Above 20-day SMA in the second window. The SPX OBOS Composite aggregates overbought and oversold readings in five breadth indicators. It is overbought at +3 or higher and oversold at -3 or lower. It became overbought five times in December (red bars). %Above 20-day SMA remained above 70% in December and this meant SPY was overbought and still strong.
The situation changed in January as %Above 20-day SMA fell sharply and broke 30% on January 17th. This means far fewer stocks are above their 20-day SMAs. Put another way, more stocks are below their 20-day SMAs. This sharp increase in downside participation is short-term bearish. SPY, however, ignored this signal and moved to a new high the last five days, thanks to tech stocks.
I cannot find another example of SPY trading at a four-week high with fewer than 50% of S&P 500 stocks above their 20-day SMAs. Something needs to give here: either SPY follows the broader market and corrects or small-caps perk up and follow the tech sector. I put more odds on the former (SPY corrects).
4-week Lows Outnumber 4-week Highs
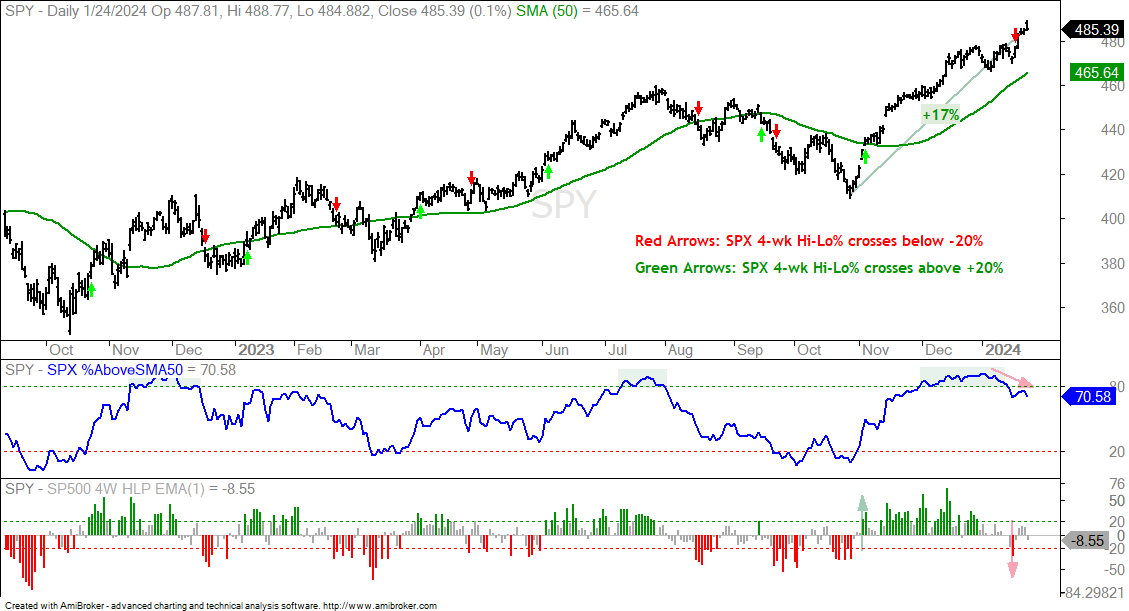
The next chart shows SPY with SPX %Above 50-day SMA in the first indicator window and SPX 4-wk High-Low Percent in the lower window. SPY is well above its 50-day SMA, but fewer stocks held above their 50-day SMAs in January. This indicator was above 80% throughout December and into mid January. It fell the last few weeks and is currently around 70%. On the face of it, 70% is pretty good. However, the indicator is moving in the wrong direction this month (red arrow) and needs to get back above 80% to support this advance.
The lower window shows the percentage of S&P 500 stocks hitting 4-week highs less the percentage hitting 4-week lows. SPY is at a 4-week closing high, and a new all time closing high. Even so, more stocks recorded 4-week lows than 4-week highs yesterday. SPX 4-wk High-Low Percent finished at -8.55% (botton right). Also note that this indicator moved below -20% last week (red arrow). I view this as a short-term bearish signal. Again, SPY (the general) is surging, but fewer stocks (the troops) are participating. Something needs to give.
SPY and QQQ Extend within Rising Channels
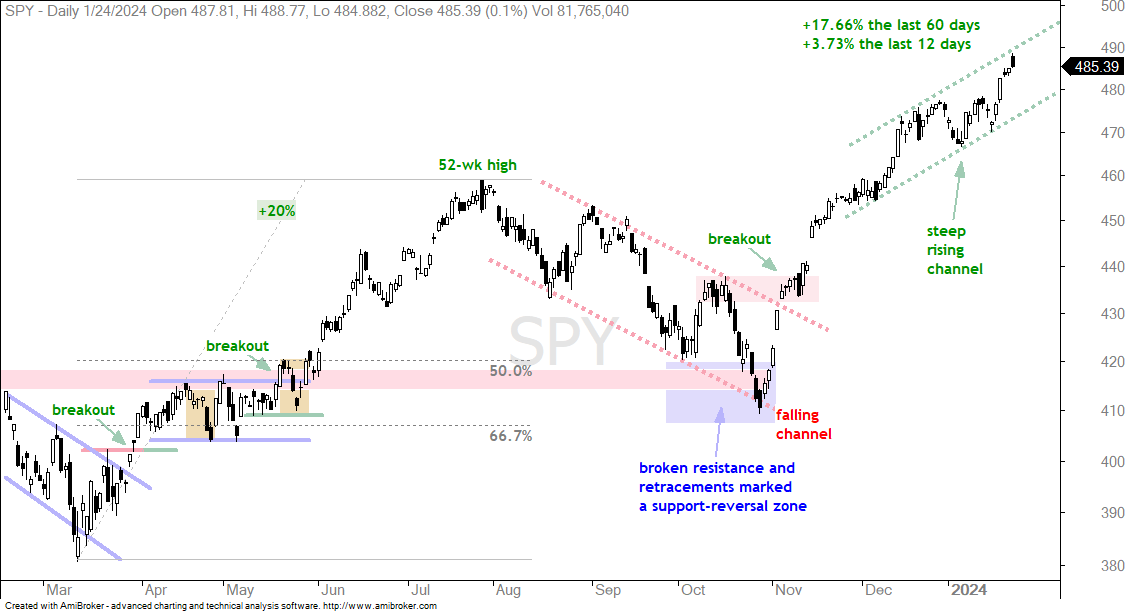
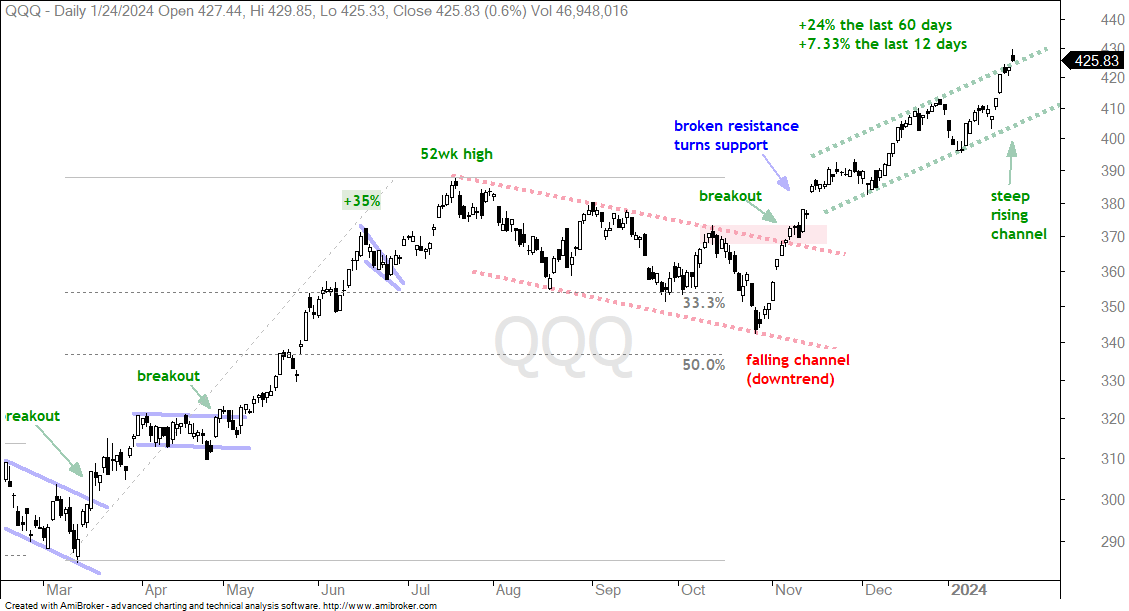
The charts for SPY and QQQ are similar. Both broke out of falling channel patterns with big surges in November. The advance then evolved into a zigzag higher in December with a rising channel taking shape. These channels are still quite steep and I wonder how sustainable they are. SPY is up 17.66% the last 60 days and up 3.73% the last 12 days. The first chart shows SPY hitting the upper line of its rising channel. This makes it short-term overbought and ripe for a pullback or consolidation. The lower line marks short-term support in the 480 area.
The next chart shows QQQ with a 24% advance the last 60 days and a 7.33% surge the last 12 days. QQQ exceeded the upper line of the rising channel. This ETF is even more extended then SPY, but showing no signs of weakness. The lower line marks short-term support in the 410 area.
Chart Analysis, Setups and Trading Ideas
Kroger Forms Pennant after Breakout
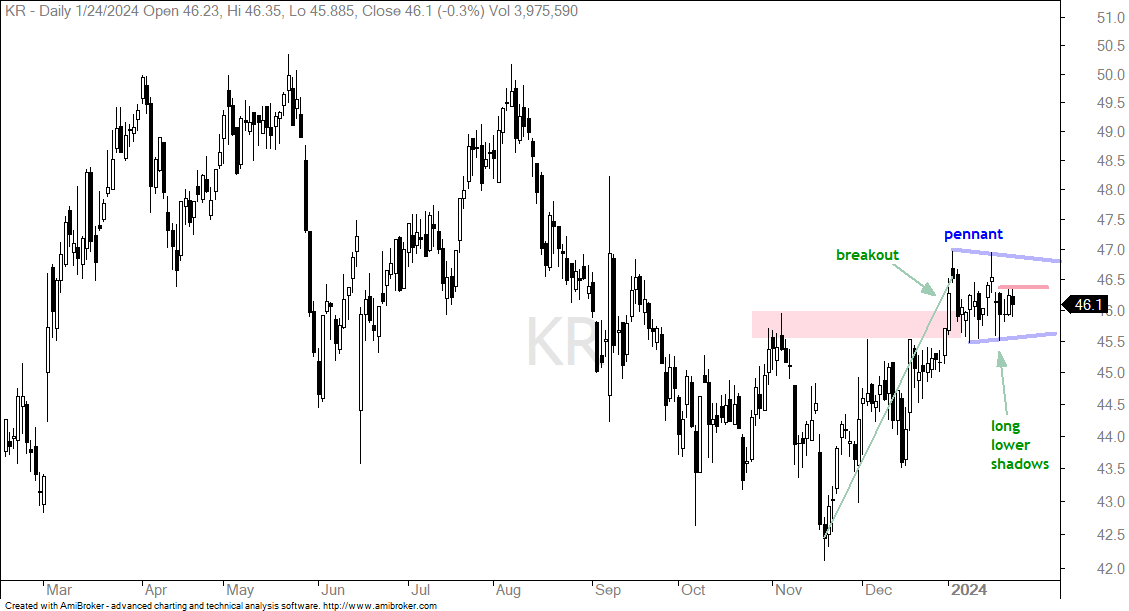
KR sports a breakout in early January and a bullish pennant over the last few weeks. First, KR surged from mid November to early January and broke above the early November high (red shading). This breakout reverses the downtrend. After this 10% breakout surge, the stock consolidated with a pennant to work off short-term overbought conditions. A breakout at 47 would signal a continuation higher and target a move to the 50-51 area. Within the pennant, I am seeing candlesticks with long lower shadows this month. Lower shadows represent the intraday low and long lower shadows mean KR is closing well above the intraday low. This is positive price action and a break above 46.4 would provide the first positive sign.