The next Chart Trader will be posted on Tuesday morning, January 16th.
Leading Sectors and Groups
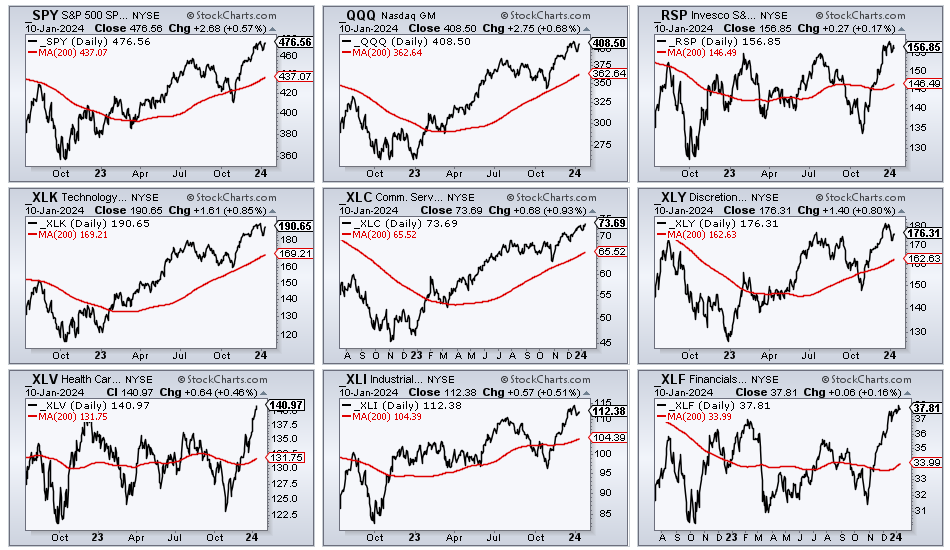
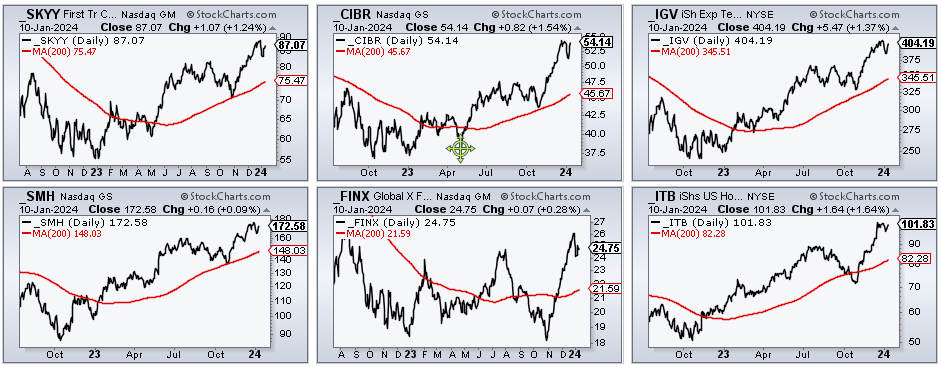
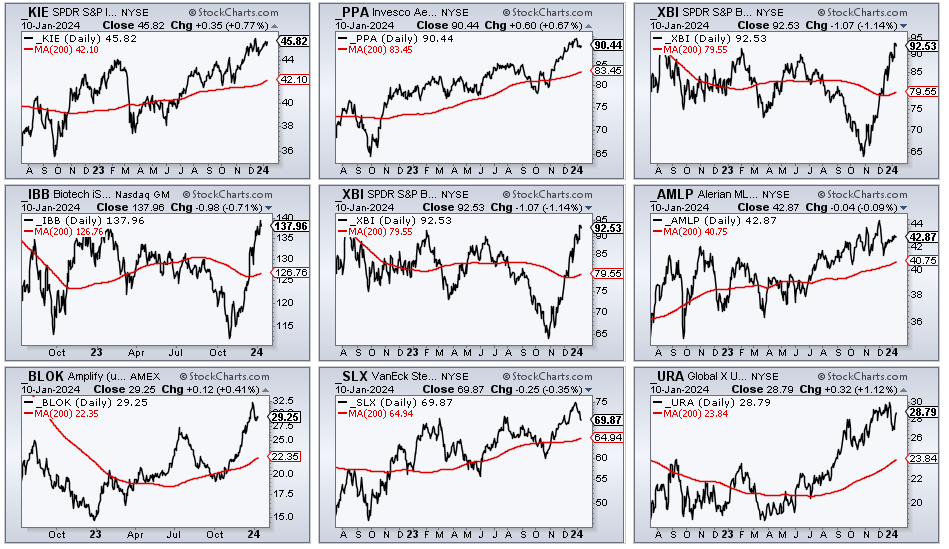
There is no change with broad market conditions, which were covered in detail on Tuesday. Today starts with a table showing the leading ETFs. These are the strong areas in the stock market right now. I am using proximity to a 52-week high and the volatility-adjusted Rate-of-Change to define leadership. ETFs close to 52-week highs are leading on the price charts. ETFs with the highest Volatility-Adjusted ROC are leading gainers. Overall, large-caps are leading. SPY and QQQ are the strongest of the major index ETFs and the six biggest sectors are leading the sector SPDRs. Within the industry group ETFs, I am seeing leadership in tech-related ETFs, housing and biotech.
Major index ETFs
S&P 500 SPDR (SPY)
Nasdaq 100 ETF (QQQ)
S&P 500 EW ETF (RSP)
Sector SPDRs
Technology SPDR (XLK)
Communication Services SPDR (XLC)
Consumer Discretionary SPDR (XLY)
Healthcare SPDR (XLV)
Industrials SPDR (XLI)
Finance SPDR (XLF)
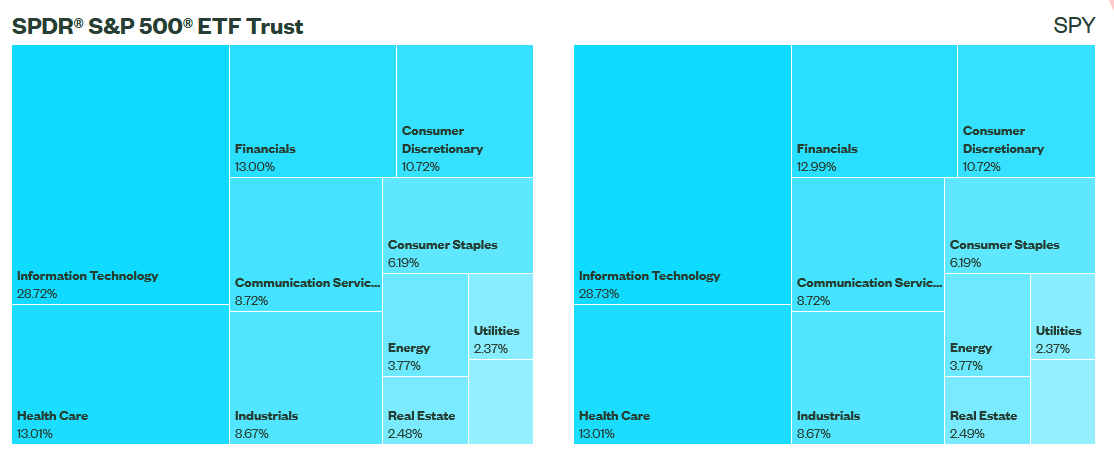
Note that these six sectors account for a whopping 82% of the S&P 500. This means the other six sectors account for just 18% (Energy, Materials, Utilities, Staples and REITs).
The next charts shows the leading tech-related ETFs (plus Housing).
Industry Group ETFs
Cloud Computing ETF (SKYY)
Cybersecurity ETF (CIBR)
Software ETF (IGV)
Semiconductor ETF (SMH)
FinTech ETF (FINX)
Home Construction ETF (ITB)
The next charts show the leading industry group ETFs outside of tech.
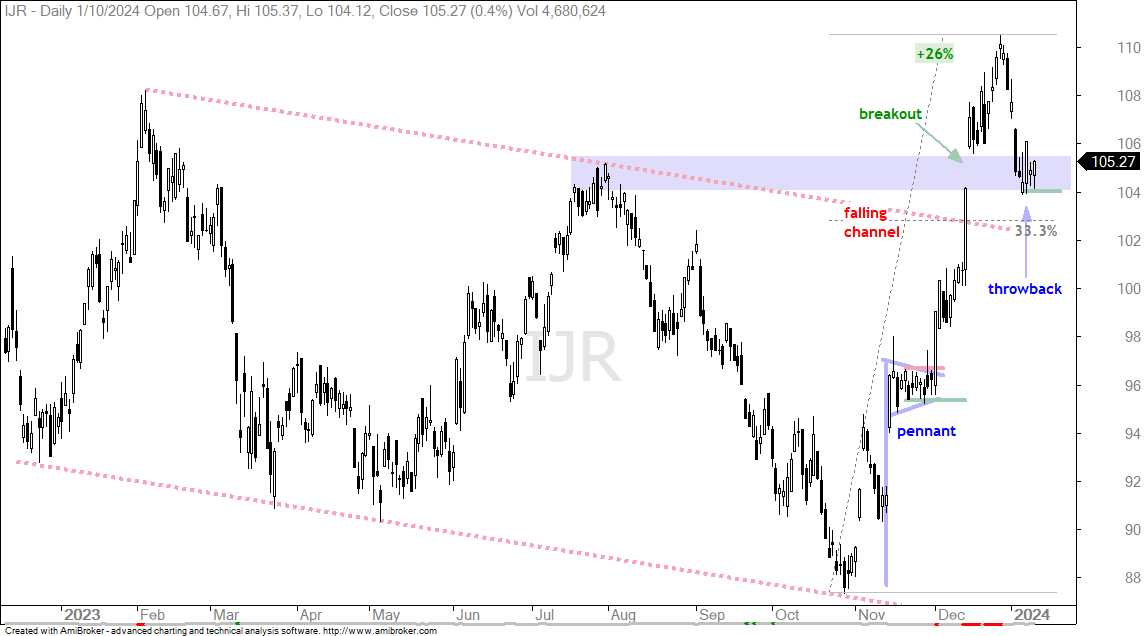
Small-caps are lagging overall, but I am seeing a short-term bullish setup in the S&P SmallCap 600 SPDR (IJR). IJR surged with the broader market and broke out of a long falling channel. The ETF also exceeded its January 2023 high and hit a 52-week high. IJR was overbought after a 26% surge and fell back to the August high. This prior resistance zone becomes possible support. IJR is also back in the gap zone, which may offer some support. After falling sharply in late December and early January, the ETF firmed in the 104 area. The sharp decline created an oversold condition and the firming shows support. This is a good spot for a bounce. A close below 104 would negate this setup.
Ball Corp Falls Back from Resistance
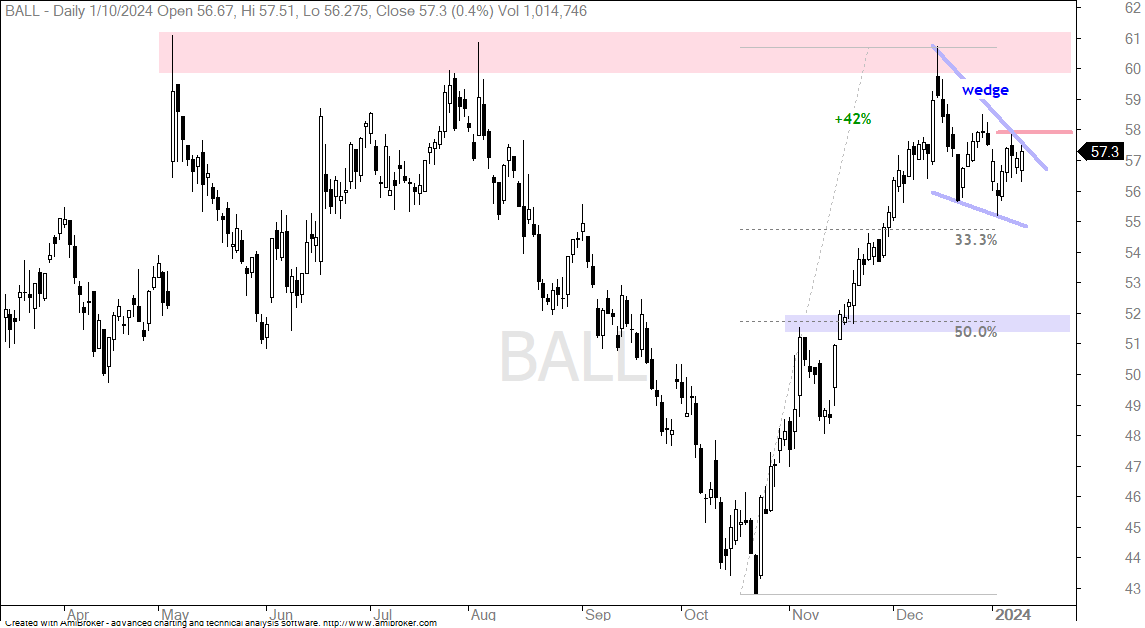
Ball Corp (BALL) made a huge round trip between August and December, and then corrected with a falling wedge. The stock fell from 60 to 43 (August to October) and then surged back to 60 in mid December. This is an amazing round trip and reflects a sudden change of heart in the markets. After a 42% surge, BALL hit resistance from the 2023 highs (red shading) and fell back with a falling wedge. I view this as a corrective pattern designed to digest the massive gain. I am marking resistance at 58 and a break out here would be bullish. Should the stock break out, I would then mark re-evaluation support at 55.
Cummins Consolidates after Breakout
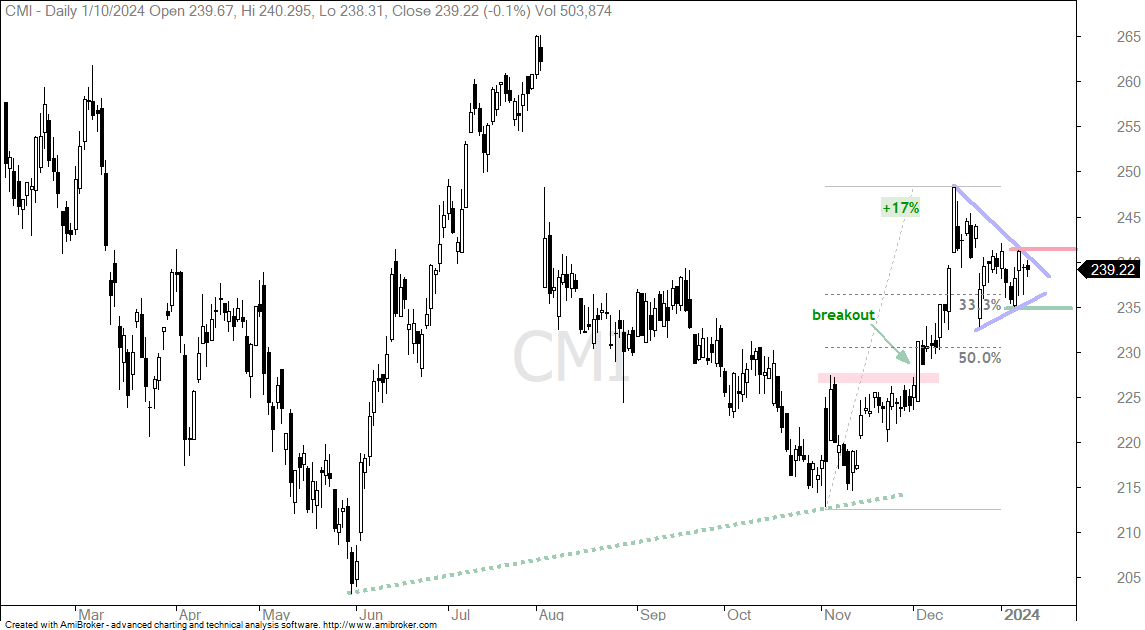
Cummins Engine (CMI) surged in June-July and then gave most of it back with a steep decline into late October. The stock, however, managed to trough above the late May low and formed a higher low (green dashed line). CMI then broke out with a surge in December as the market rally broadened. After a 17% gain, the stock moved into a consolidation phase as a triangle formed. I view this as a bullish continuation pattern and a breakout at 242 would be bullish. I would then mark support using the early January low.
Textron Falls Back into Consolidation
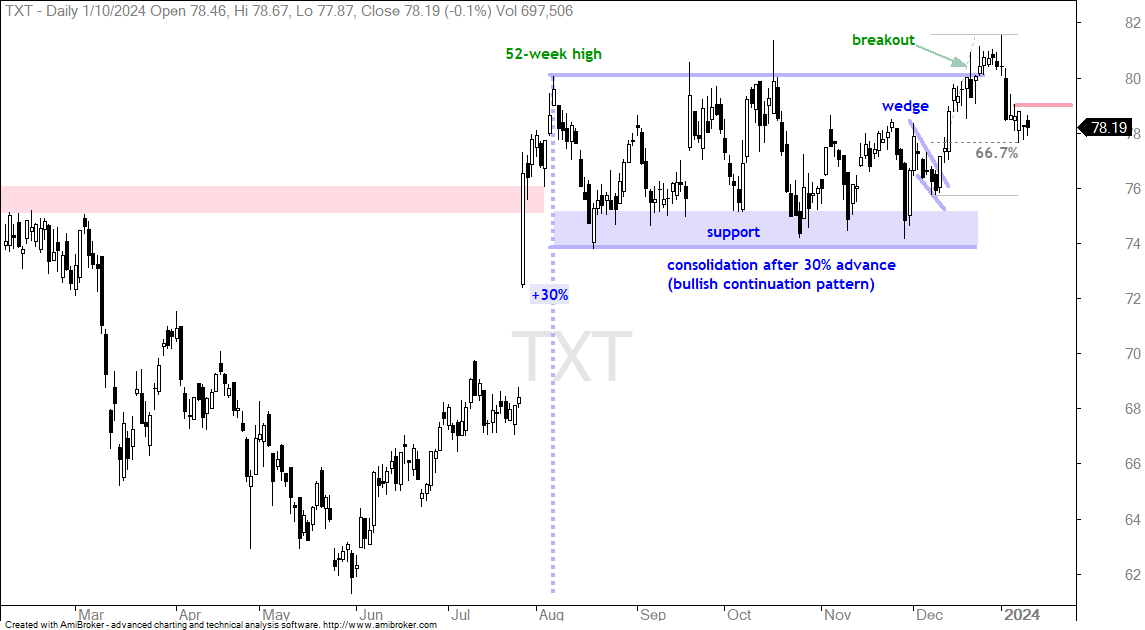
Textron (TXT) surged some 30% from late May to early August and then traded sideways the last five months. This is sometimes how it works: less time trending and more time consolidating. TXT shows two months of trending and five months of consolidating. Overall, TXT looks bullish because the five month consolidation is a bullish continuation pattern. The stock broke out with a surge into early January and then fell back with the market last week. Some may view this as a failed breakout. I view it as a pullback after the December surge because the overall uptrend takes precedent. The decline retraced 66.7% of the December surge and the stock firmed the last few days. A breakout at 79 would be short-term bullish.
Copart Hits Support-Reversal Zone
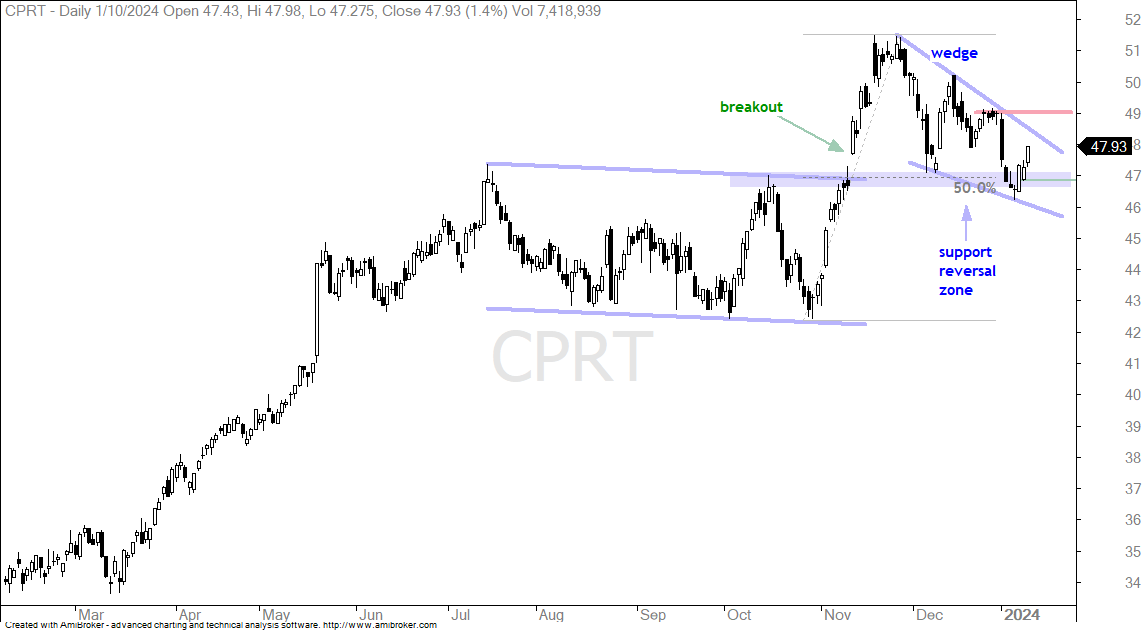
Copart (CPRT) broke out with a big surge in November and returned to the breakout zone with a falling wedge. The blue shading marks a support-reversal zone. Broken resistance turns into support and the 50% retracement marks a possible reversal area. The falling wedge is also typical for a correction after a strong advance. A breakout at 49 would reverse this fall and signal a continuation of the November surge. The first signs of strength appeared over the last three days as the stock bounced with the market. I see a short-term reversal with this surge and a close below 46.8 would argue for a re-evaluation.
Can Biogen Turn the Corner?
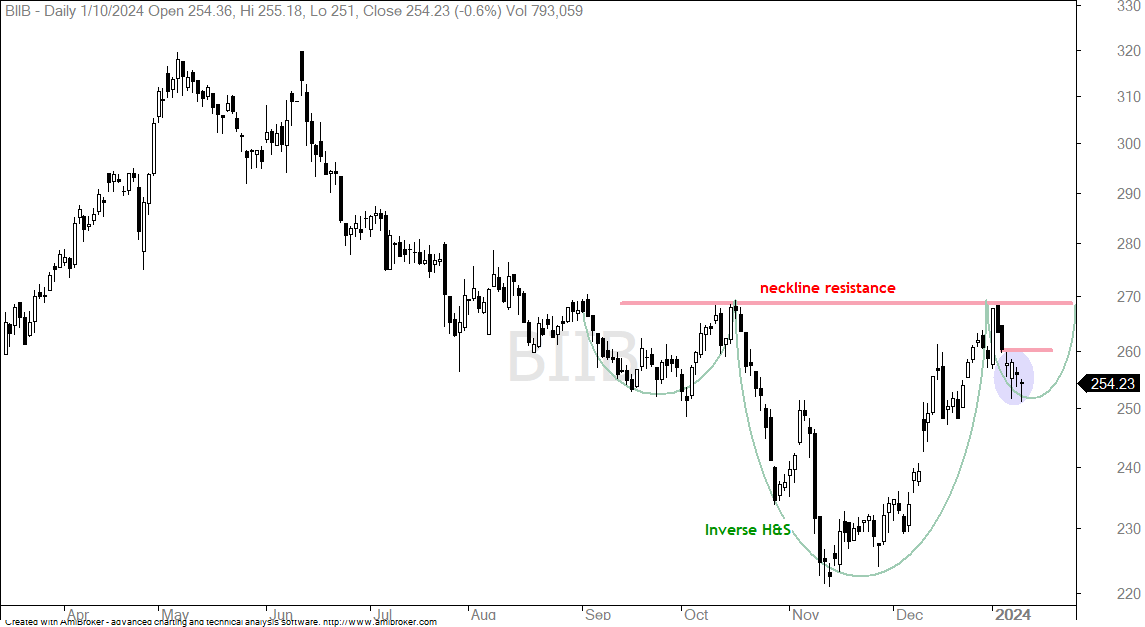
Biogen (BIIB) has gone nowhere since 2015 as it traded between 190 and 460 the last eight years. Most recently, the stock surged from the 190 area in May 2022 to the 320 area in May 2023. The chart below shows it then falling to the 220-230 area from May to November 2023. I am highlighting BIIB because the sector (Healthcare) and the group (Biotechs) are strong. In addition, the stock could be tracing out an inverse head-and-shoulders pattern (green lines). A breakout at 270 would be bullish. Short-term, the stock fell back from resistance last week and firmed somewhat with four indecisive candlesticks (blue oval). I am watching for a breakout at 260 for the early signs that BIIB will attempt a bigger breakout at 270.
GE Healthcare Forms Bull Flag
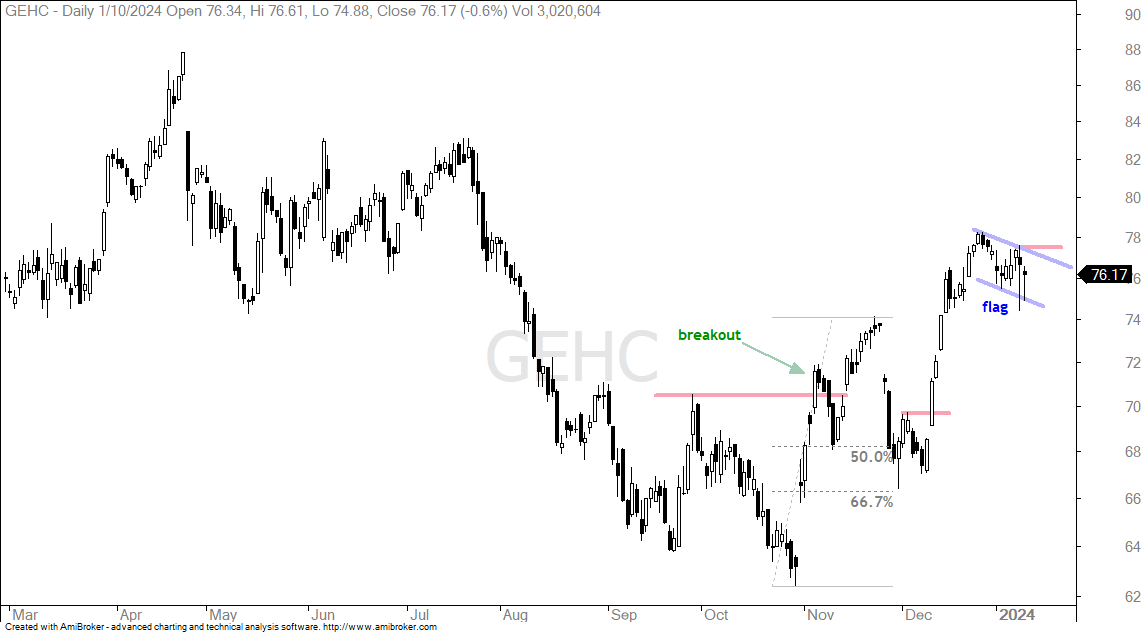
GE Healthcare (GEHC) sank with the rest of the market from July to October and then surged the last two months of the year. This move occurred with two exceptionally sharp moves that produced breakouts and higher highs. This means the trend is up. Most recently, GE surged in December and then formed a falling flag, which is a short-term bullish continuation pattern. A break above this week’s high would signal a continuation higher. Upon a breakout, I would mark re-evaluation support at 75.
Applied Materials Firms at Support-Reversal Zone
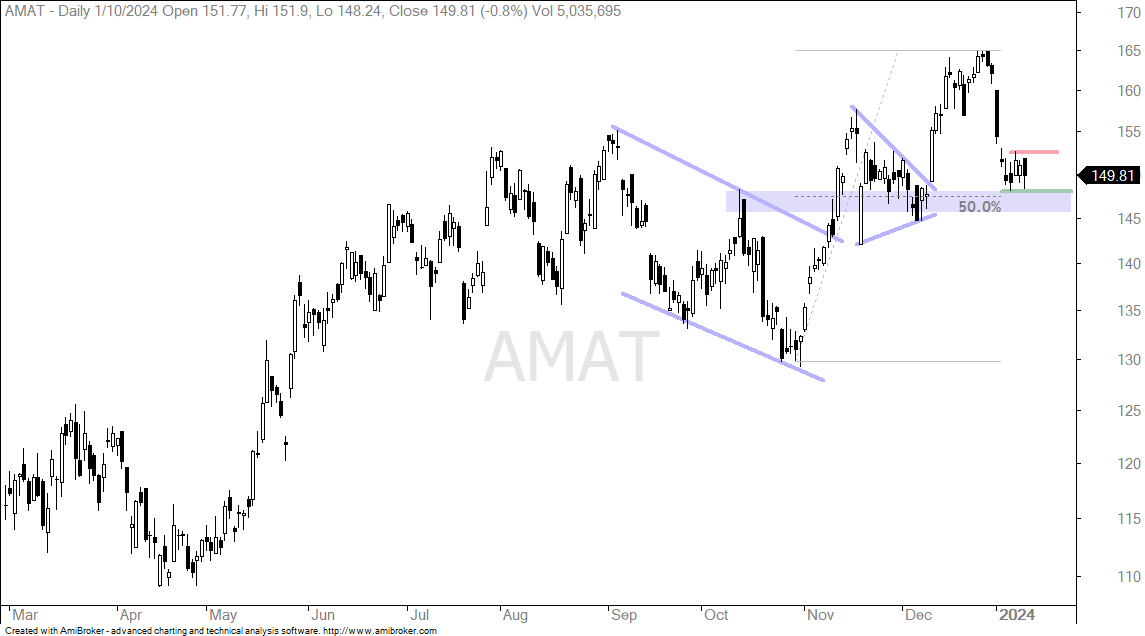
Applied Materials (AMAT) is part of the semiconductor equipment group. Semis led the market higher from late October to late December with many recording new highs. The group took a hard hit the first week of January with many falling rather sharply. AMAT fell back to the breakout zone and the apex of the prior triangle. Overall, this zone mark support. The decline also retraced 50% of the prior surge and this retracement marks a possible reversal area. AMAT firmed the last five days and a breakout at 153 would be short-term bullish. Upon a breakout, I would then mark re-evaluation support at 148.