Oversold Bounce, but 4wk Hi-Lo% has yet to Trigger
Oversold Bounces after Outsized Declines
10-yr Treasury Yield Still Rising
Staples and Utilities Still Leading (plus PBJ)
Uranium ETF Turns Up with Bigger Bullish Pattern
Revenge of Old School Semis
The next Chart Trader will be posted on Thursday morning, May 2nd.
Volatility is on the rise as we saw outsized declines into mid April and breaks below the 50-day SMAs for SPY and QQQ. Both rebounded the last six days and they are approaching the underside of their 50-day SMAs, which may turn into resistance. Overall, the long-term evidence remains bullish for stocks, but the short-term evidence is bearish. This means we are experiencing a correction within a bigger uptrend. Unfortunately, volatility is unlikely to subside this week because the Fed is starting its two-day meeting today and we are right in the middle of earnings season. Buckle up.
SPY Corrects into Keltner Channel
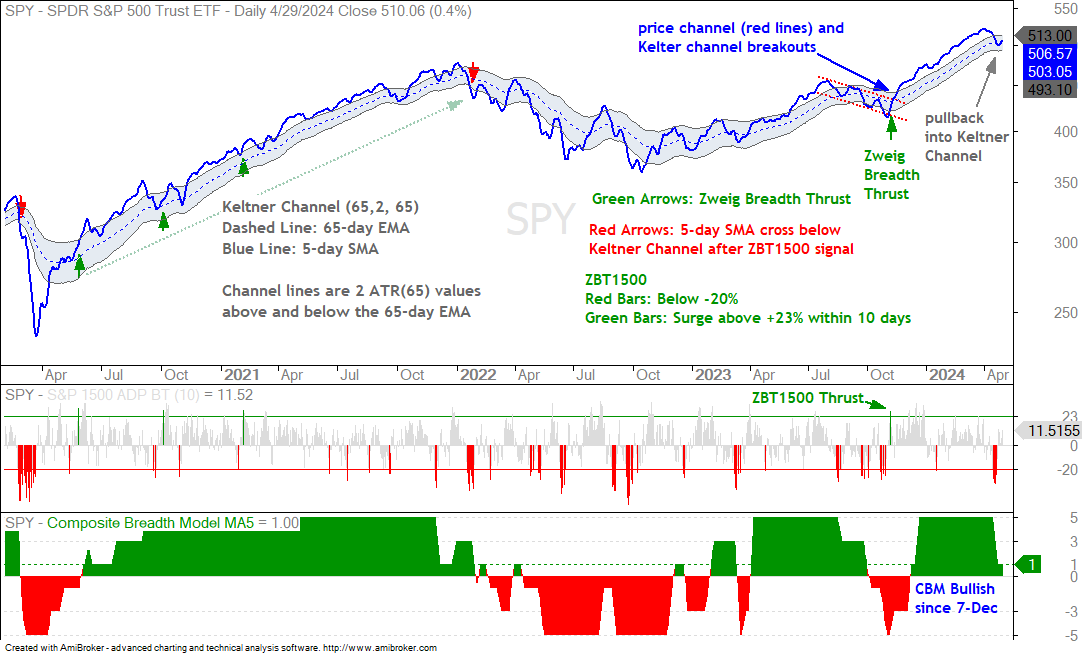
The weight of the evidence remains bullish for stocks and the April decline is considered a correction within this bull market. The chart below shows the 5-day SMA for SPY (blue line) moving back into the Keltner Channel. During the bull run from May 2020 to December 2021, pullbacks into the Keltner Channel provided tradable opportunities.
The first indicator window shows the 10-day EMA of S&P 1500 Advance-Decline Percent, which is used for the Zweig Breadth Thrust 1500. ZBT1500 dipped below -20% in mid April and this shows an oversold condition. The bottom window shows the 5-day SMA for the Composite Breadth Model at +1. We are in a bull market as long as this indicator is at +1 or higher.
Oversold Bounce, but 4wk Hi-Lo% has yet to Trigger
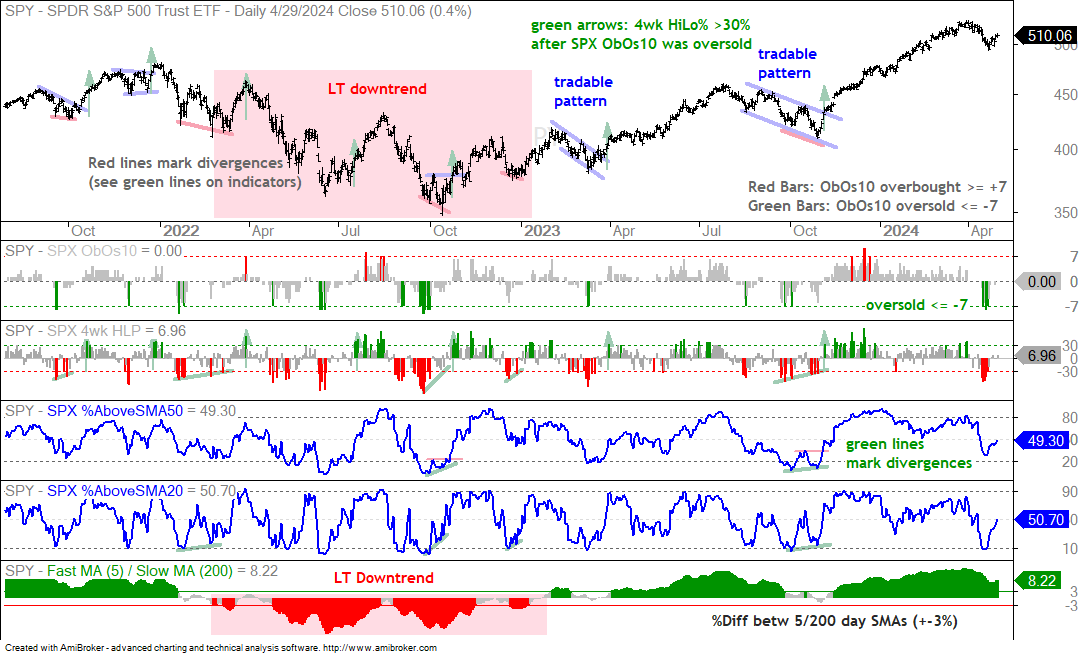
The next chart shows SPY with four short-term oscillators and a long-term trend indicator. These are explained in the paragraph below the second chart. The SPX ObOs10 indicator dipped to -7 and -8 from April 15th to 18th (green bars in first indicator window). SPX %Above 20-day SMA also dipped below 10% to become oversold (fourth indicator window). Oversold conditions provide the setup and we now need an upside catalyst. I do not see a tradable pattern on the price chart and SPX 4wk High-Low Percent has yet to cross above +30%. Thus, no signal yet.
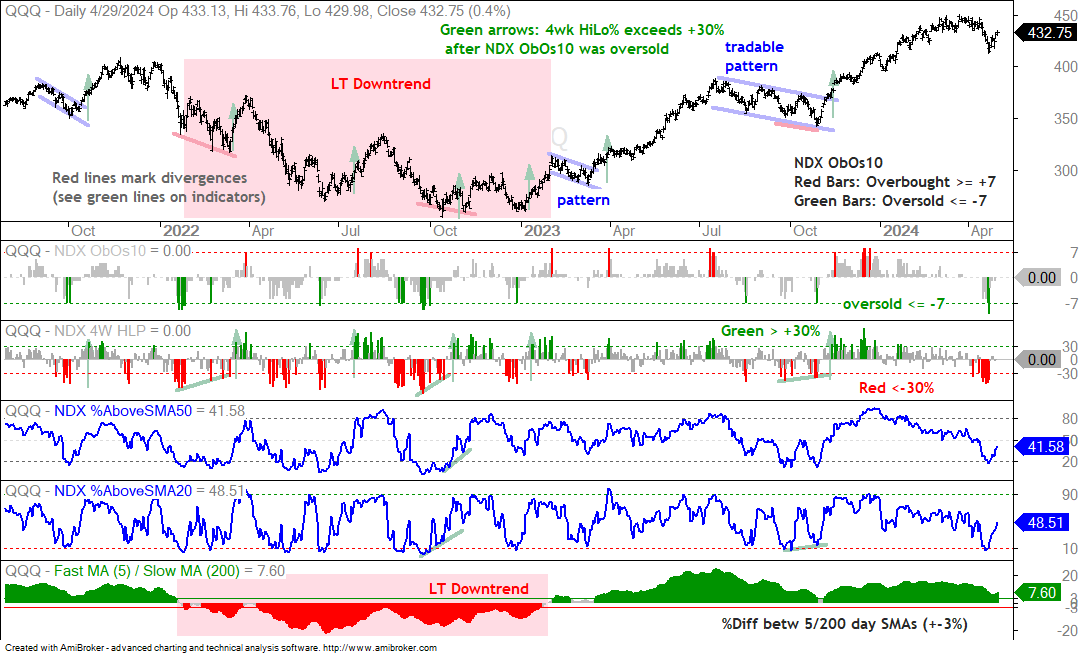
The next chart shows QQQ with the same indicators. NDX ObOs10 (first indicator) became oversold on April 18th and 19th (-7 and -10). NDX %Above 50-day SMA and NDX %Above 20-day SMA also became oversold with dips below 20% and 10%. These oversold conditions foreshadowed a bounce over the last six days. However, NDX 4wk High-Low Percent (second window) has yet to cross above +30%. This suggests that the bounce will be short-lived and we could see another push lower. A second push lower could lead to bullish divergences in the indicators and lead to a more robust signal.
About the Indicators: The charts above feature a long-term trend indicator in the bottom window and four short-term indicators to identify short-term bullish setups. I am using the percentage difference between the 5 and 200 day SMAs for the long-term trend. A break above +3% is bullish and stays bullish until a break below -3%. The red shading marks the long-term downtrend in 2022. The first indicator window shows SPX/NDX ObOs10, which aggregates overbought and oversold signals in 10 indicators. It is oversold at -7 or lower and overbought when at +7 or higher. I am mostly interested in oversold readings when the long-term trend is up. Once ObOs10 becomes oversold, I then look for short-term signals to suggest an end to the correction. First, a bullish signal triggers when 4wk High-Low Percent crosses above +30%. Second, I look for short-term bullish divergences in Percent above 20 and 50 Day SMA indicators. Third, I look for tradable patterns and breakouts on the price chart.
Oversold Bounces after Outsized Declines
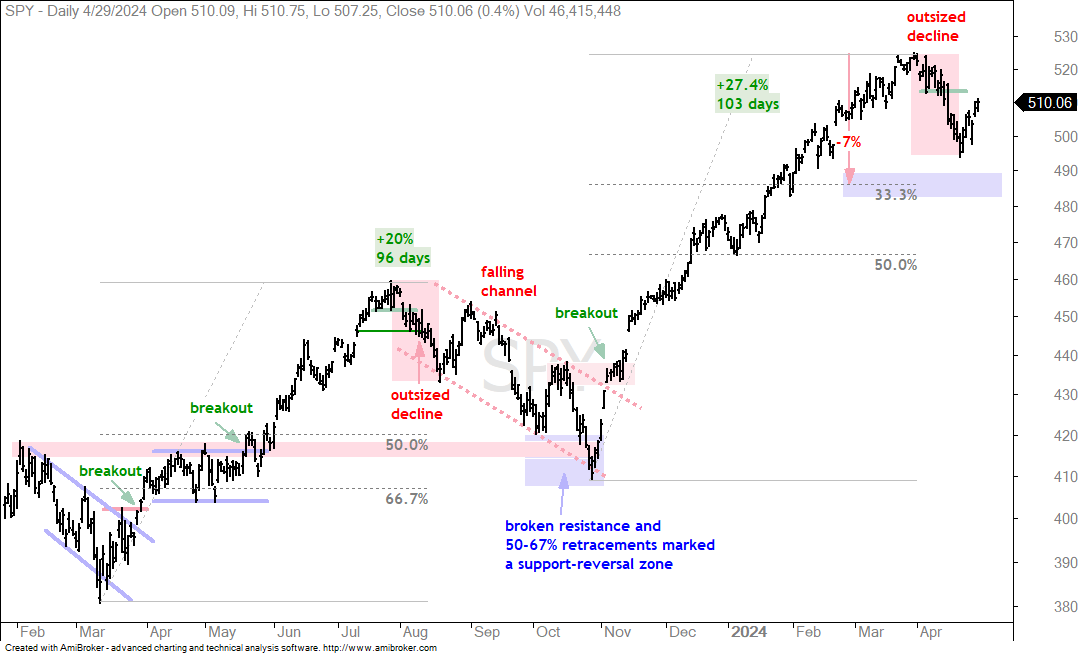
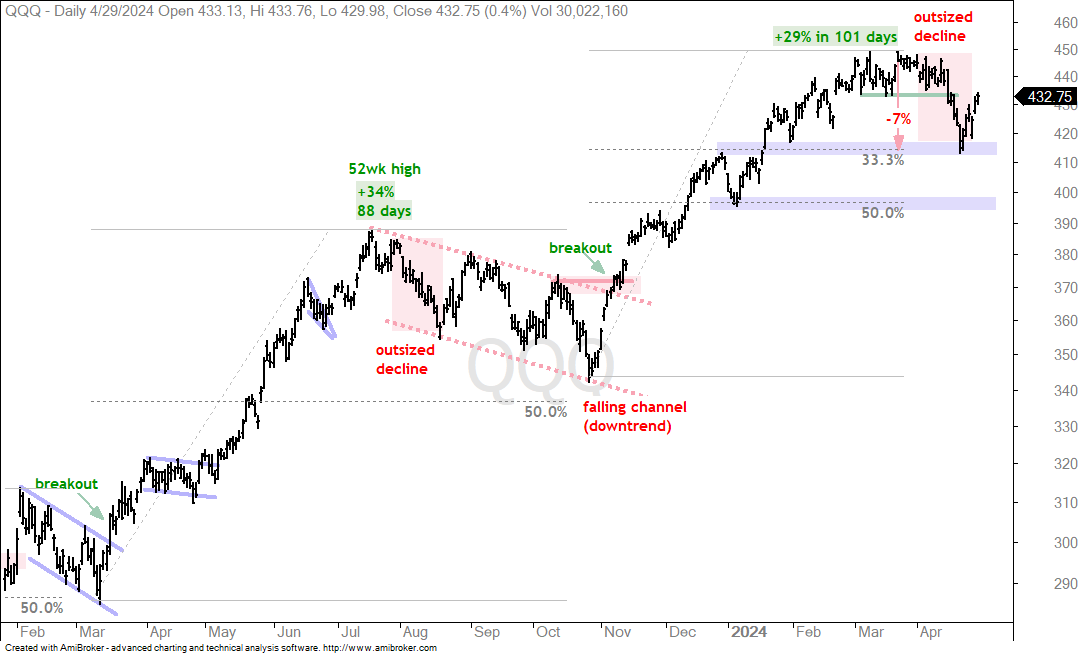
SPY and QQQ advanced from late October to March with massive moves and reversed these steep uptrends with outsized declines in April. Outsized declines show above average selling pressure that is enough to derail an uptrend, as in mid August 2023. These are not long-term bearish signals, but the immediate utprends reversed and we are now in corrective mode. SPY and QQQ became oversold in mid April and bounced over the last six days. We also saw a two week bounce in August 2023. The chart below shows SPY bouncing back above 510. I consider this a bounce within the correction because the 4-week High-Low Percent indicators did not trigger bullish. Overall, the downside target is the 485 area (33% retracement and February low).
The next chart shows QQQ with an outsized decline into mid April and an oversold bounce the last six days. The bounce in QQQ was stronger than the bounce in SPY because QQQ is already back to its support break. As with SPY, I consider this a dead-cat bounce because NDX 4wk High-Low Percent did not break above +30%. As such, I expect it to fail in the coming days and look for another push lower. This second push could provide a solid setup and signal to end the correction.
Chart Analysis, Setups and Trading Ideas
10-yr Treasury Yield Still Rising
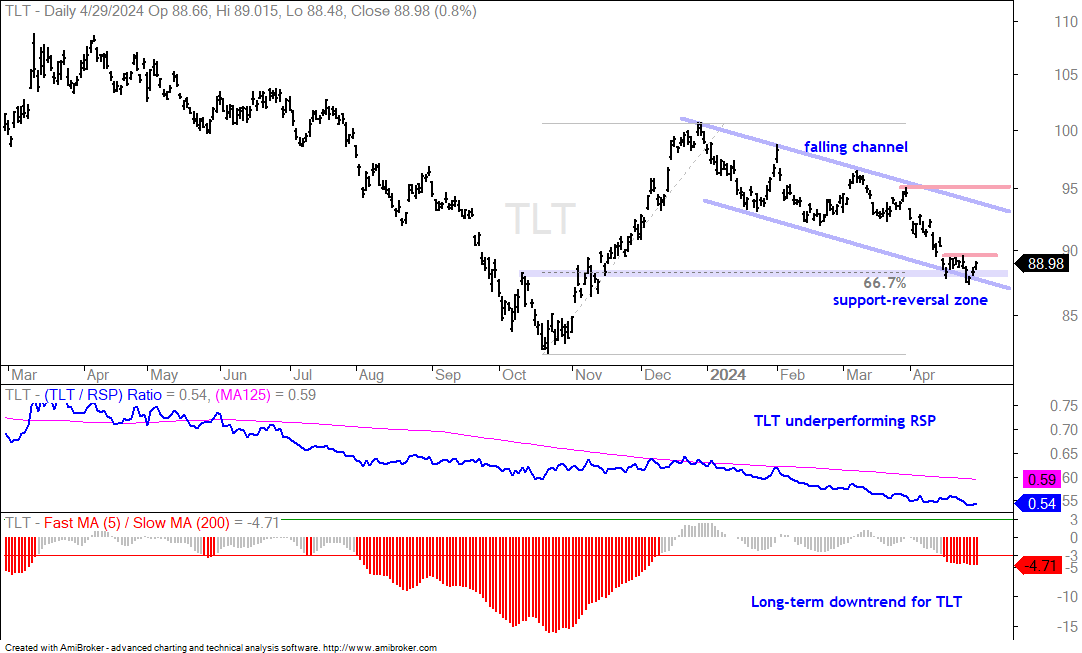
The Fed starts its two-day meeting today with a policy statement expected on Wednesday afternoon. Time to go fishing! This means bonds, the Dollar, gold and stocks will be subject to above average volatility. The chart below shows TLT in a long-term downtrend since February 2022, which is when the 5-day SMA was more than 3% below the 200-day SMA (see the 5/200 Differential in the bottom indicator window). TLT is also underperforming the S&P 500 EW ETF (RSP). On the price chart, a falling channel defines the downtrend since January. Despite all the negatives, TLT is trading in a potential Support-Reversal Zone marked by the 67% retracement and broken resistance (blue shading). The swing within the channel is down this month with short-term resistance marked at 90. A breakout here would be short-term bullish and could ignite a rally in stocks.
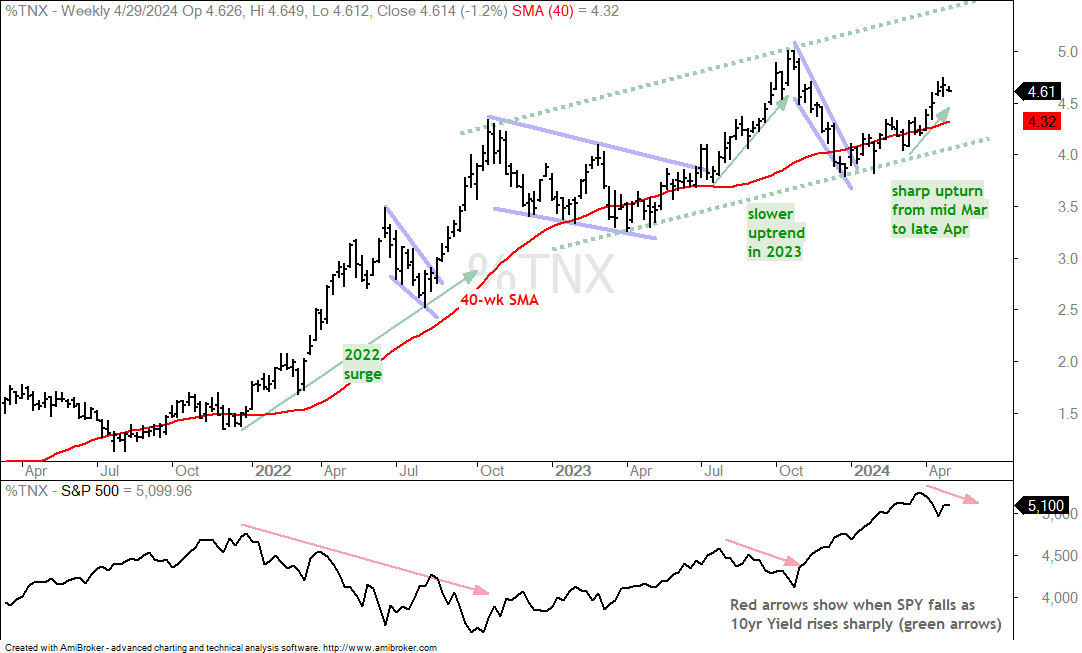
The next chart shows weekly bars for the 10-yr Treasury Yield. The long-term trend is up with a rising channel forming since late 2022. After falling in November-December 2023, TNX started working its way higher in the first quarter and then surged from 4% in mid March to 4.6% in late April. The steepness of this surge helped fuel the correction in stocks. This is why I am watching 90 on the TLT chart. An upturn in TLT would signal a downturn in the 10-yr Yield. Conversely, a negative reaction to the Fed could push the 10yr higher and further weigh on stocks.
Staples and Utilities Still Leading (plus PBJ)
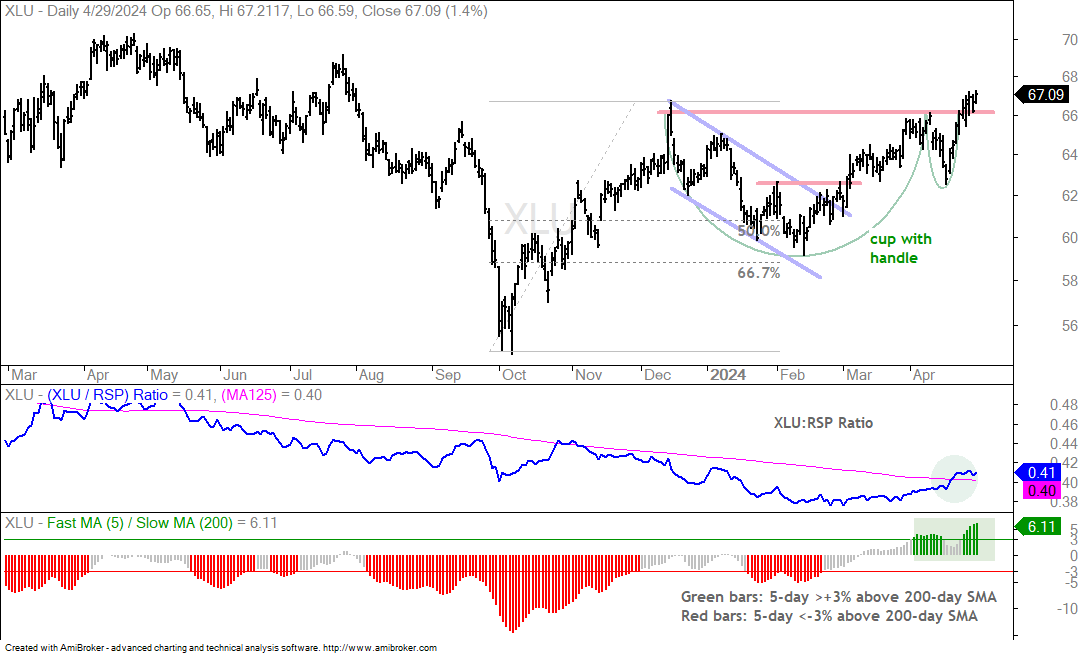
As noted last week, the Utilities SPDR (XLU) and Consumer Staples SPDR (XLP) are leading the market. These are defensive sectors that suggest some risk-aversion in the stock market. The chart below shows XLU breaking rim resistance of a bullish cup-with-handle pattern. The first indicator window shows the XLU:RSP ratio turning up as XLU out performs. The bottom window shows the percentage difference between the 5 and 200 day SMA exceeding +3%
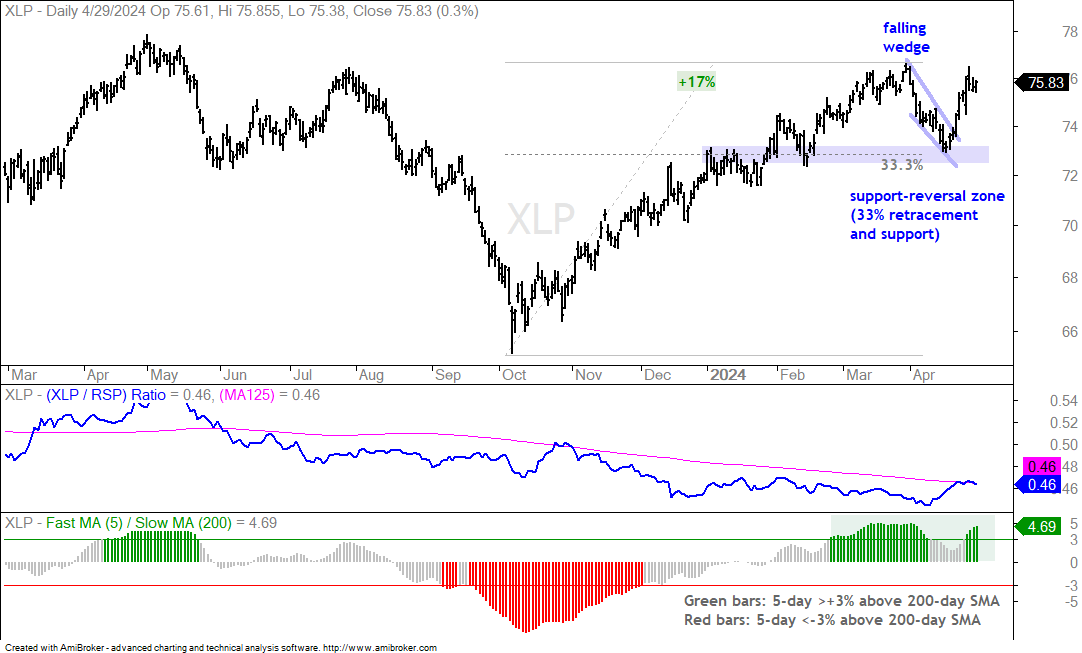
The next chart shows the Consumer Staples SPDR (XLP) extending on its falling wedge breakout.
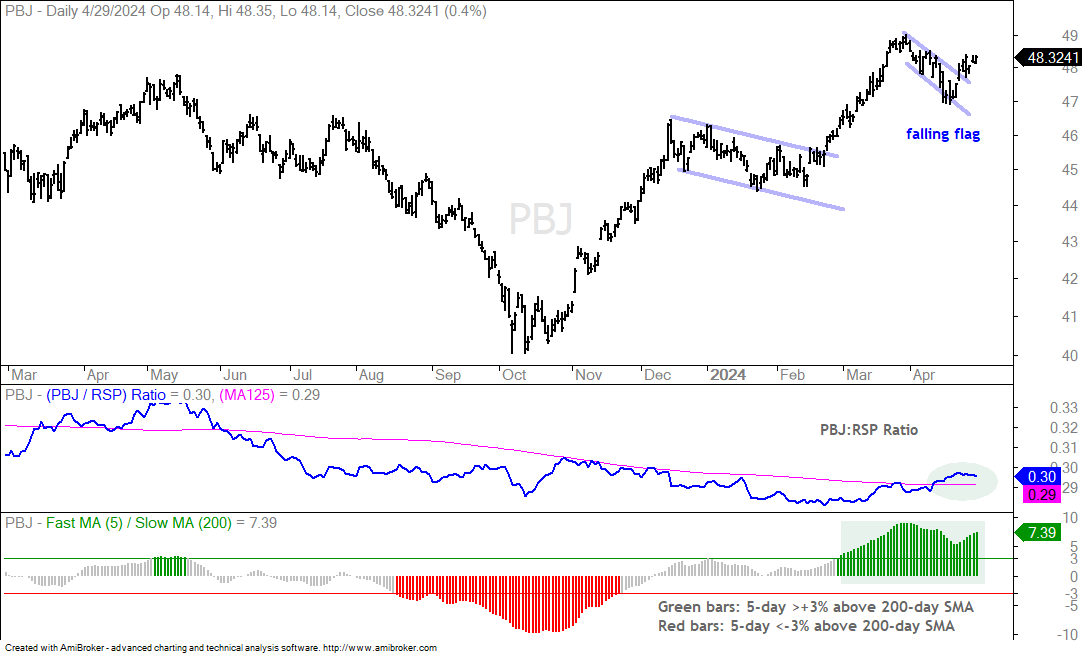
The next chart shows the Food & Beverage ETF (PBJ) with a falling flag breakout. The PBJ:RSP ratio is above its 125-day SMA and the 5/200 Differential signals a long-term uptrend.
Uranium ETF Turns Up with Bigger Bullish Pattern
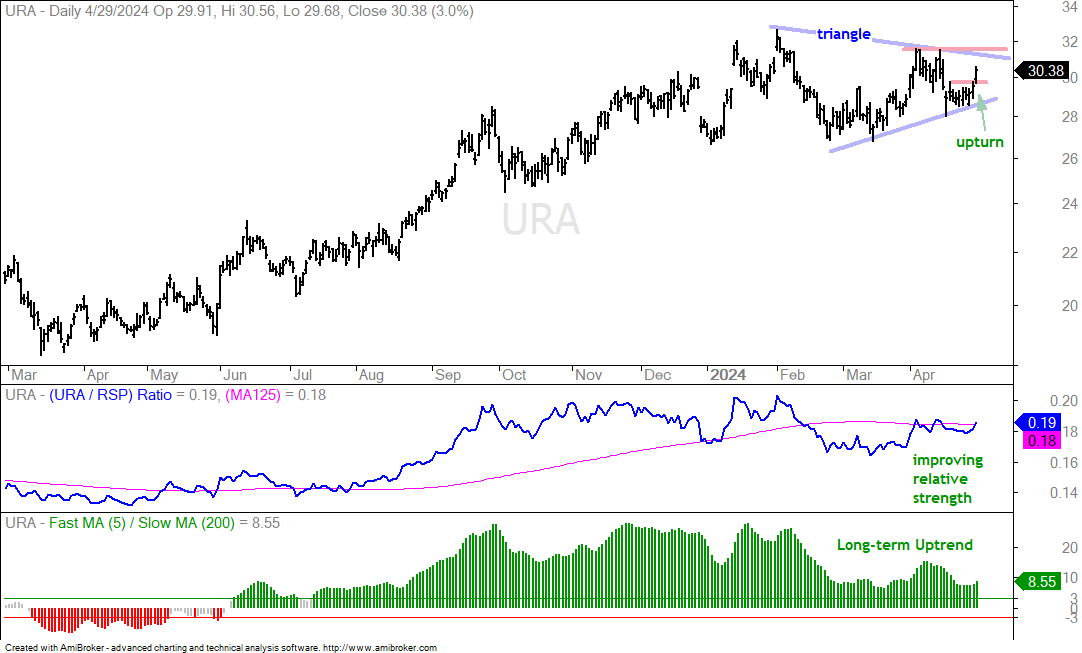
The next chart shows the Uranium ETF (URA) with a triangle forming within a long-term uptrend. A consolidation within an uptrend is a bullish continuation pattern. As such a break above the April highs would signal a continuation of this uptrend. The swing within the pattern turned up with a breakout on Monday. URA fell in mid April, firmed and broke short-term resistance. This upturn within the bigger bullish pattern increases the chances for a bigger breakout.
Revenge of Old School Semis
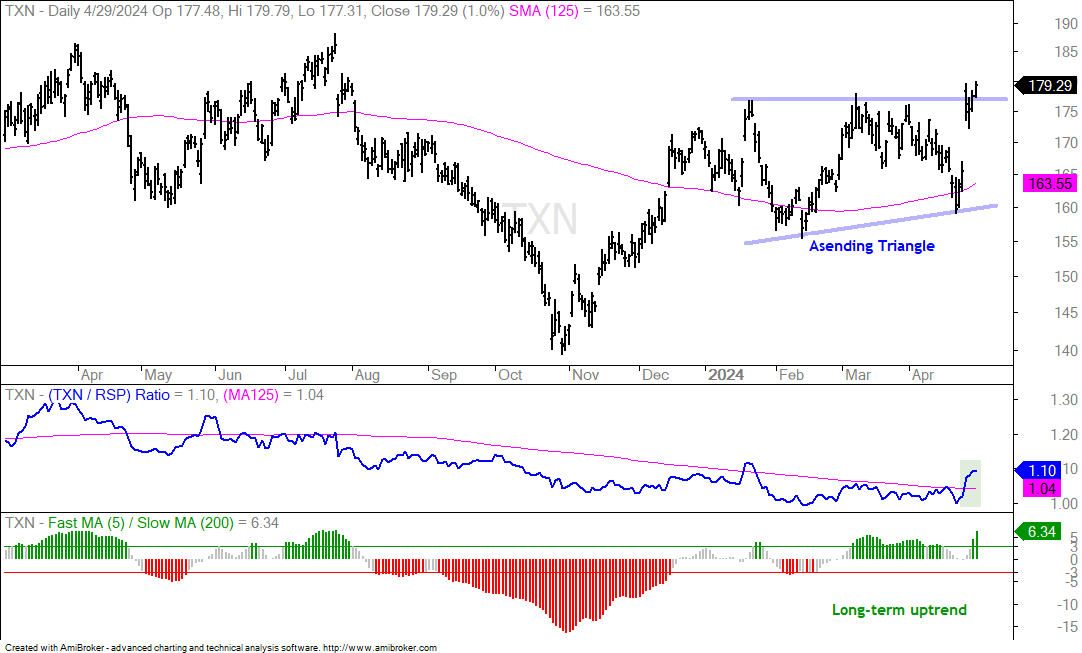
Some of the old school semiconductor stocks made big moves the last four days and broke out. AI plays got most of the attention in semiconductor stocks from November to February. Some of the more mundane names did not get any love and consolidated with trading ranges this year. This is changing with breakouts in Texas Instruments (TXN), Analog Devices (ADI) and Microchip Technology (MCHP). The first chart shows TXN forming an Ascending Triangle this year and breaking out with a gap-surge over the last four days.
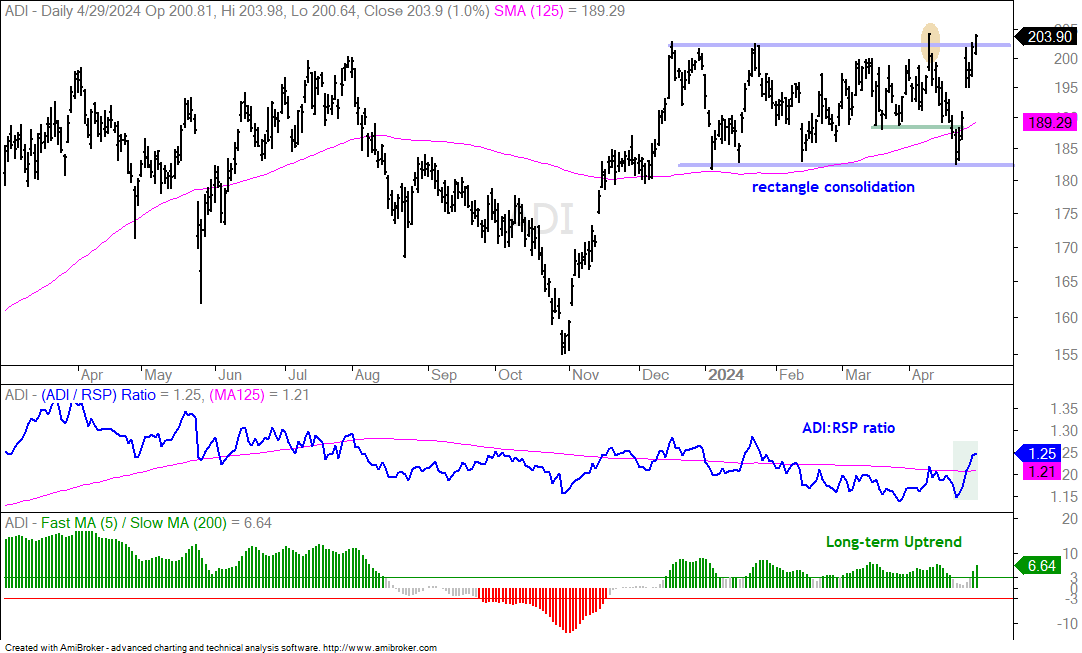
The next chart shows ADI breaking out on April 9th (yellow oval), but falling with the rest of the market into mid April. The stock broke short-term support and the 125-day SMA as the market swooned. ADI then made a u-turn with a surge-gap the last five days. Broad market weakness weighed on most tech stocks and semis in mid April. ADI was not immune, but recovered strong and is now leading.
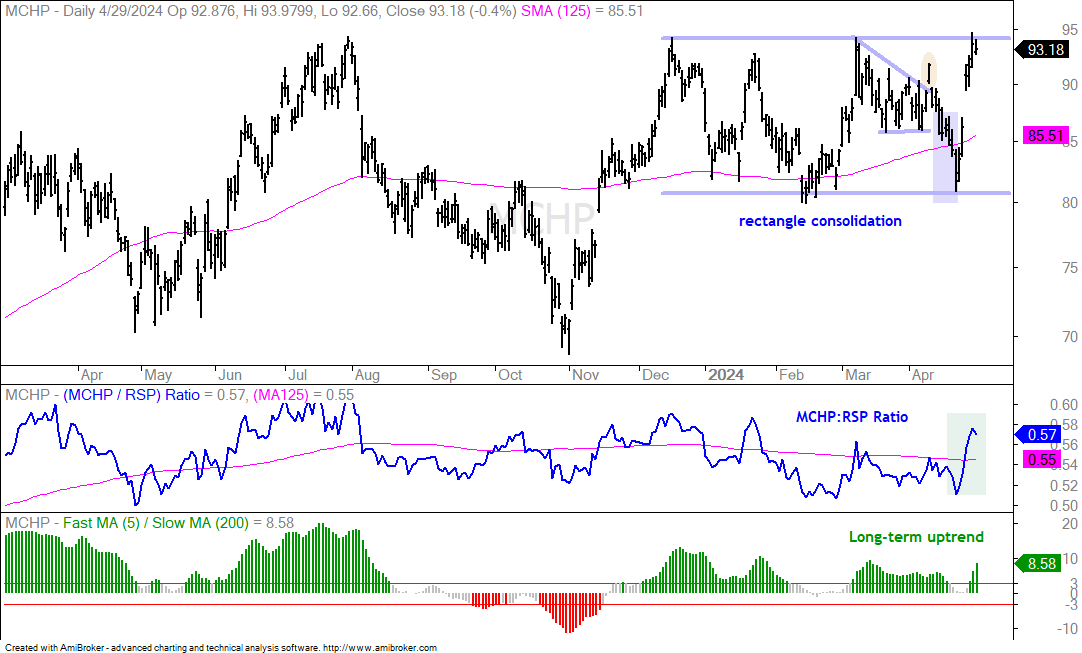
The next chart shows MCHP with a wedge breakout on April 9th and a plunge below the wedge low in mid April (blue shading). Again, broad market weakness weighed on MCHP. As with ADI, the stock recovered with a gap-surge the last four days and is poised to break out of a long rectangle consolidation.
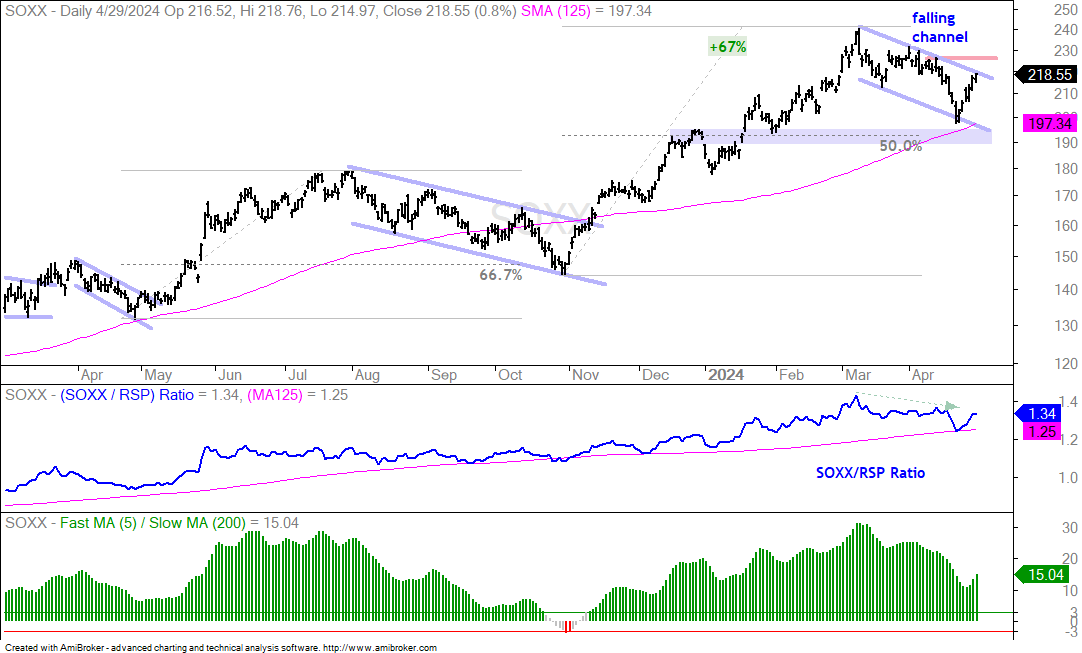
The next chart shows the Semiconductor ETF (SOXX) falling sharply into mid April and bouncing the last six days. The long-term trend is still up and the April decline is viewed as a correction. Despite the six day surge, I am not ready to call for an end to this correction. SOXX has yet to break out of the falling flag or break resistance from the 11-April high (red line).