Tech Groups Still Leading Lower (SOXX, CIBR, IGV, SKYY)
Banks Holds Up and Leads (KBWB)
Money Moves into Defensive Plays (XLU, XLP, PBJ, XLV)
The next Chart Trader will be posted on Thursday morning, April 25th.
Stocks were hit with strong selling pressure in April, but the weight of the evidence remains bullish. This means the decline is viewed as a correction within a bigger uptrend. Most stock-based ETFs and stocks will remain under pressure as long as SPY and QQQ are in corrective mode. I am marking the first correction targets, but it is almost impossible to predict the length or duration of any move. Most of my focus is on short-term breadth indicators and momentum oscillators for SPY and QQQ. These can help identify an end to the correction and they are covered in detail below.
Zweig Breadth Thrust Sets Up
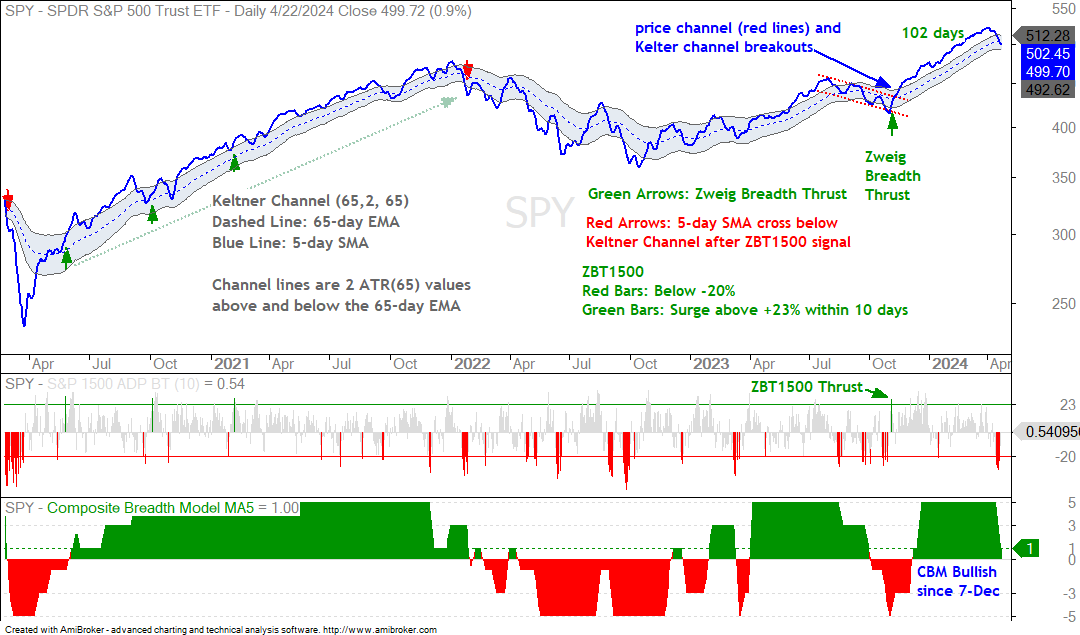
As noted on Saturday, the Composite Breadth Model fell to +1 and its 5-day SMA hit +1 on Monday (lower indicator window). Broad weakness in April pushed the Thrust Models into negative territory. The Trend Models and 5/200 cross for the S&P 500 remain bullish. Thus, the CBM is still positive and we are still in a bull market.
The price chart shows the 5-day SMA for SPY with the Keltner Channel (65, 2, 65). The 5-day SMA was above the upper Keltner line for 102 days and this was the third longest streak in 30 years. This streak ended last week as the 5-day SMA fell into the Keltner Channel. A look back to 2020 and 2021 shows that dips into the Keltner Channel represent pullbacks within a bigger uptrend.
The middle indicator window shows the Zweig Breadth Thrust moving below -20% last week (red bars). This is a short-term oversold condition and a subsequent move above +23% (within 10 days) would trigger another Zweig Breadth Thrust. Notice that there were continuation breadth thrusts in October 2020 and February 2021 (green arrows). These are like bullish continuation signals.
The April decline is considered a correction within a bigger uptrend and we saw oversold readings last week. Oversold conditions within a long-term uptrend provide opportunities. Thus, we have a “set up” in the making. But when does a setup turn into a signal? For that we will look for tradable patterns, indicator divergences and indicator breakouts. The challenge, as always, is to identify robust signals and avoid whipsaws.
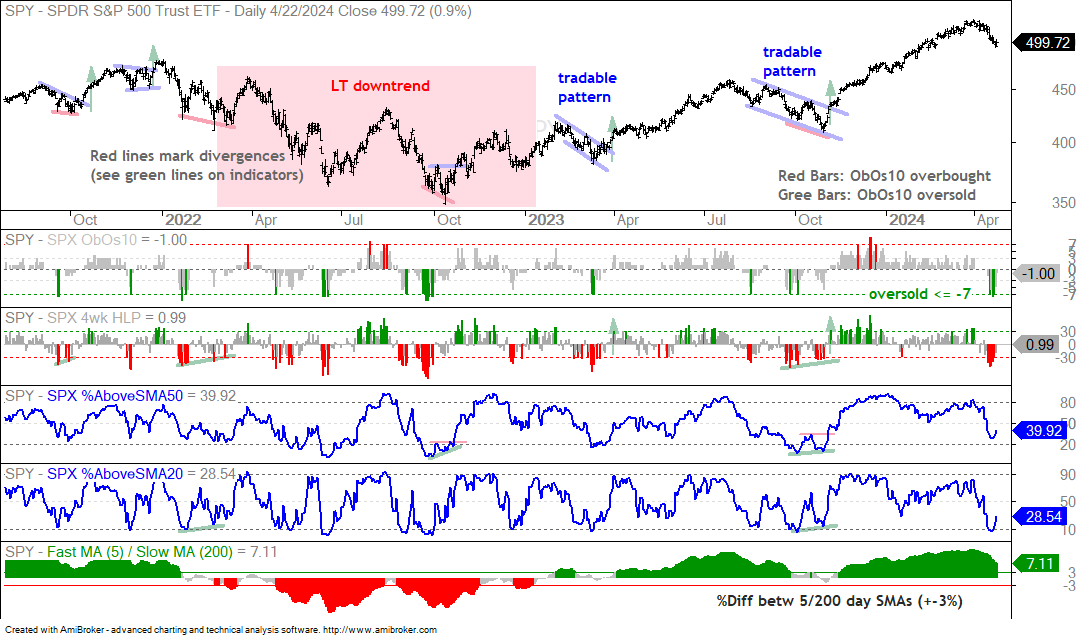
The next charts show SPY and QQQ with a long-term trend indicator in the bottom window and four short-term indicators. I am using the percentage difference between the 5 and 200 day SMA for the long-term trend. A break above +3% is bullish and stays bullish until a break below -3%. The red shading marks the long-term downtrend in 2022. The first indicator window shows SPX ObOs10, which aggregates overbought and oversold signals in 10 indicators. It is oversold at -7 or lower and overbought when at +7 or higher. In general, I am mostly interested in oversold readings when the long-term trend is up. Oversold is the current setup as SPX ObOs10 dipped to -7 and -8 last week.
Now for the possible signals. I do not see a tradable pattern or a possible bullish divergence yet. The blue lines mark the falling flag into March 2023 and the falling channel into October 2023. Breakouts provide the tradable signals for price patterns. I do not see bullish divergences in the indicators. Note that we saw bullish divergences in October 2023 as SPY forged a lower low (red line) and 4wk High-Low Percent formed a higher low (green line). The only thing left is an indicator breakout signal. The green arrows show when 4wk High-Low Percent surges above +30% (after an oversold setup). Chartists can also consider +20% for signals, but the risk of whipsaw is higher (such as late August 2023). At this time, the correction in SPY remains a work in progress until 4wk High-Low Percent surges above +30%.
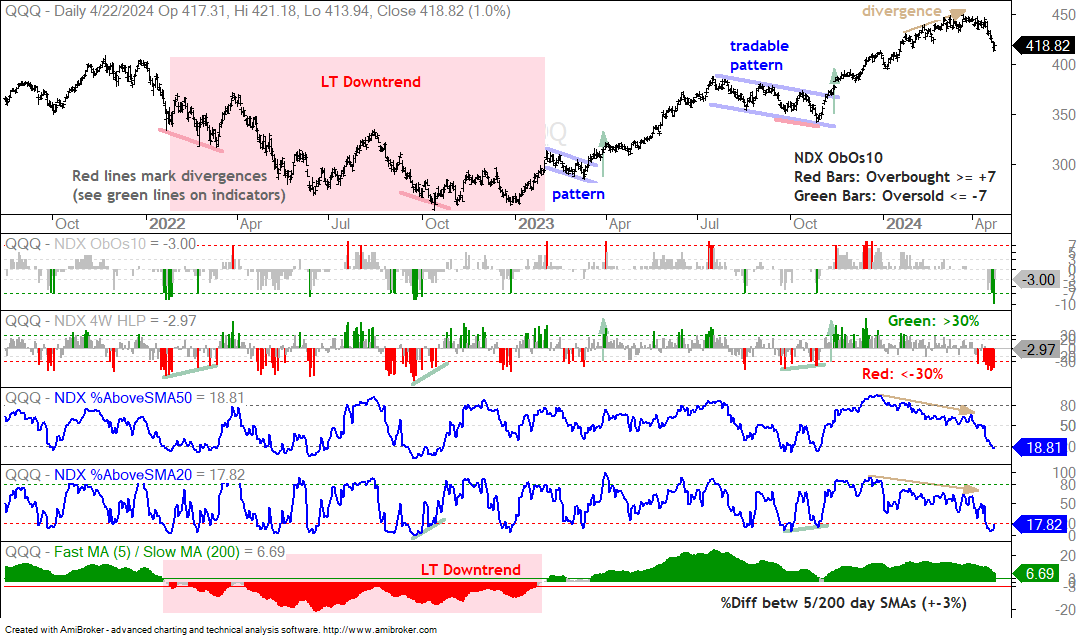
The next chart shows QQQ with the same indicators. The long-term trend turned up in January 2023 when the 5-day SMA was more than 3% above the 200-day SMA. NDX ObOs10 did not become oversold in March 2023, but a falling flag formed and NDX 4wk High-Low Percent surged above +30% for a confirming signal. There was a correction from mid July to late October 2023 with oversold readings in mid August and late October. Technically, QQQ became oversold in mid August and remained oversold for another two months as it moved lower. The correction did not end until NDX 4wk High-Low Percent surged above +30% (green arrow). Presently, QQQ is oversold, but I do not see a tradable pattern or indicator divergence yet. At this point, a surge above +30% in 4wk High-Low Percent would reverse the short-term downtrend (correction).
About the Indicator: 4-wk High-Low Percent is the percentage of 4-week highs less the percentage of 4-wk lows within an index. In an effort to reduce whipsaws, these indicators turn bullish with a move above +30% (green bars) and bearish with a move below -30% (red bars).
SPY and QQQ Near 33% Retracement Lines
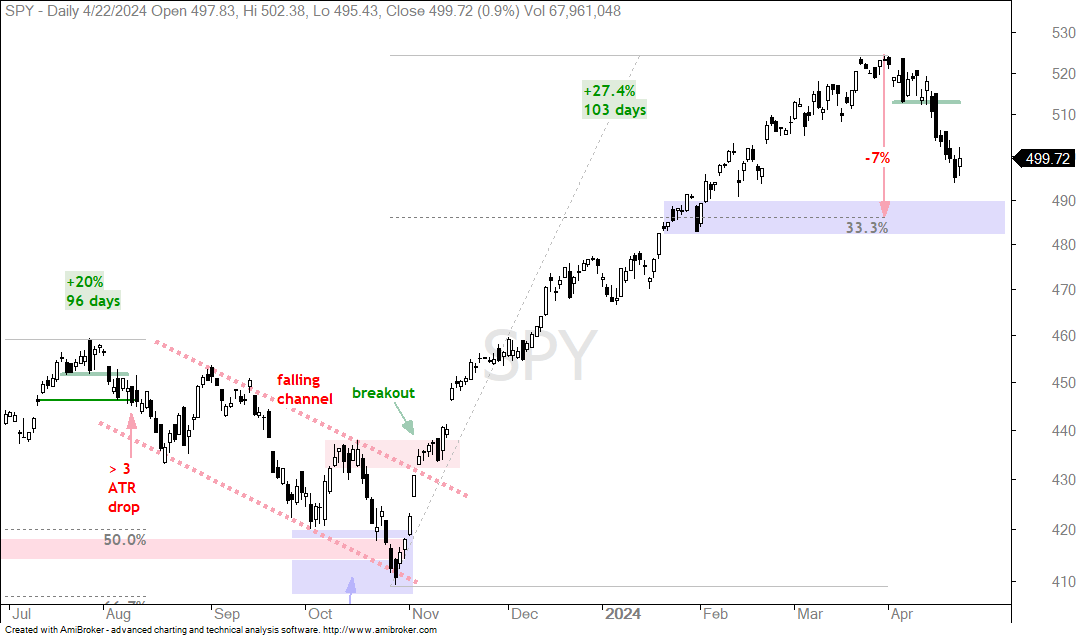
The next charts shows candlesticks for SPY and QQQ. Marking downside targets and support levels is like asking 10 economists for a GDP target. You will get 11 answers, at least. We can draw lines, add retracements, mark broken resistance and even place indicators, such as volume by price, until we are blue in the face. One could easily come up with a dozen targets between 430 and 500. One of them will eventually be right! I will provide one target, but my main focus is on the short-term downtrend and the analysis on the charts above. The chart below shows SPY with the first target in the 485 area. This marks a 33% retracement of the 27.4% advance.
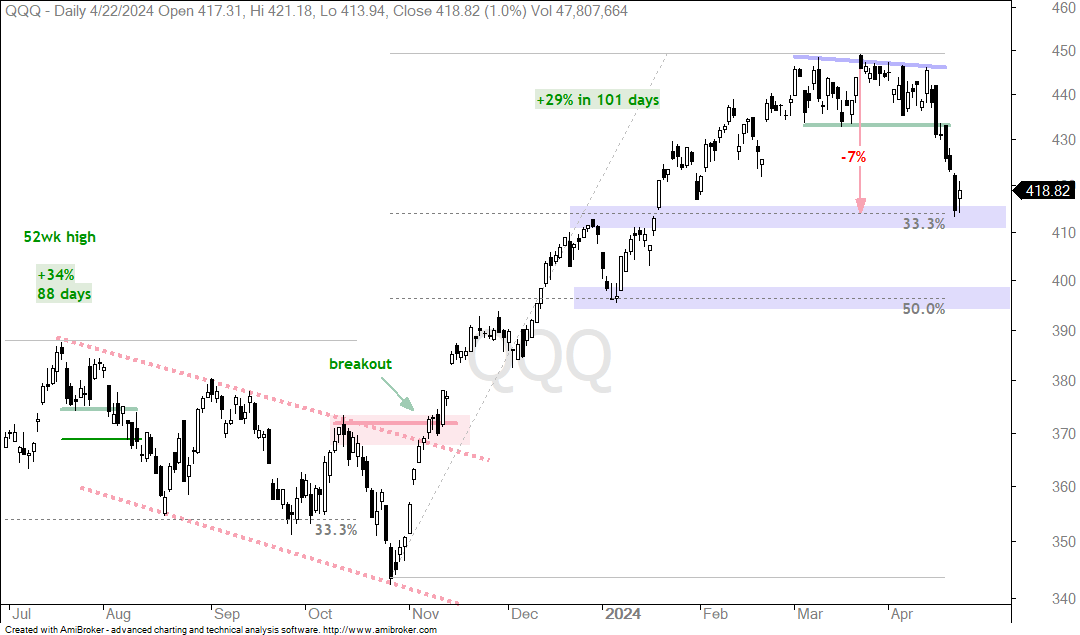
The next chart shows QQQ hitting it first target after a 7% decline from the high. Broken resistance and the 33% retracement mark this target in the 410-415 area.
Chart Analysis, Setups and Trading Ideas
Tech Groups Still Leading Lower (SOXX, CIBR, IGV, SKYY)
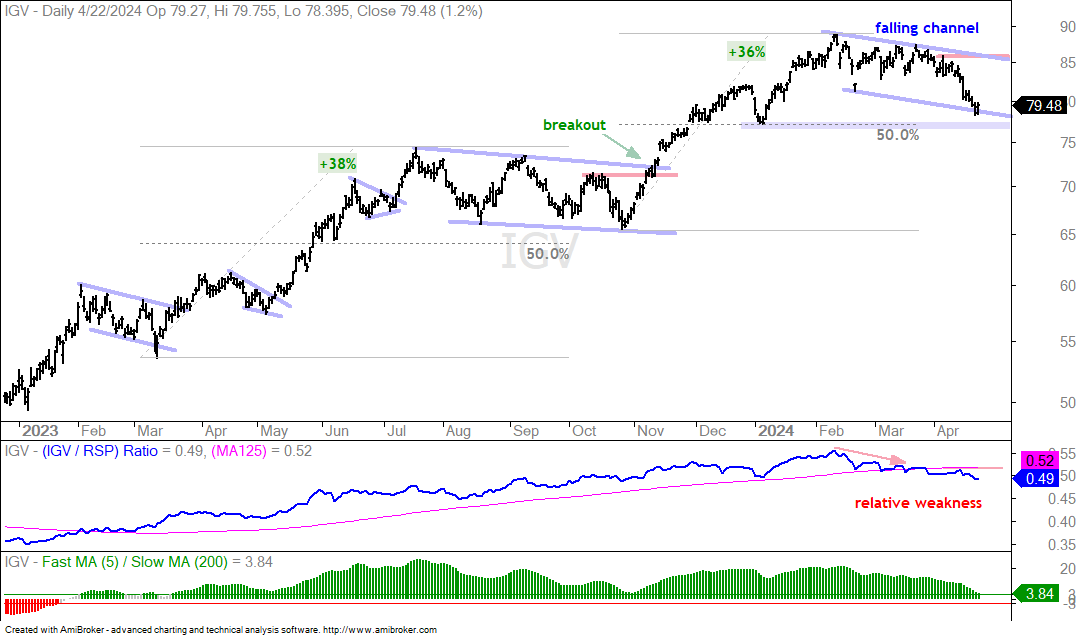
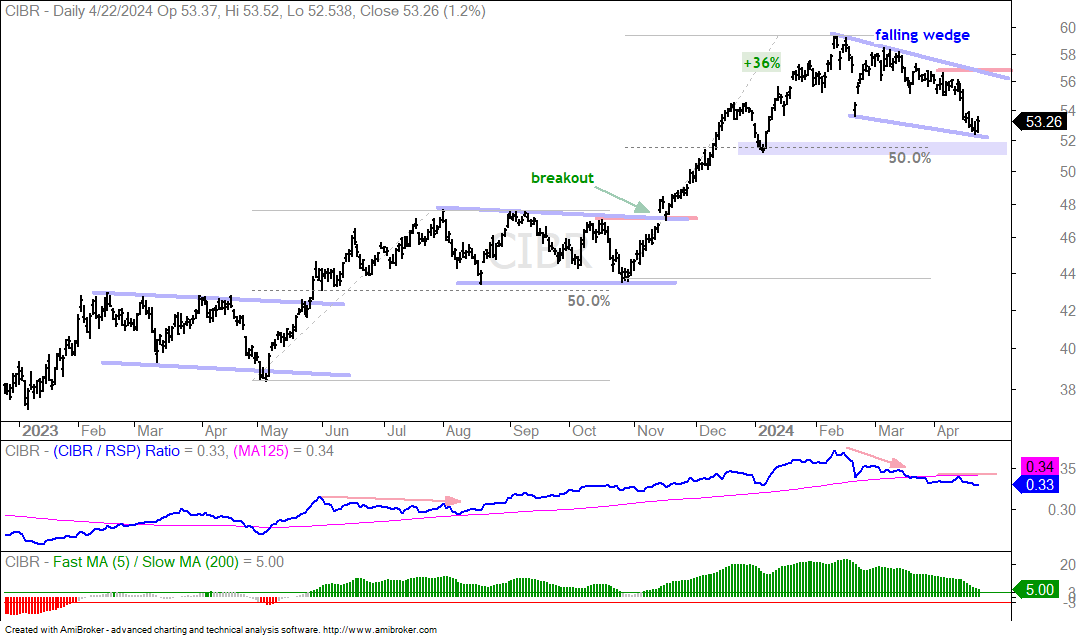
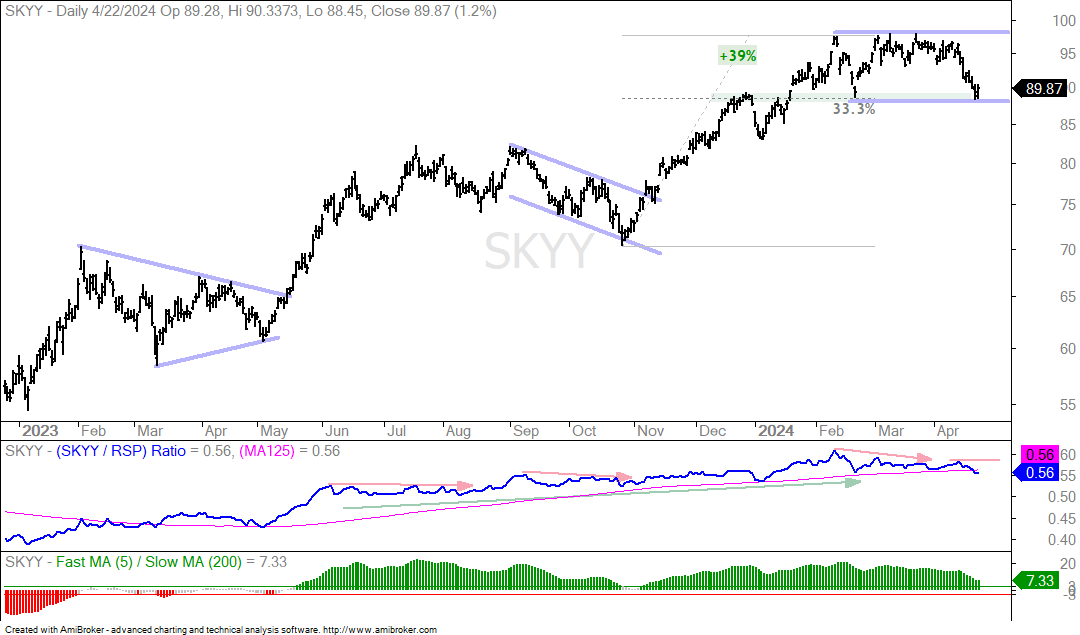
Tech stocks and ETFs led the market higher into February, but they started lagging and led the way lower over the last 1-2 months. As with SPY and QQQ, the key tech ETFs are correcting within long-term uptrends. However, I have yet to see any signs of relative strength that could foreshadow an end to the corrections. The next four charts show price charts, the price-relative (IGV/RSP ratio) and the Percent Difference between the 5 and 200 day SMAs (with signal thresholds at +3 and -3%).
The Software ETF (IGV) and Cybersecurity ETF (CIBR) started this correction process with sharp declines in mid February, lower highs in March and lower lows in April. The first chart shows IGV with a downtrend since mid February. This decline is considered a correction within a bigger uptrend. The bottom window shows that the 5-day SMA is 3.84% above the 200-day SMA. This long-term trend indicator has been bullish since late January 2023 and would turn bearish with a move below -3%. Until then, declines are considered corrections within a bigger uptrend. A falling channel could be forming with resistance at 86. The IGV/RSP ratio fell since mid February as IGV underperformed. A breakout above the early April high is needed to show relative strength again.
The next chart shows the Cybersecurity ETF (CIBR) with a falling wedge that retraced a little less than 50% of the 36% advance. This is a corrective pattern and a breakout at 57 would signal a continuation higher. The CIBR/RSP ratio fell the last two months and a break above the mid April high is need to show a return to relative strength.
The next chart shows the Cloud Computing ETF (SKYY) testing its February low and holding up better than IGV (and SPY and QQQ). The ETF surged 39% and then consolidated with a trading range (88 to 98). SKYY is testing support and this is a moment of truth. The SKYY/RSP ratio fell since February, but the decline was not as pronounced as SKYY held up relatively well.
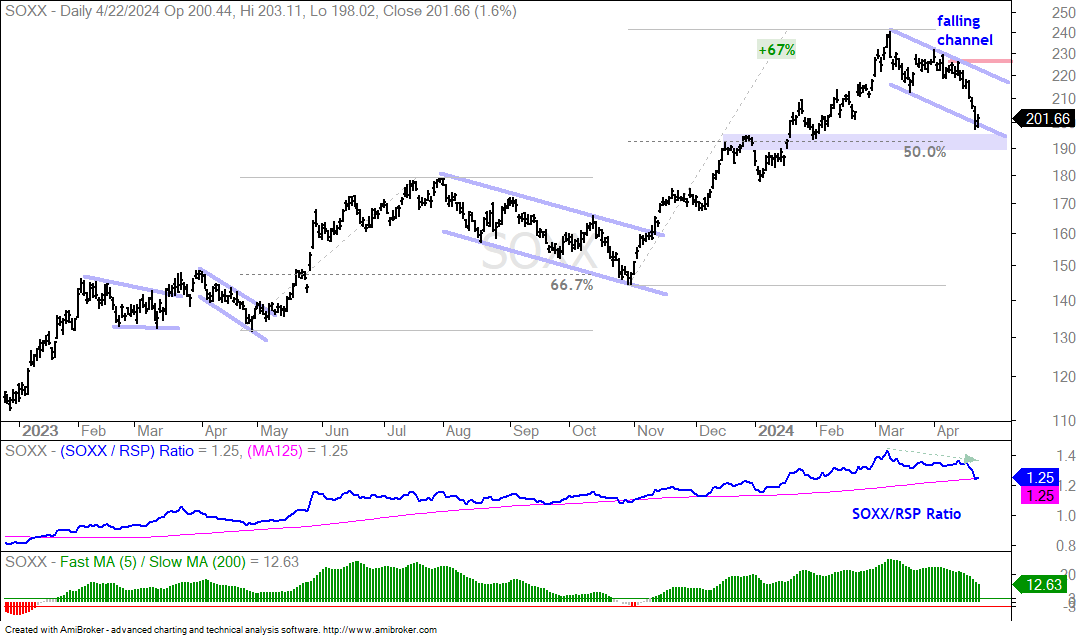
The next chart shows the Semiconductor ETF (SOXX) hitting a new high in mid March as it continued leading higher. The ETF then fell sharply in April and a retraced almost 50% of the 67% advance. Again, this is a correction within a bigger uptrend and I am marking channel resistance at 226.
Banks Hold up and Lead (KBWB)
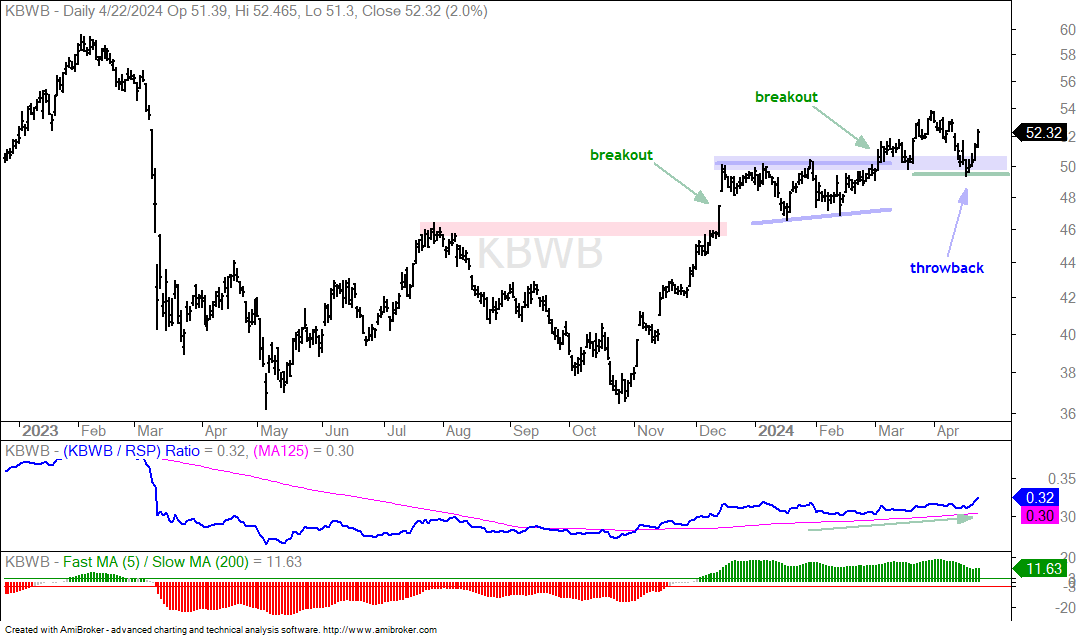
The next chart shows the KBW Bank ETF (KBWB) holding up well in April and outperforming. KBWB broke out of a big Double Bottom in December, consolidated into early March and broke out again in mid March. The breakout zone around 50 turned into support as the ETF fell back into April. This “throwback” to the breakout zone held as KBWB surged the last four days.
Money Moves into Defensive Plays (XLU, XLP, PBJ, XLV)
I am not a big fan of the Utilities SPDR (XLU) and the Consumer Staples SPDR (XLP) from a trading perspective. However, these ETFs provide information on the market mood because they are defensive sectors. A risk-averse or risk-off environment is more prominent when defensive groups lead. XLU and XLP are starting to lead. As is the Food & Beverage ETF (PBJ).
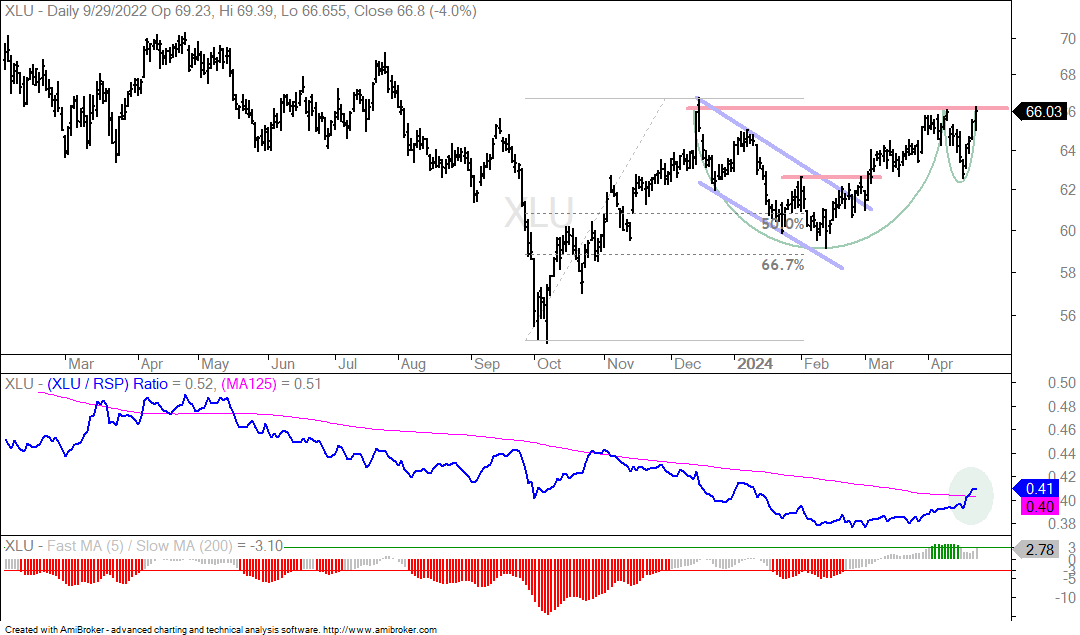
The first chart shows XLU challenging resistance from the December high. The green arcs show a possible cup-with-handle, which is a bullish continuation pattern. A breakout would be bullish. The bottom window shows the 5/200 differential turning bullish with a move above 3% in late March (green bars). This reverses a downtrend that started in September 2022. The middle window shows the XLU/RSP ratio turning up and exceeding its 125-day SMA.
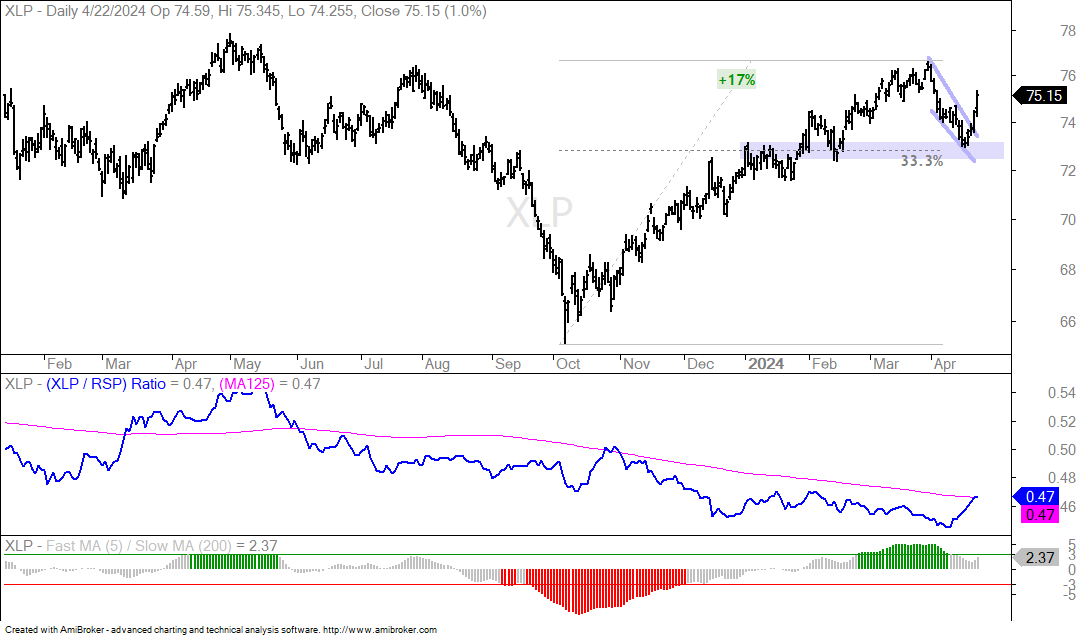
The next chart shows the Consumer Staples SPDR (XLP) advancing 17%, retracing 33% with a falling wedge and breaking out the last two days. The XLP/RSP ratio turned up in April and is poised to break its 200-day SMA. The 5/200 differential turned green (>3%) in late February and this argues for a long-term uptrend.
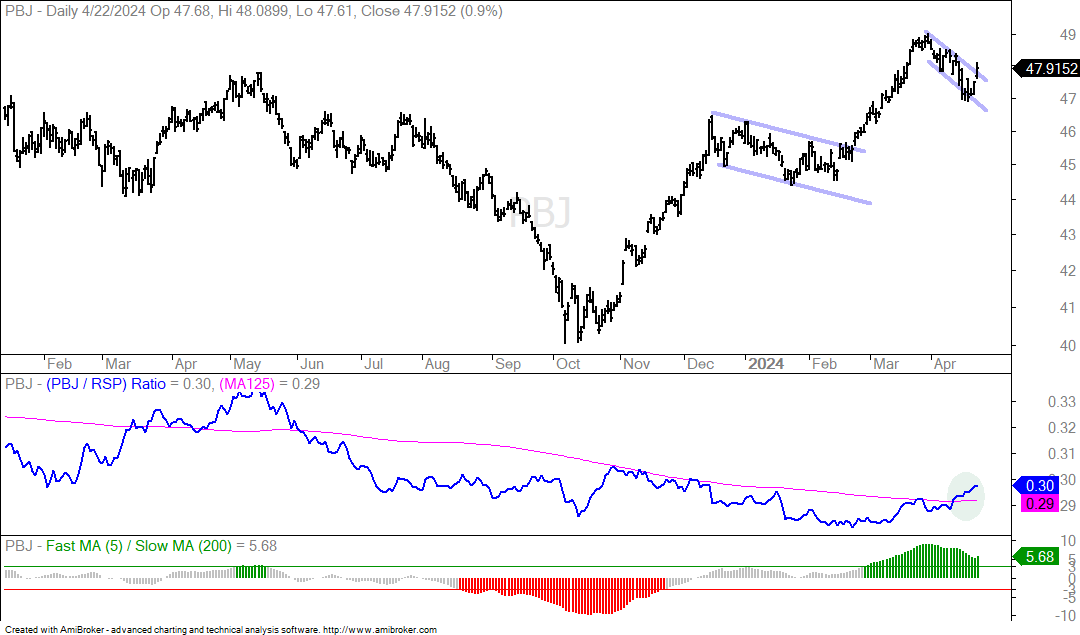
The next chart shows the Food & Beverage ETF (PBJ) hitting a new high in March, correcting in April with a flag and surging the last two days. The price-relative (PBJ/RSP ratio) turned up in March-April and exceeded its 125-day SMA. The 5/200 differential turned bullish in late February.
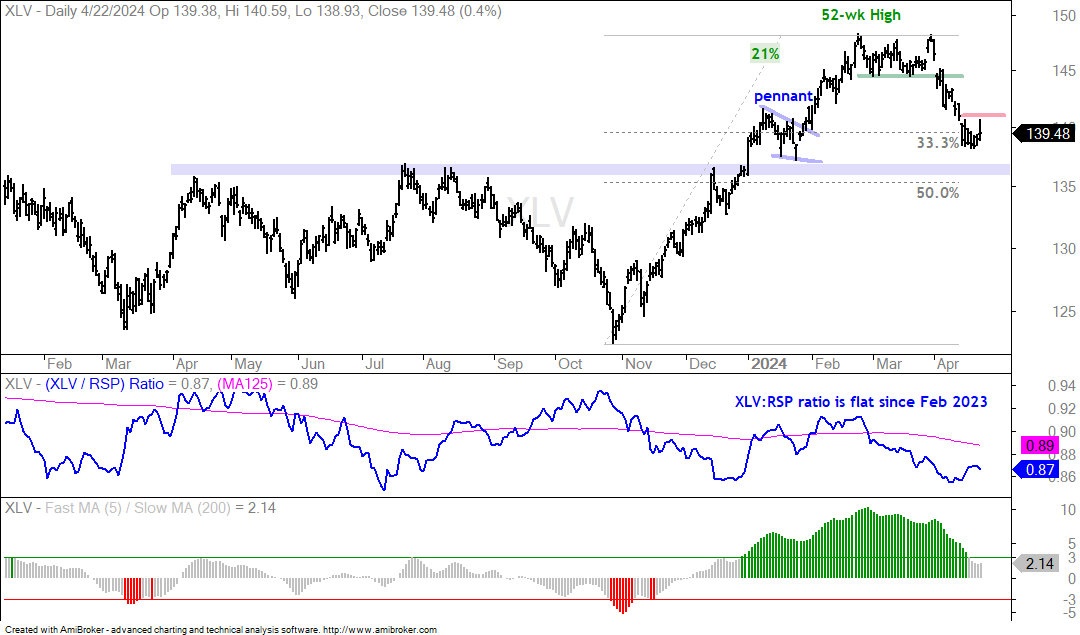
The Healthcare SPDR (XLV) fits into the defensive area of the stock market, but it did not hold up well in April. XLV surged 21% and hit a new high in February. It then stalled and broke short-term support in early April. The April decline retraced 33-50% and remains just above the prior breakout zone (blue shading). XLV is firming and finding support near the prior pennant. A breakout at 141 would be positive.