The next Chart Trader will be posted on Tuesday morning, April 23rd.
Bearish Breadth Thrusts
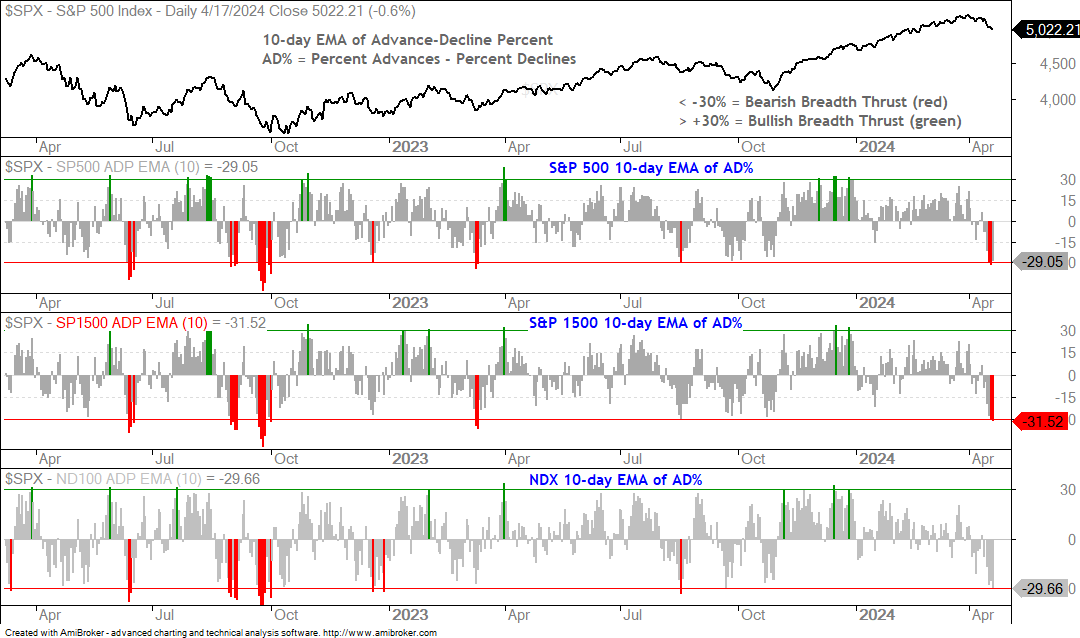
Stocks were hit with strong selling pressure here in April. This selling pressure triggered outsized declines and bearish breadth thrusts. The chart below shows the 10-day EMAs of AD% for the S&P 500 and S&P 1500 exceeding -30% this week (red bars). This is a bearish breadth thrust that shows broad downside participation. The uptrend, which began with the November breakout, has been derailed. Even so, the longer term indicators are still bullish and this is considered a correction.
There are many reasons for the correction. Stocks were overdue after a massive bull run, the 10-yr yield surged the last few weeks and tech earnings are on deck. Tech earnings are likely to impress, but this good news is perhaps already baked into the cake. This means we could have a “buy the rumor and sell the news” scenario. AI driven earnings were the rumor and stocks are now delivering the news. Traders are taking profits with this news and will likely reposition after a pullback.
Market Highlights - And Lowlights
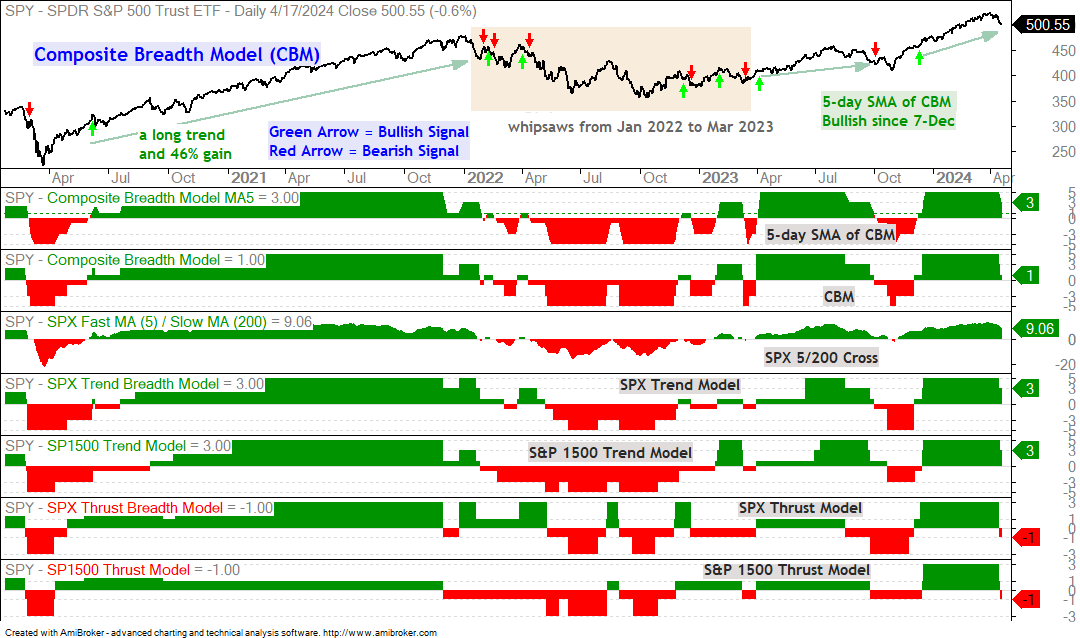
Composite Breadth Model fell to +1 and remains bullish
SPX and S&P 1500 Thrust Models turned bearish
SPX and S&P 1500 Trend Models remain bullish
SPX 5-day SMA is 9% above rising 200-day SMA
SPY and QQQ broke their ATR-SAR lines (outsized declines)
SPY is short-term oversold after falling 4.3% this month
QQQ is short-term oversold after falling 4.1% this month
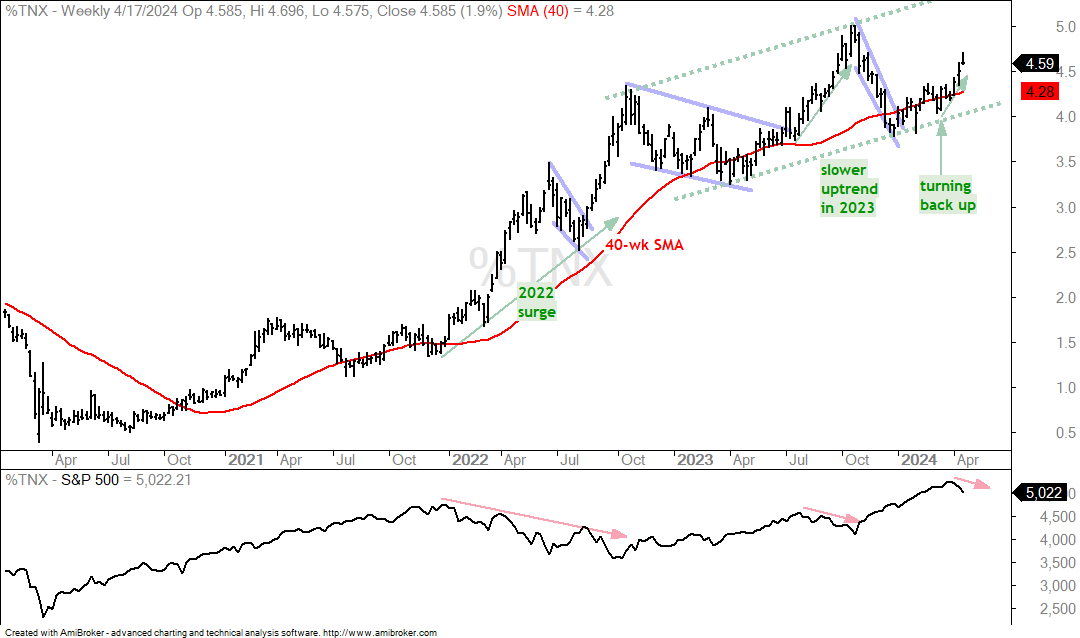
The 10-yr Treasury Yield moved from 4.10% to 4.58% in 27 days
$VIX moved above 15 the last 3 weeks (was below since early Nov)
SPY and $VIX both declined the last two days (unusual activity)
CBM Weakens as 4wk Lows Expand
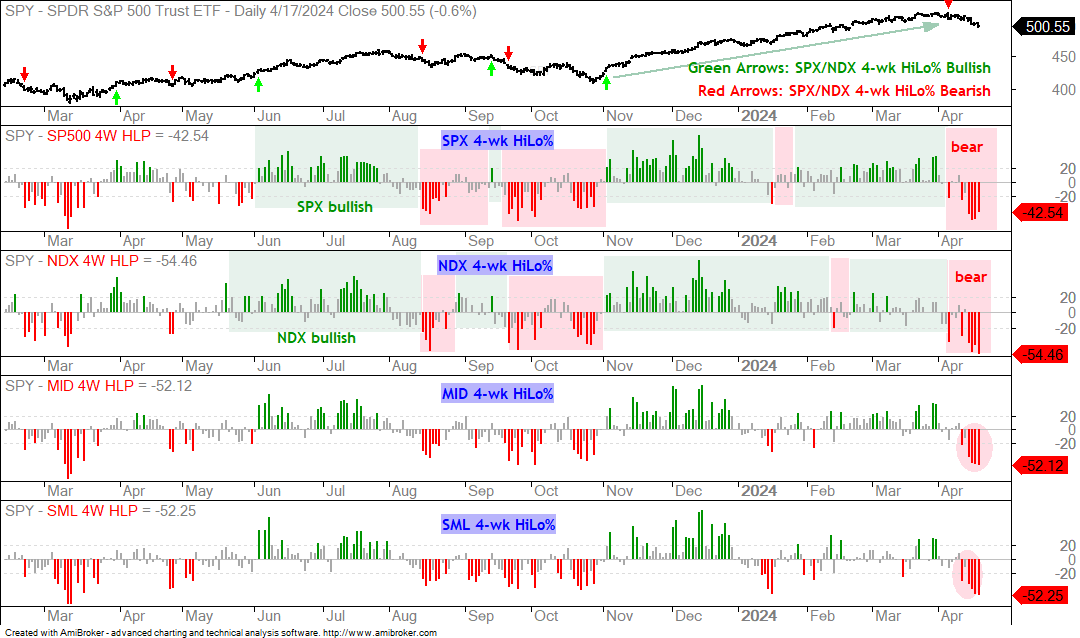
Selling pressure was intense here in April. As noted above, the S&P 500 and S&P 1500 Thrust Models turned negative (see chart above) SPY and QQQ broke their ATR-SAR lines for outsized declines. The 4-wk High-Low Percent combo turned bearish on April 4th and 4-wk lows expanded the last four trading days (see chart below). Elsewhere, the 10-yr Treasury Yield is rising and small-caps are seriously lagging.
Despite all these negatives, the S&P 500 and S&P 1500 Trend Models remain bullish. SPY and QQQ are comfortably above their rising 200-day SMAs and both recorded new all time highs in late March. The long-term trends are clearly up and the longer term weight of the evidence remains bullish. This means the April declines are pullbacks within a bigger uptrend. One pullback will overstay its welcome and lead to a bigger trend change. That, however, has yet to occur and we can cross that bridge when it gets here.
Long-term Chart for SPY
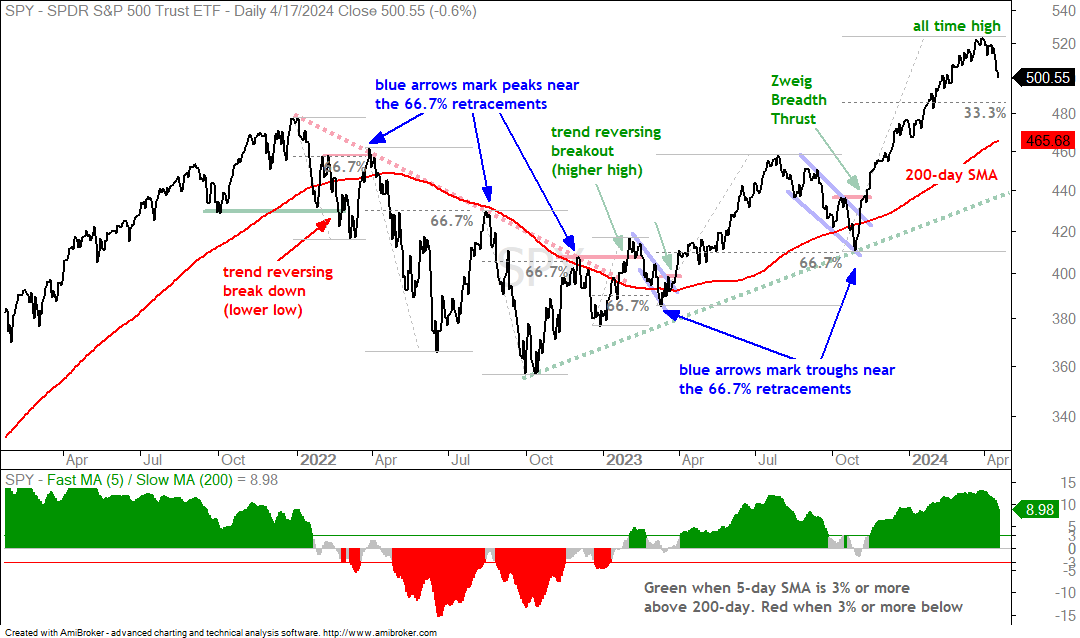
The chart below shows SPY with the 200-day SMA and the 5/200 differential in the indicator window. Using this cross and some basic breakout analysis, we can see a major breakdown in late February 2022 and a major breakout in early February 2023. SPY clearly broke support in February 2022 and the 5-day SMA was more than 3% below the 200-day SMA (red). SPY clearly broke resistance in February 2023 and the 5-day SMA was more than 3% above the 200-day SMA (green). There were pullbacks in March-April and August-October 2023.
SPY fell 4.3% in April. With the long-term trend up, this decline is considered a correction within the bigger uptrend. The $1 million questions: how long will it last and how far will it extend? Answer: Nobody really knows. We are all making educated guesses. The last two pullbacks retraced around 2/3 (66.7%) of the prior advance and returned to the 200-day (even broke it). It would feel like Armageddon should SPY do the same now and fall below the 200-day (kind of like late October).
SPY is Short-term Oversold
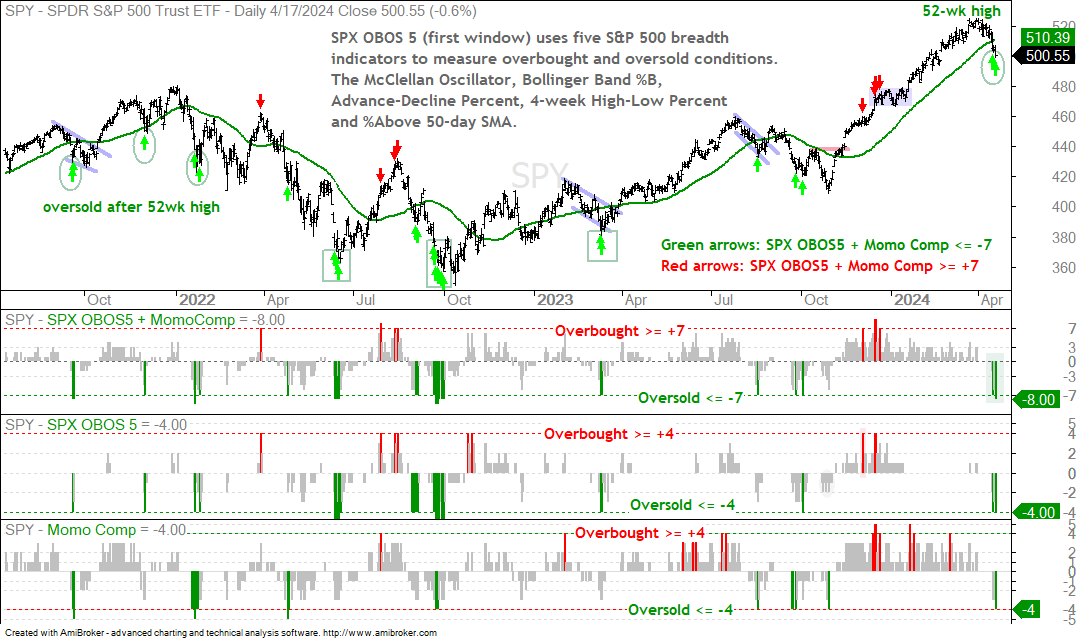
The next chart shows SPY with three indicators. The bottom window shows the Momentum Composite, which aggregates overbought and oversold signals in five momentum indicators (Bollinger Bands, RSI, Stochastics, CCI and ROC-ATR). The middle indicator aggregates overbought and oversold signals in five S&P 500 breadth indicators (McClellan Oscillator, %B, AD%, 4wk High-Low Percent, %Above 50-day SMA). The top window shows the combine score for both. This combo indicator ranges from +10 to -10. I consider it overbought when at +7 or higher and oversold when at -7 or lower. The red arrows on the chart below mark overbought and oversold setups.
Now is the tricky part! When does a setup turn into a signal? Many oversold bounces are short and do not last long. A few lead to breakouts and meaningful advances (June 2022, September 2022, March 2023). These setups and signals are marked with the green boxes. The green ovals show oversold conditions after a 52-week high, which is what we have now. On the far left, a falling wedge accompanied the oversold condition in September 2021 and the wedge breakout provided a good signal. There were oversold conditions in November 2021 and January 2022, but the subsequent bounces were short-lived. SPY is currently oversold with the indicator at -8. This argues for a bounce, perhaps back above the 50-day SMA.
No Pattern and No Divergence Yet
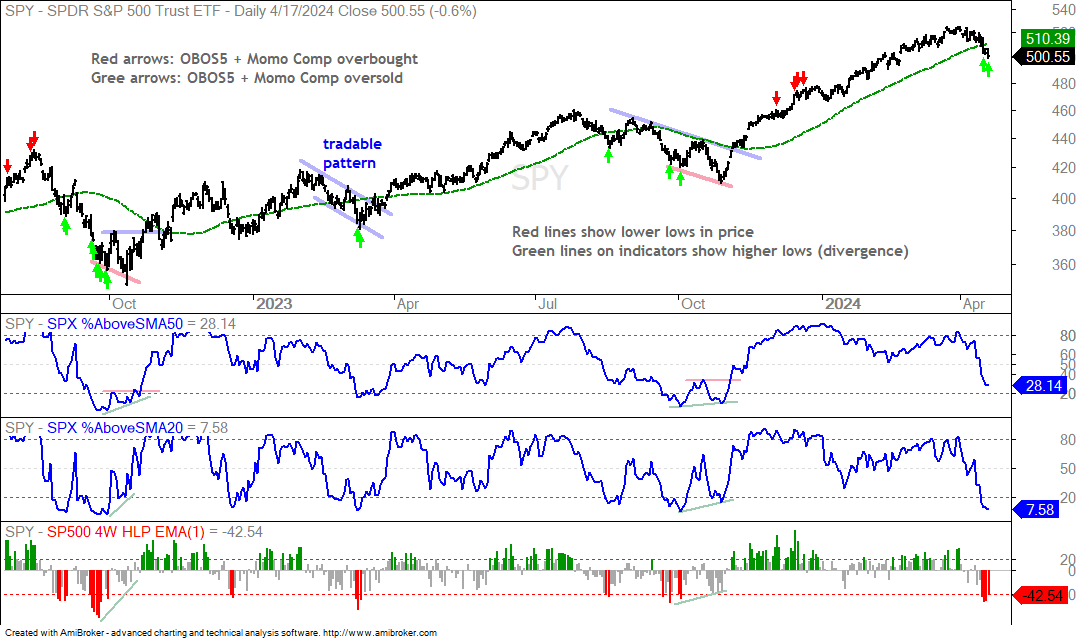
There are two things I do not like here. First, we do not have a tradable pattern, such as a falling wedge, flag or triangle. Patterns provide resistance levels that we can use to identify breakouts. SPY formed a tradable pattern in Feb-Mar 2023 and the breakout led to a big move (see chart below). Second, the short-term breadth indicators have not had time to form divergences. The April decline was sharp and pushed %Above 50-day below 30%, %above 20 below 10% and 4wk High-Low Percent below -40%. All three moves reflect broad and strong selling pressure. These indicators need to stabilize and show less selling pressure before considering an end to the correction.
A divergence forms when SPY forges a lower low and the breadth indicators form higher lows. The red lines on the price chart show lower lows in Sep-Oct 2022 and Sep-Oct 2023. Now take a look at the indicators when SPY forged these lower lows. %Above 50-day and %Above 20-day were below 20% when the first low formed. 4wk High-Low Percent was below -40% (red). SPY bounced and then forged a lower low. Meanwhile, the indicators formed higher lows (green lines). The differences are subtle, but tewer stocks moved below their 50 and 20 day SMAs when the lower lows formed. Also notice that fewer stocks forged 4wk lows. These bullish divergences suggested that the decline was ending because fewer stocks were participating on the downside. I will be watching for either a tradable pattern or a bullish breadth divergence in the coming weeks.
SPY Remains Derailed and QQQ Gets Derailed
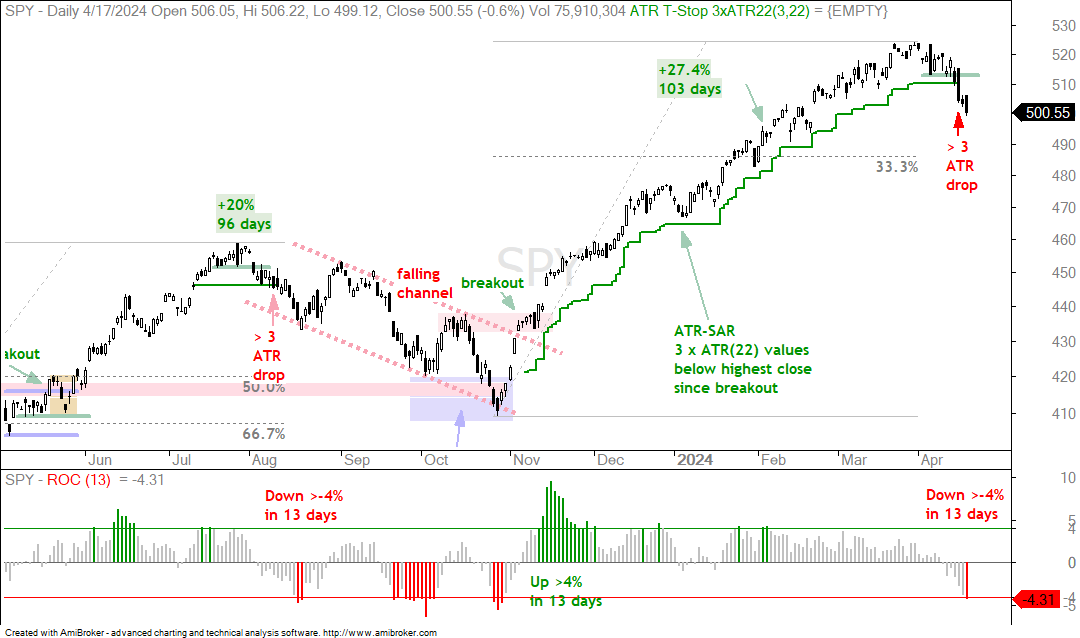
Correction and downtrends can start with an outsized decline, just as uptrends can start with an outsized advance. An outsized decline in mid August signaled the start of a corrective period that lasted into October. An outsized advance in early November signaled the start of a big advance into March. We now have an outsize decline in April signaling the start of a corrective period. This decline was more than 3 ATR(22) values from the high and more than 4% in 13 days (since SPY peaked). The Rate-of-Change indicator also shows a 4+ percent decline in mid August. SPY is short-term oversold after this sharp decline and could get a short bounce. Overall, I remain in the correction camp and will mark my first target in the 480-485 area. The 33% retracement marks this zone.
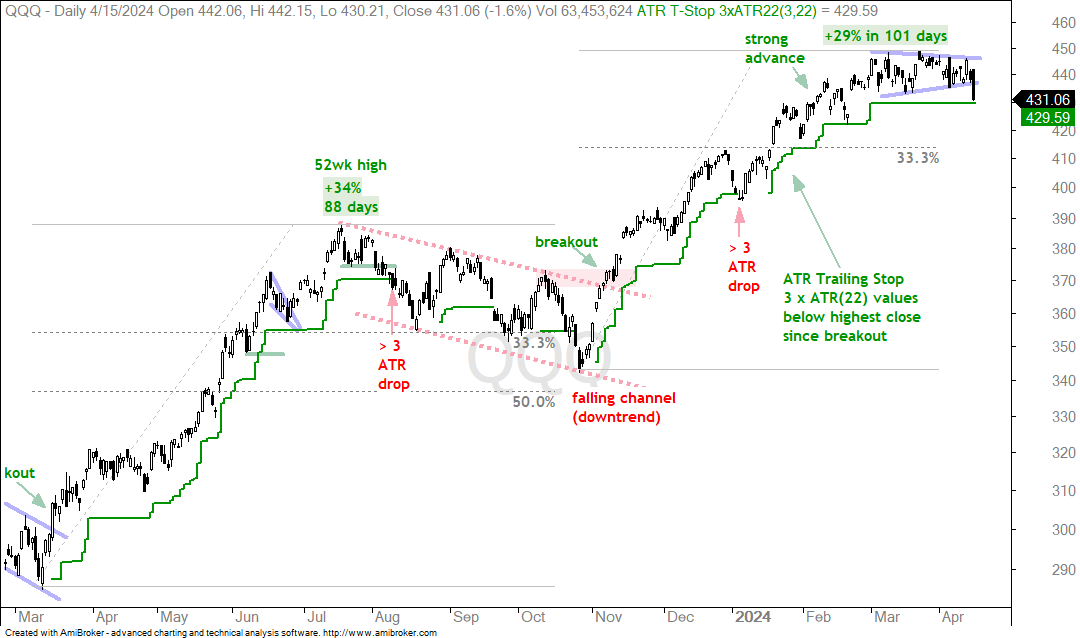
The next chart shows QQQ breaking the ATR-SAR line with a sharp decline on Wednesday. This signals an outsized decline and puts QQQ in correction mode as well. QQQ is down 4.6% since its peak, 17 days ago. Again, this is the sharpest decline since October. An outsized decline occurred in mid August and this foreshadowed weakness into October. As far as targets, the 33% retracement is in the 410 area.
Chart Analysis, Setups and Trading Ideas
There are no setups right now because the stock market is in corrective mode and the correction has yet to run its course.