The next Chart Trader will be posted on Thursday morning, April 18th.
Correlations Rise during Downturns
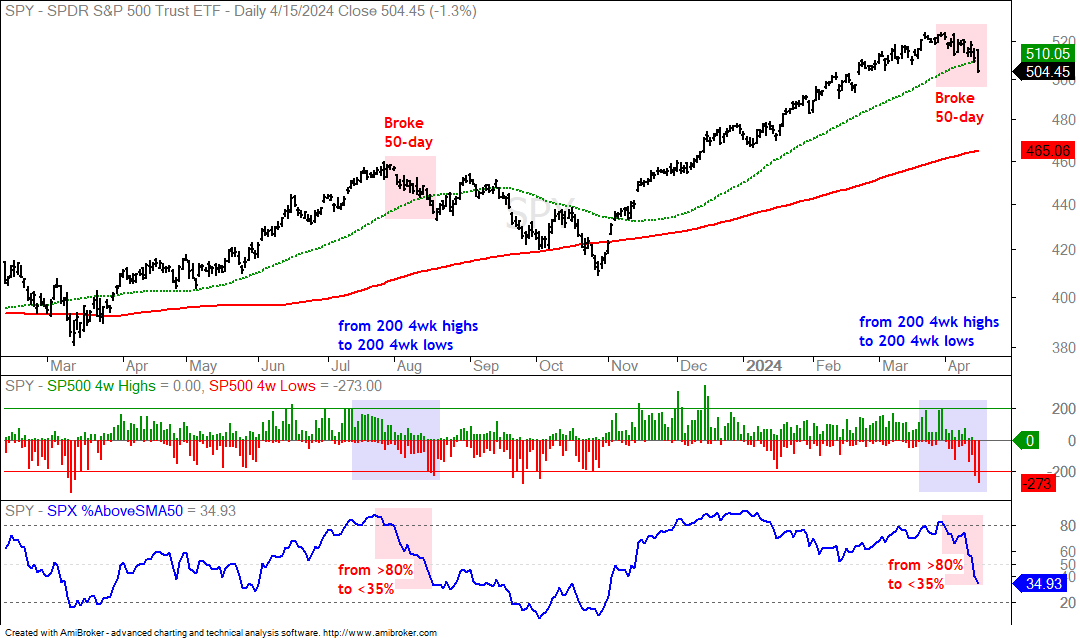
SPY fell 3.6% so far in April and is below its 50-day SMA for the first time since October. This looks like the start of a pullback because downside participation expanded significantly, just as it did in mid August. Some 83% of S&P 500 stocks were above their 50-day SMA at the end of March. This number plunged to 35% on Monday (red shadings). 194 S&P 500 stocks hit 4 week highs at the end of March and we now see 273 hitting 4 week lows in mid April (blue shadings). This is the highest number of 4 week lows since September 2023. Broadening participation to the downside is another way to say correlations are rising. This means there were few places to hide and this makes it hard to make money during corrections.
Rough Times for Average Stocks
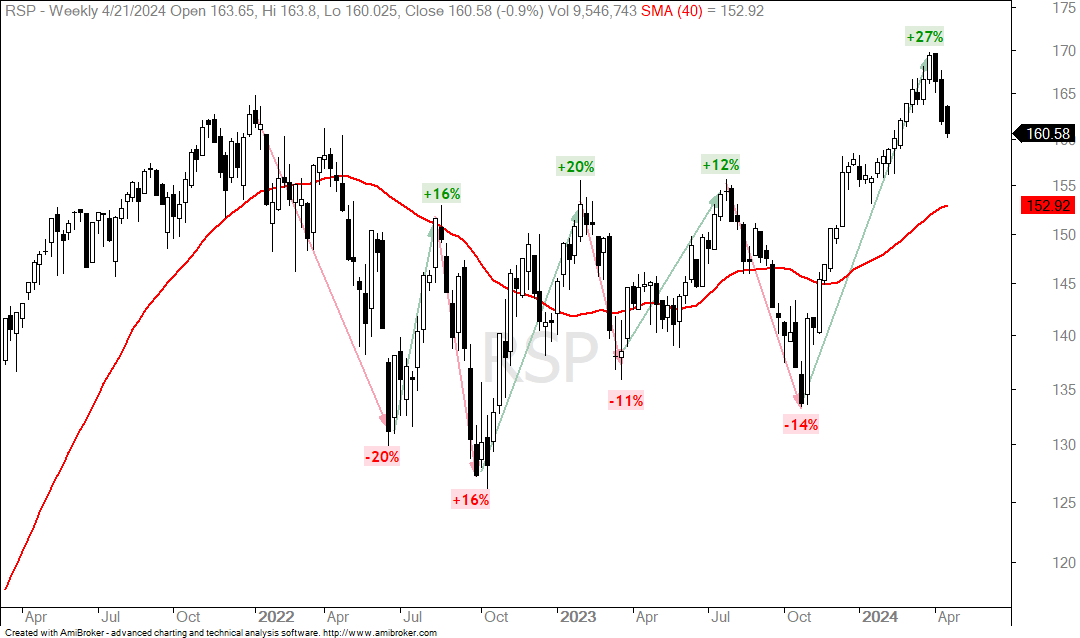
At this point, I still consider this a correction within a bigger bullish environment. SPY and QQQ fell from all time highs and were up substantially since late October. They are entitled to a corrective period. It is a different story for the S&P 500 EW ETF (RSP) and Russell 2000 ETF (IWM). Small-caps are chronic underperformers and IWM is some 25% below its 2021 high. IWM is also below its 2023 highs after Monday’s decline. RSP hit a new high in March and then fell over 5% from this high. RSP is now back below the 2021 high. It has been tough to make money outside of large-caps since 2022. The chart below shows RSP with eight double digit swings since 2022. The last swing was up (+27%), but the current swing is down and could have further to run.
Bull Market Sequence
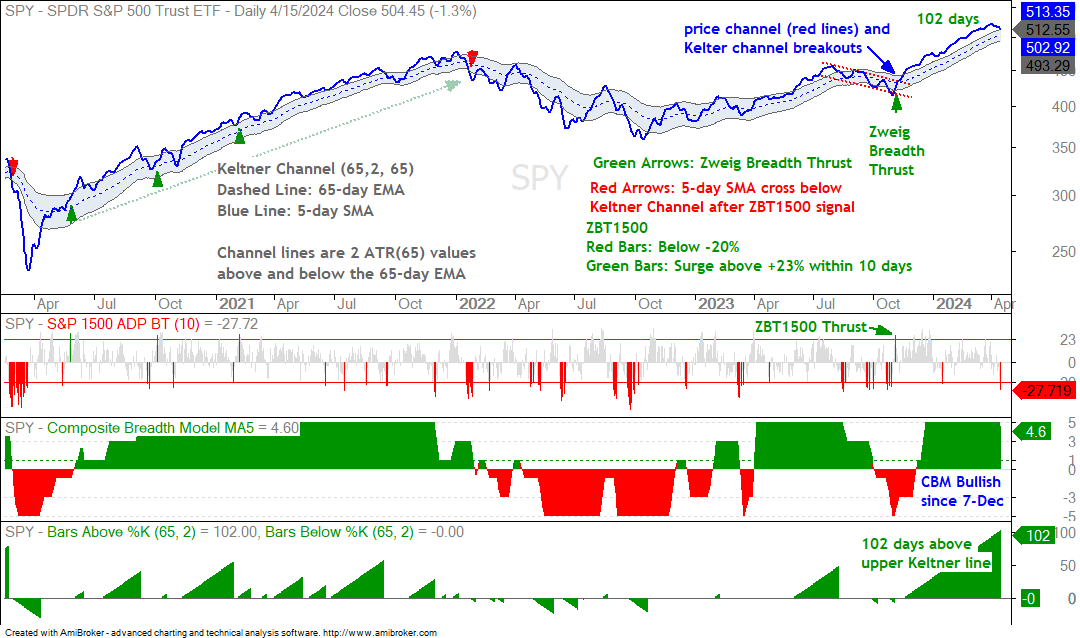
The long-term the evidence remains bullish for stocks. The chart below shows the bullish sequence starting with the Zweig Breadth Thrust on November 3rd. See the ZBT1500 Thrust in the middle window. The green arrows on the price chart mark ZBT1500 breadth thrusts over the last three years. SPY broke out of its falling channel (red lines) a week after the ZBT Breadth Thrust and also moved above the upper Keltner Channel for a volatility breakout (blue arrow). The Composite Breadth Model (bottom window), which has 14 breadth indicators, then turned bullish on December 7th with a move to +1. The weight of the evidence remains bullish, but there can still be corrections and pullbacks along the way.
The bottom window shows the number of days above the upper Keltner line. Note that the 5-day has been above the upper Keltner line for 102 days. This is tied for the second longest streak in 30 years. We saw 102 days in February 2018 and 188 days in October 1995. This streak is testament to the strength of the advance off the late October lows. All good streaks must end, but this is not enough to derail the bull market. A move into the Keltner channel would be considered as a correction.
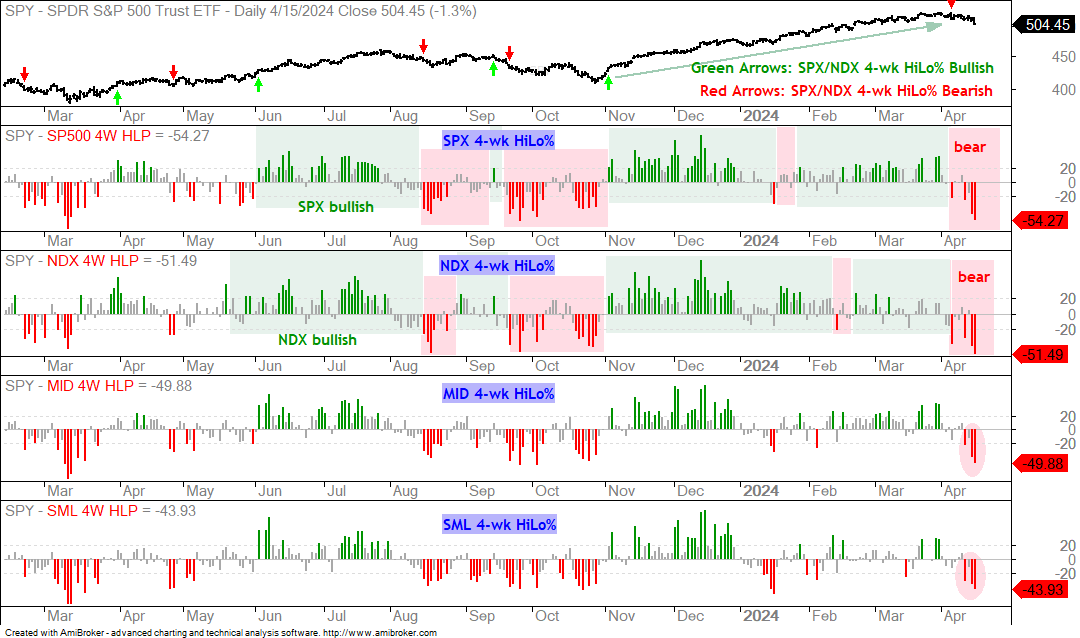
The next chart shows the 4-wk High-Low Percent indicators for the S&P 500, Nasdaq 100, S&P MidCap 400 and S&P SmallCap 600. I am only focused on the S&P 500 and Nasdaq 100 for signals (see explanation below the chart). 4wk High-Low Percent dipped below -20% for NDX and SPX on Thursday, April 4th. This turned the indicator combo bearish (red shadings and red arrow on price chart). Selling pressure intensified on Friday as these indicators exceeded -40% and again on Monday as they exceeded -50%. Downside participation is expanding and this is negative.
About the Indicators: 4-wk High-Low Percent is the percentage of 4-week highs less the percentage of 4-wk lows within an index. These indicators turn bullish with a move above +20% (green bars) and bearish with a move below -20% (red bars). I am only focused on the S&P 500 and Nasdaq 100 for signals. The green shading on the chart above shows the active bullish signals for the S&P 500 and Nasdaq 100. The red shading shows the active bearish signals. The green arrows on the price chart show when 4-week High-Low Percent is bullish for both the S&P 500 and Nasdaq 100. This means BOTH must be bullish to signal a short-term uptrend in SPY. A downtrend signal triggers when BOTH are bearish.
SPY Forges an Outsized Decline - QQQ Holds Up
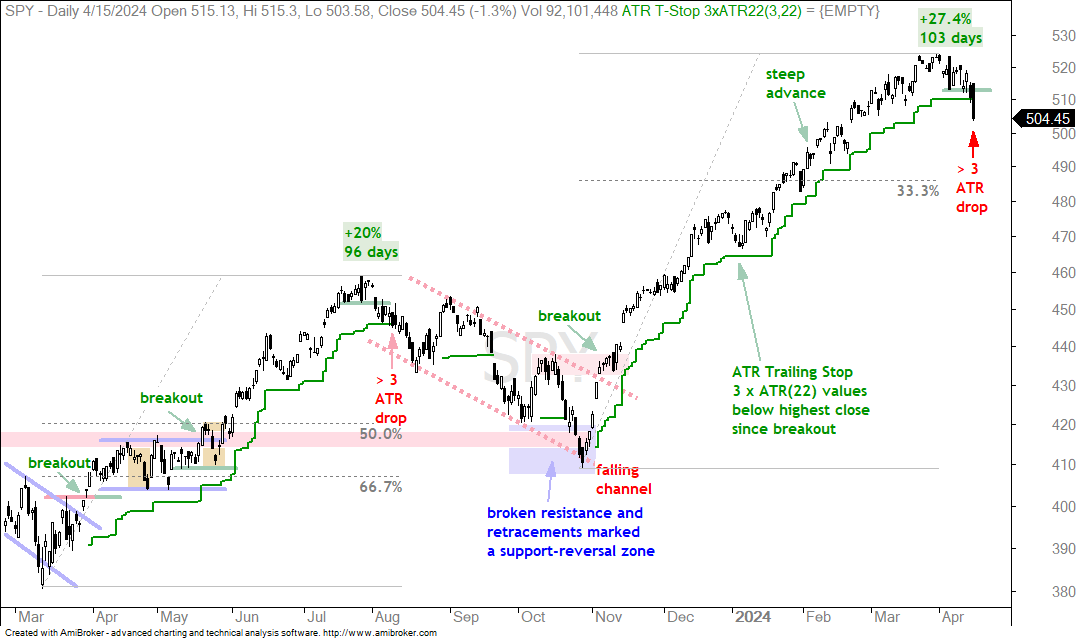
Before analyzing the recent reversal in SPY, it is important to put this decline into perspective. SPY hit new highs in March and is still within 4% of these highs. The long-term trend is still up and we are still in a bull market. Stocks became quite extended as SPY advanced 27.4% in 103 days (late October lows to March highs). The ETF was ripe for a corrective period. Thus, the immediate trend is down, but this downtrend is still considered a correction within a bigger uptrend.
The chart below shows SPY breaking the ATR Trailing Stop (3xATR(22)) with a sharp decline in April. This line held since early November, which means the recent decline is the largest since October. In other words, it is an outsized decline that derailed the uptrend. There was a similar outsized decline in mid August and this derailed the uptrend off the March 2023 low.
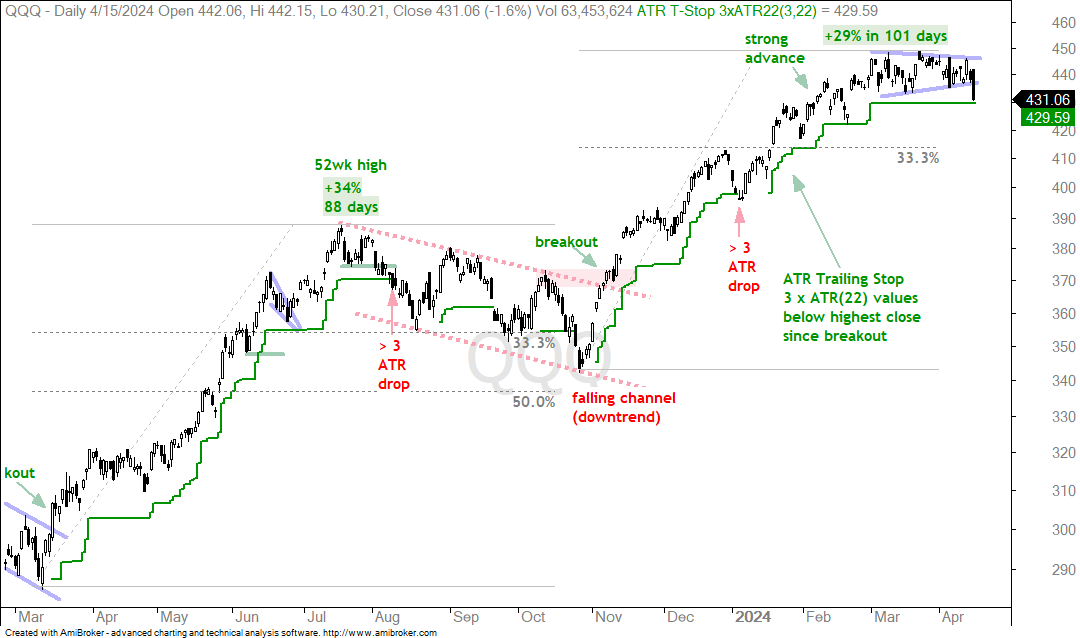
The next chart shows QQQ falling 1.6% on Monday, but stopping short of an outsized decline. The green line marks the ATR Trailing Stop (3xATR(22)) and QQQ closed just above this level. Thus, QQQ has yet to officially reverse its uptrend. This also means that QQQ is holding up better than SPY. I would not expect QQQ to buck SPY and the broader market though. As such, QQQ is likely to break the ATR Trailing Stop and reverse the immediate uptrend.
The weight of the short-term evidence is bearish. Even though QQQ has yet to trigger an outsized decline, SPY did and the 4wk High-Low Percent combo is bearish. The Composite Breadth Model is positive, which means we are still in a bull market environment. Overall, we have a short-term bearish environment within a longer-term bullish environment. As such, the call is for a corrective period in the weeks ahead.
Chart Analysis, Setups and Trading Ideas
SPY and QQQ Targets
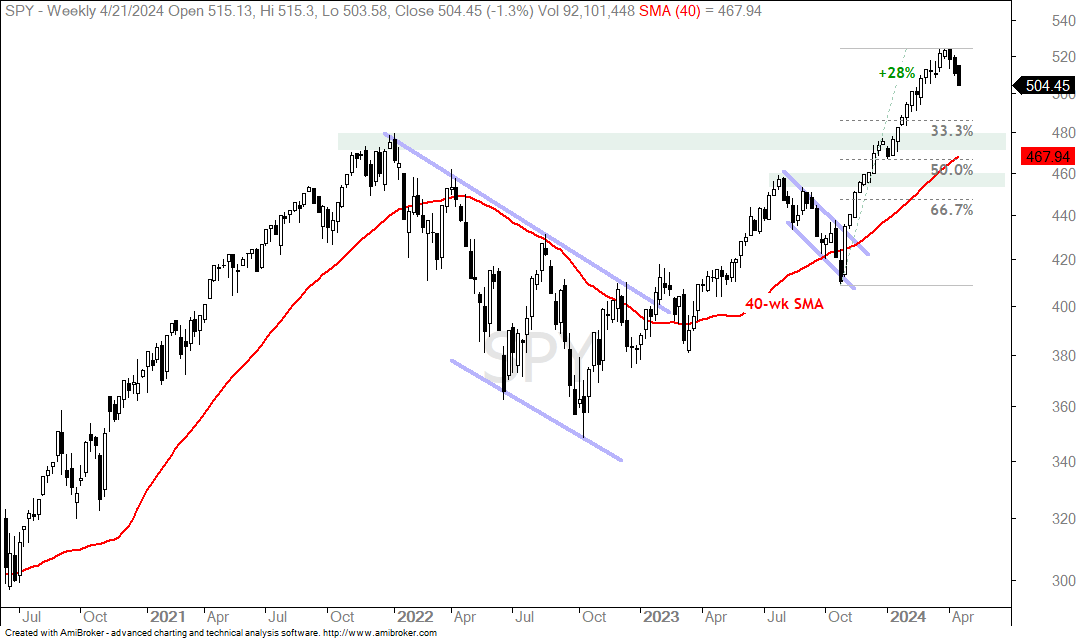
Downside targets are tricky because corrections can take many forms. We can see sharp pullbacks, zigzag declines or sideways consolidations. Basically, the correction will end when it ends. Until then we can use broken resistance levels to mark future support and retracements to mark possible reversal zones. Chartists can also use the 40-week SMA. The chart below shows SPY with broken resistance levels extending to possible support in the 480 and 460 areas. We can also see the 33, 50 and 67 percent retracements. The rising 40-week SMA is currently around 468, but will likely continue to rise for a few more weeks. Overall, my base case correction target would be the 480 area for SPY. This would be an 8% decline from the March high. An 8% correction after a 28% advance is still fairly modest.
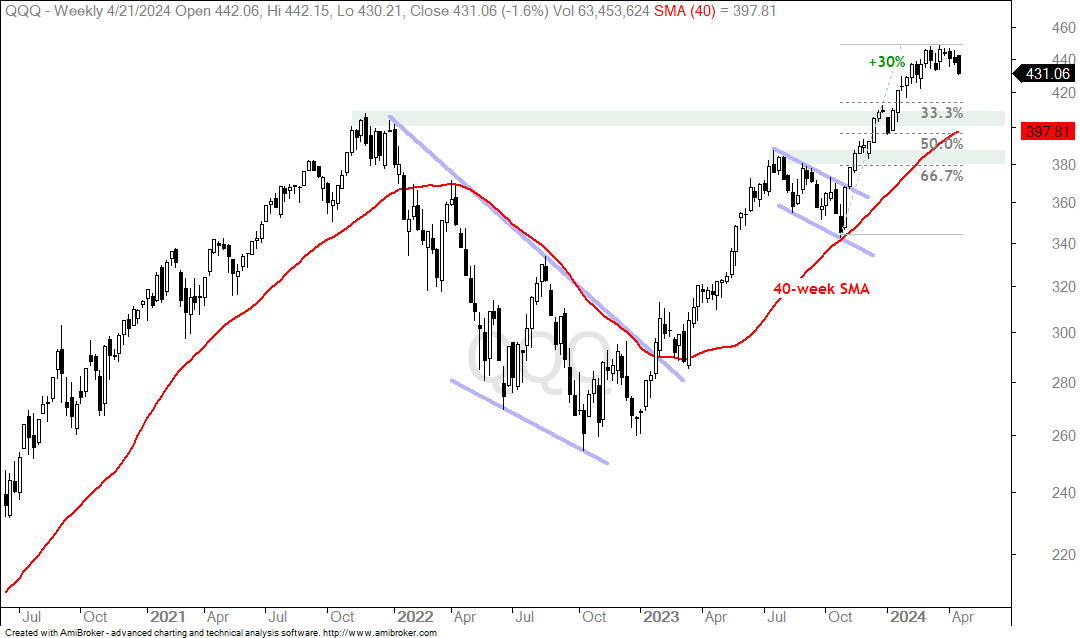
Applying similar logic to QQQ, the correction target would be in the 400-410 area. A decline to 410 would require an 8% decline from the March high. This is also fairly modest considering the 30% advance.
10-yr Treasury Yield Turns Up
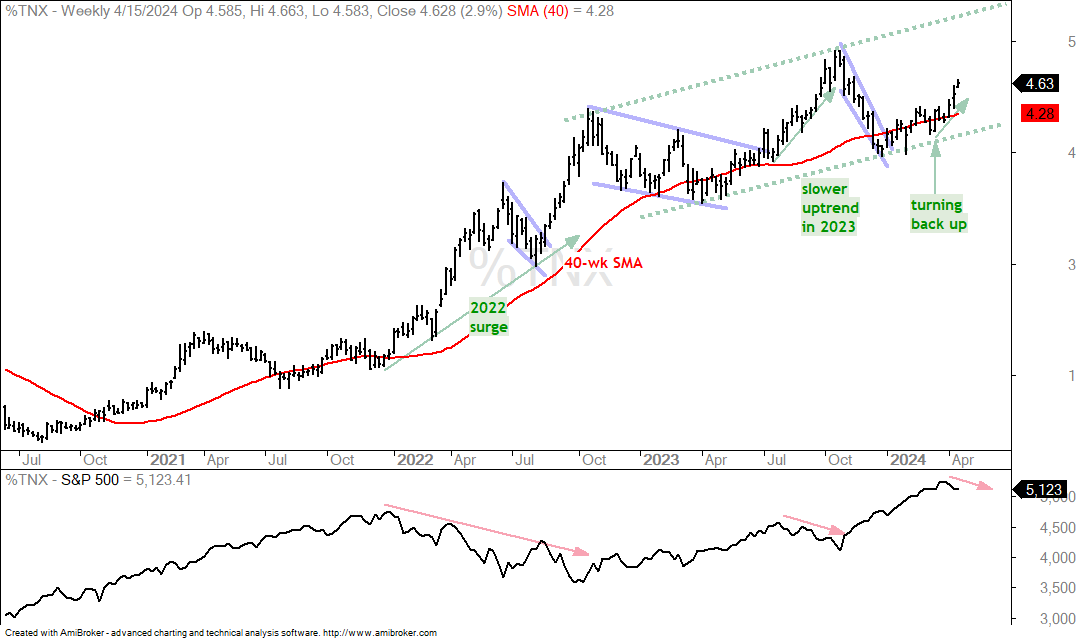
Rising rates are weighing on stocks, again. The next chart shows the 10-yr Treasury Yield turning up within a larger uptrend. First, note the green arrows on the main chart. These show when the 10-yr Treasury Yield turned up. The 2022 surge coincided with a decline in the S&P 500 (red arrow in lower window). $TNX surged from July to October 2023 and stocks fell. $TNX is once again turning up with a sharp move the last six weeks and stocks are starting to feel the heat. Overall, the 10-yr Treasury Yield is advancing within a rising channel and the upside target is above 5%. Both the direction and the speed of the move affect stocks. A slow rise could be tolerable, but a rapid rise in rates would be negative for stocks. This further supports the call for a correction in stocks.
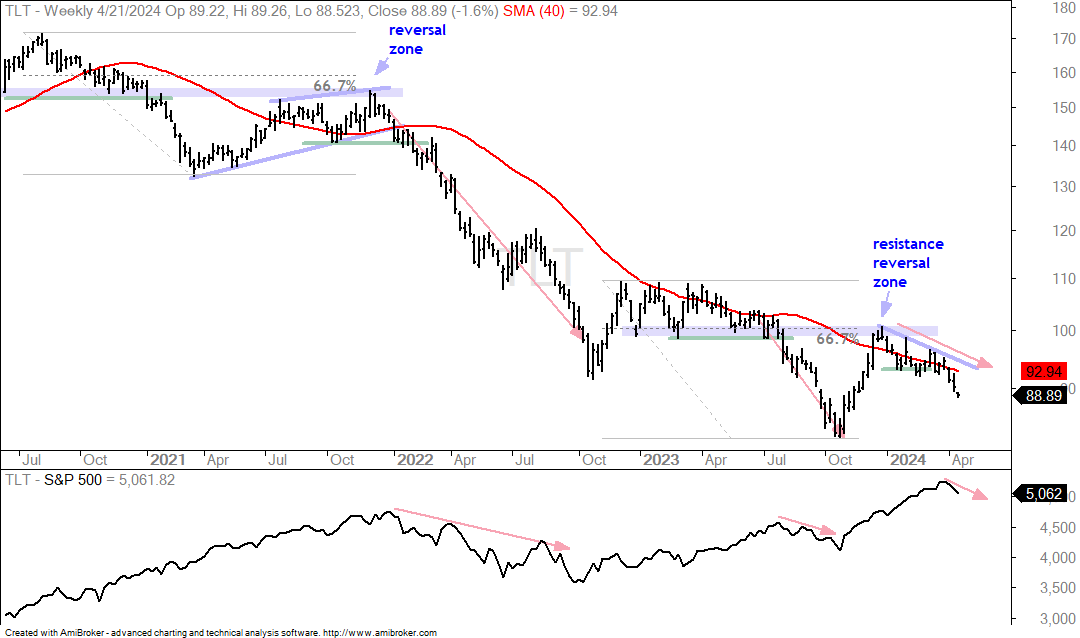
The next chart shows the 20+ Yr Treasury Bond ETF (TLT), which moves opposite the 10-yr Treasury Yield. TLT and SPY have been moving in the same direction since 2022 (positive correlation). Both fell from January to October 2022 and from July to October 2023 (red arrow). TLT fell in 2024 and this decline accelerated the last 3-6 weeks.
An Outsized Decline for the Semiconductor ETF
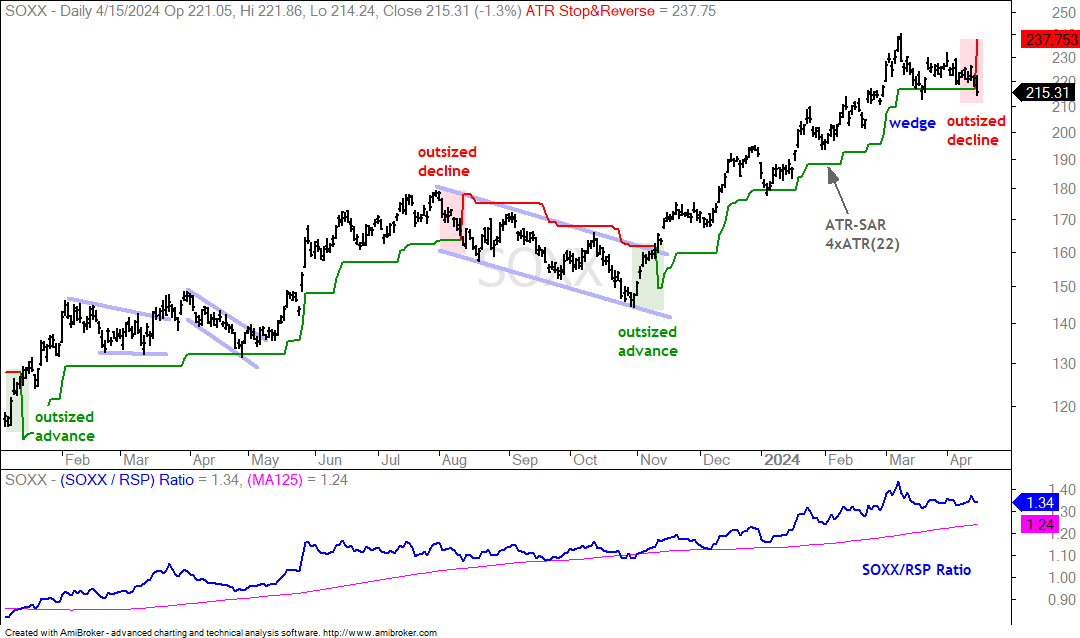
Last week Thursday[8], I showed the upturn in the 10-yr Treasury Yield as well as the outsized declines in the Retail SPDR (XRT) and Home Construction ETF (ITB). These two broke the ATR-SAR Line (4 x ATR(22)). I also showed charting options for ATR-SAR in this report[8] (StockCharts and TradingView). The Semiconductor ETF (SOXX) was holding out, but succumbed to selling pressure on Monday and broke the ATR-SAR line on Monday. This reverses the uptrend that started with an outsized advance in early November (green shading). Also notice that the correction from August to October 2023 started with an outsized decline in mid August.