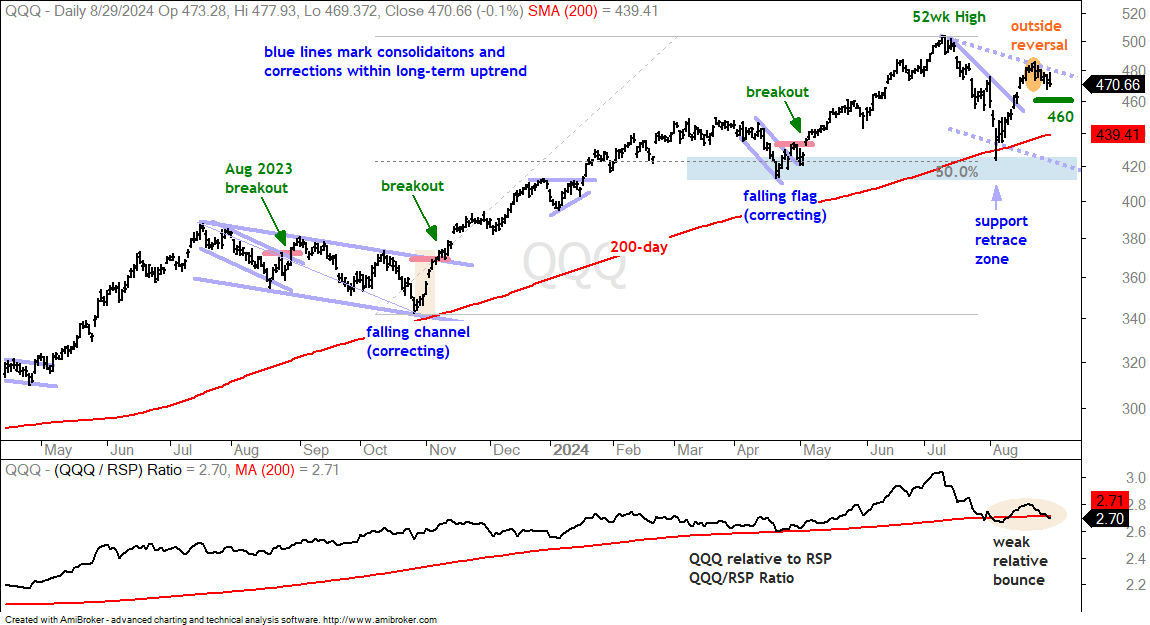
QQQ Forms Lower High as Relative Performance Wanes
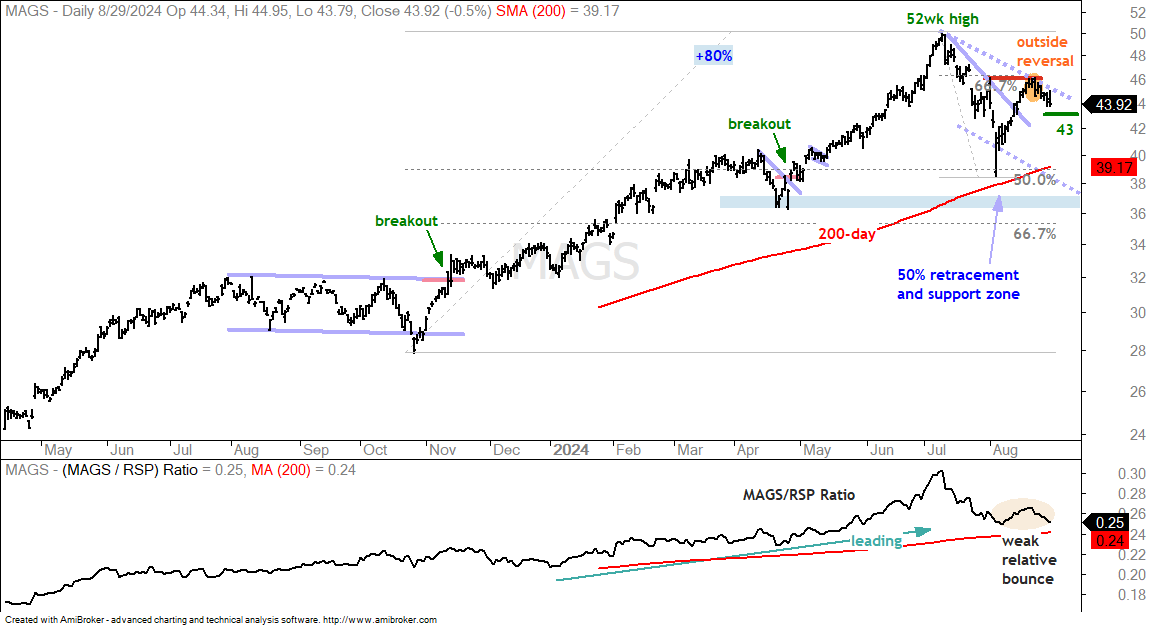
MAGS Forms Outside Reversal at Key Retracement
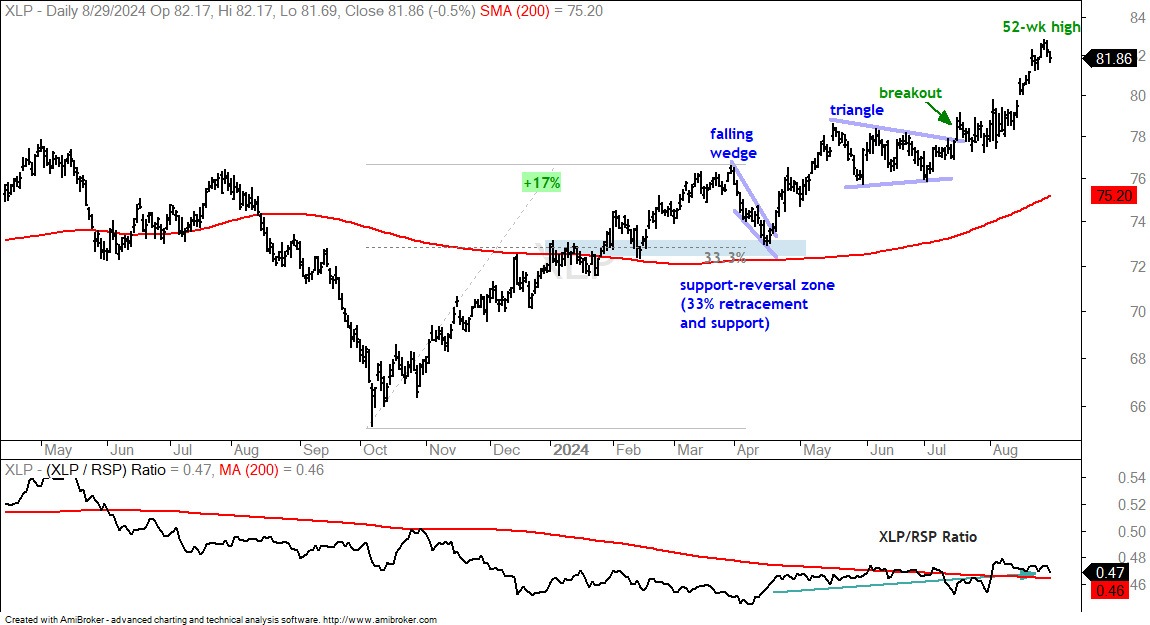
Defensive Sectors Lead with New Highs (XLU, XLP, XLV)
BAA Yield less AAA Yield
Yield Spreads Fall back as Stress Subsides
Semiconductor ETF Falls after Outside Reversal
Cybersecurity ETF Challenges February High
Software ETF Bounces within Long Consolidation
FinTech ETF Breaks July High
Leading ETFs: XLRE, ITB, ITA, KIE, IBB, FAN, PBJ
Palo Alto, CyberArk, Jack Henry and Paypal Break Out
20+ Yr Treasury Bond ETF Remains in an Uptrend
Gold SPDR Maintains Breakout
Bitcoin Bounces within Downtrend
The next Weekly Report will be posted on Friday morning, September 6th.
Programming Note - Moving to Fridays
Instead of producing two reports on Tuesdays and Thursday, I would like to combine the analysis and move to one report on Fridays. This will give the report move shelf life and give subscribers more time to access the analysis (Friday, Saturday, Sunday).
There will be two reports on Friday. First, there will be a broad market report that includes the breadth models and yield spreads. Second, there will be a report focusing on the big three (SPY,QQQ,MAGS), select ETFs and stocks, the Gold SPDR, the 20+ Yr Treasury Bond ETF and Bitcoin.
The weight of the evidence remains bullish for stocks. The breadth models are bullish, the major index ETFs are above their rising 200-day SMAs, the S&P 500 EW ETF (RSP) hit a new high this week and seven of the eleven of the eleven sector SPDRs hit new highs. It is hard to be bearish when seeing broad strength, but the recent market mood swing is cause for concern as we head into September.
Composite Breadth Model is Bullish
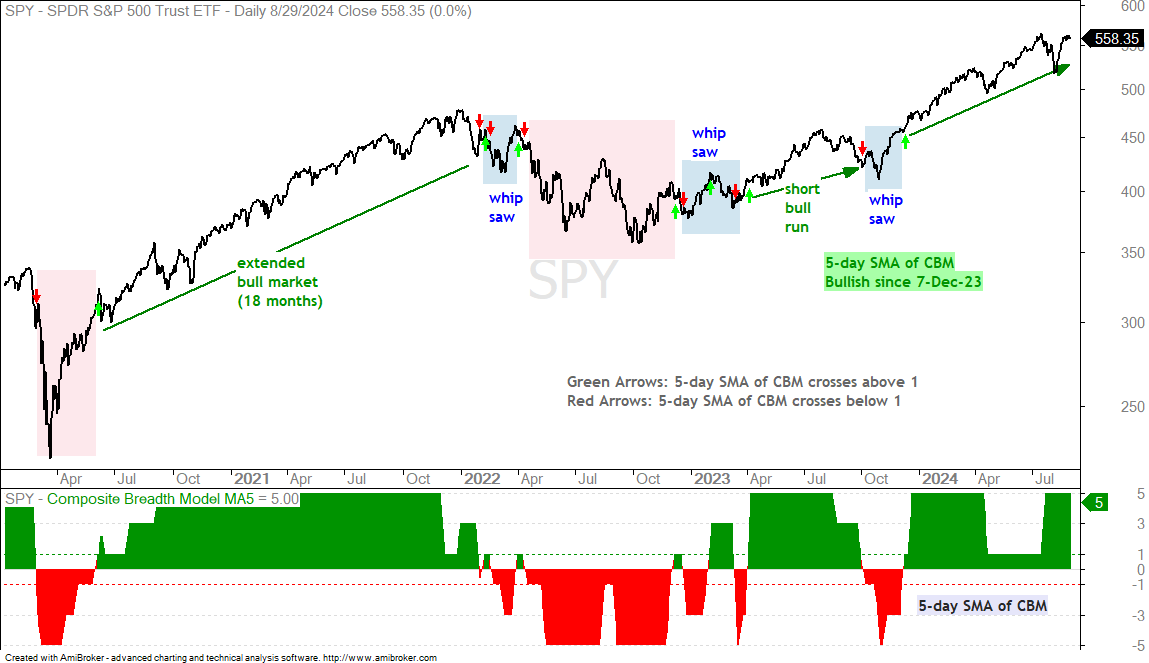
The chart below shows the Composite Breadth Model at +5 and firmly positive. This model turned bullish on December 7th and remains bullish. A positive CMB signals a favorable environment for stocks (bull market). Even with a bullish CBM, we can still see pullbacks, corrections, rotations and trading ranges.
The Composite Breadth Model aggregates signals in over a dozen breadth indicator from the S&P 500 and S&P 1500. This means it covers large-caps, mid-caps, small-caps, NYSE stocks and Nasdaq stocks. It ranges from +5 to -5. A bull market is present when positive and a bear market when negative.
Market Mood Swings
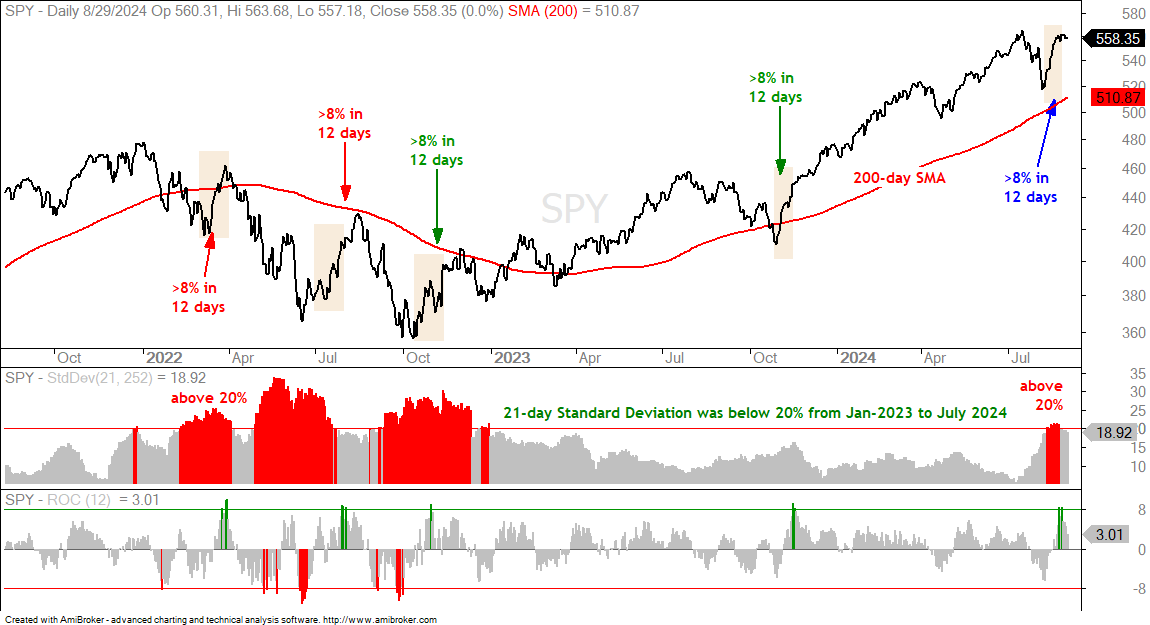
Even though we are still in a bull market, we have seen a change in the market mood over the last two months. Techs and high beta names were leading in July. Mr Market showed a healthy appetite for risk then. The mood changed after the plunge into early August and a ripping rally into late August. Volatility picked up as the 21-day Standard Deviation hit its highest level in over a year and techs started lagging. Note that I am charting the Standard Deviation of log returns, which differs from the Standard Deviation of closing prices.
Tech stocks and tech-related ETFs recovered in August, but most are still well below their July highs. This is especially true for QQQ, Technology SPDR (XLK), Semis (SOXX) and the Mag7 (MAGS). A mood swing is not the end of the world, but suggests some risk aversion in the stock market. At the very least, money is rotating into other areas as industrials, finance, healthcare and communications services pick up the slack. Note that Cybersecurity (CIBR) and Fintech (FINX) are the strongest of the tech-related ETFs.
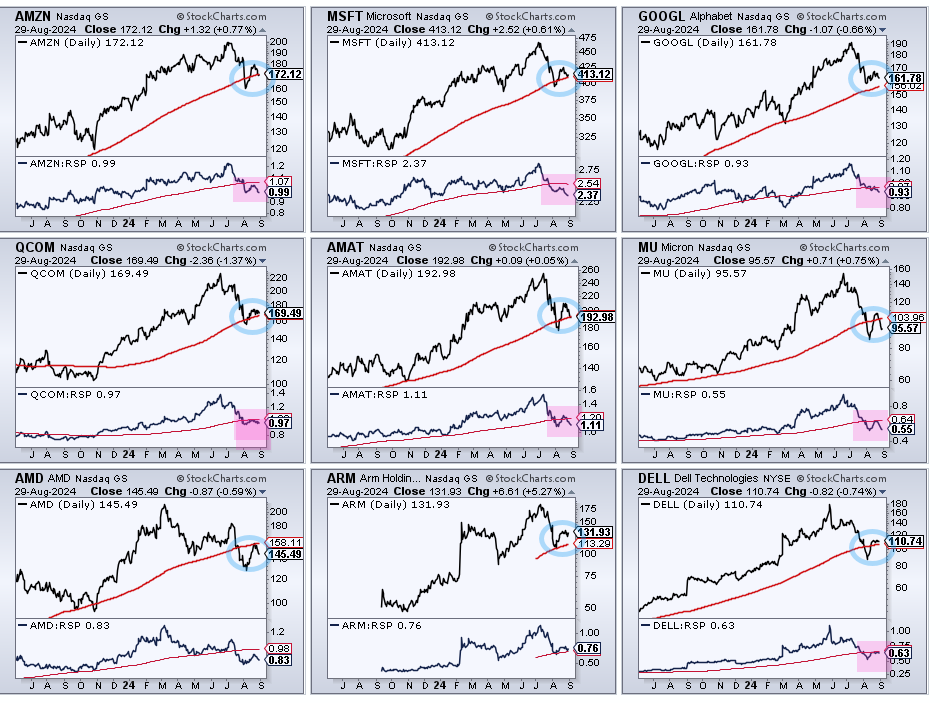
The chart below shows nine tech stocks: three from the MAG7 are at the top (AMZN, MSFT, GOOGL) and the next five come from the Semiconductor group (QCOM, AMAT, MU, AMD, ARM). The last is Dell Technologies, which is big in data centers. As the blue circles show, these stocks are very close to their 200-day SMAs (red lines) and a battle royale is building.
Each chart shows relative performance in the lower window, which is the stock price divided by the S&P 500 EW ETF (RSP). This ratio is below the 200-day SMA for eight of the nine. They are underperforming the broader market. The ARM:RSP ratio is barely above its 200-day SMA. These key tech stocks were leading in July, but they are largely underperforming right now. This reflects the change in market mood over the last two months.
Volatility Ticks Up as SPY Hits July High
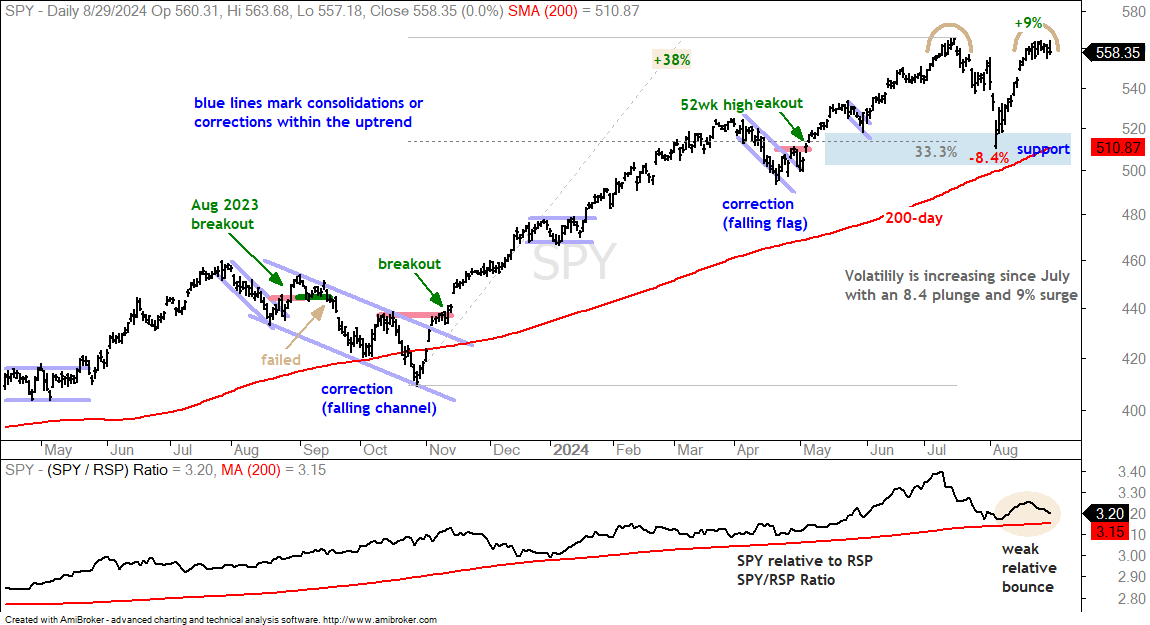
The S&P 500 SPDR (SPY) is in a long-term uptrend. SPY is well above its rising 200-day SMA and its July high, which is a 52-week high. Short-term, SPY stalled just below the July high. A double top is possible, but premature because this pattern is far from unconfirmed. At the very least, we need to see a sharp move lower from current levels to argue for a second peak here. Further weakness below the early August low would confirm the double top and target a move to the 460 area. Thus, let’s not talk of a double top just yet. Note that there is a lot of support in the 500-520 area. Here we have the rising 200-day SMA, the August low and the 33% retracement line.
Even though SPY is near a new high, there are two reasons for concern on this chart. First, volatility increased since July as SPY fell 8.4% in three weeks (July 16th to August 5th) and then surged 9% the next three weeks (closing basis). A sharp rebound after a sharp decline is positive, but the size of the swings shows a sharp increase in volatility. Stocks prefer low volatility environments. Second, SPY surged back to its July high, but the SPY/RSP ratio barely budged. This ratio hit a new high in July as SPY led the market higher. The SPY/RSP ratio has also been above its 200-day SMA since March 2023. The weak August bounce shows large-caps struggling and this is a negative because the S&P 500 is the 800 pound gorilla in the market.
QQQ and MAGS Extend on Breakouts
Before looking at QQQ and some tech-related ETFs, note that I showed short-term breakouts last week and marked re-evaluation levels. These breakouts are holding as stocks largely consolidated or edged lower the past week. Many tech-related ETFs formed outside reversals on August 22nd and are underperforming in August. As such, I am raising the re-evaluation levels, which are shown as green lines with a price level. The dashed blue lines covering July-August mark a potential correction trajectory should these ETFs and stocks break their re-evaluation levels.
The next chart shows QQQ within a long-term uptrend. The ETF is above its rising 200-day SMA and it hit a 52-week high in July. Even so, QQQ is starting to drag its feet. The S&P 500 EW ETF hit a new high this week and SPY is trading near its July high. QQQ, on the other hand, did not come close to its July high and fell 2.4% the last six days. Also notice the key outside reversal day on August 22nd (yellow shading). This pattern forms when the open is above the prior high and the close is below the prior low. QQQ fell 1.6% with this short-term reversal pattern on August 22nd. Overall, a lower high could form and we could see a test of the support zone in the 410-420 area.
The indicator window shows the QQQ/RSP ratio hitting a new high in July and falling to the 200-day SMA in late July. The ratio bounced in August, but this relative bounce was weak as QQQ underperformed on the rebound. Nasdaq 100 stocks account for around a third of the S&P 500 (weighting). Relative weakness in QQQ is not a good sign for SPY either.
MAGS Forms Outside Reversal at Key Retracement
The next chart shows the Mag7 ETF (MAGS) with characteristics similar to QQQ. The ETF hit a new high in early July, plunged into August 5th and rebounded into late August. This rebound, however, was one of the weakest. Notice that MAGS did not exceed the August 1st high (red line). Also note that the ETF formed an outside reversal at the 66.7% retracement. Thus, we have a Resistance-Retracement Zone around 46. Traders should watch these zones for signs of a reversal. MAGS confirmed the outside reversal with further weakness, but remains above my re-evaluation levels at 43. A break here would negate the mid August breakout and argue for a correction to the 36-39 area.
Defensive Sectors Lead - Tech and Discretionary Lag
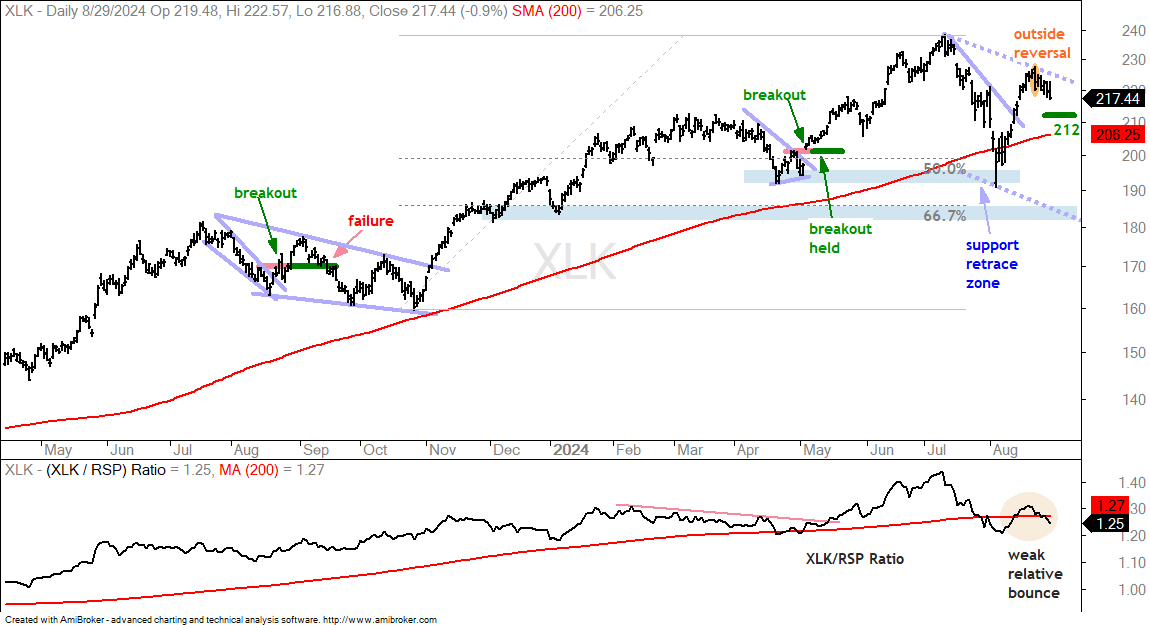
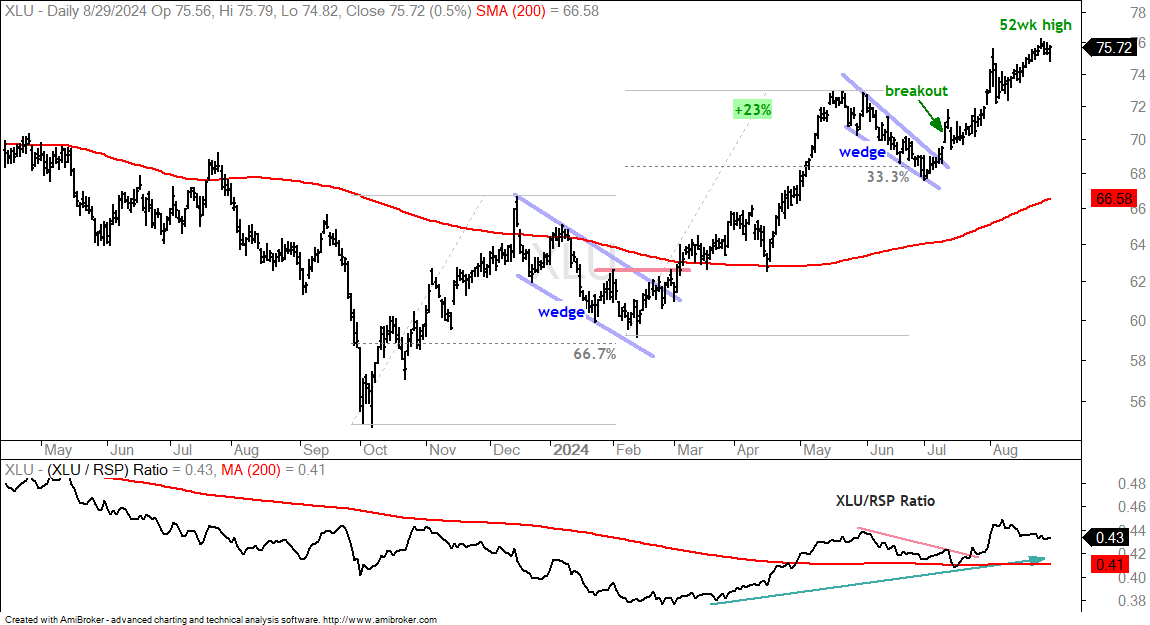
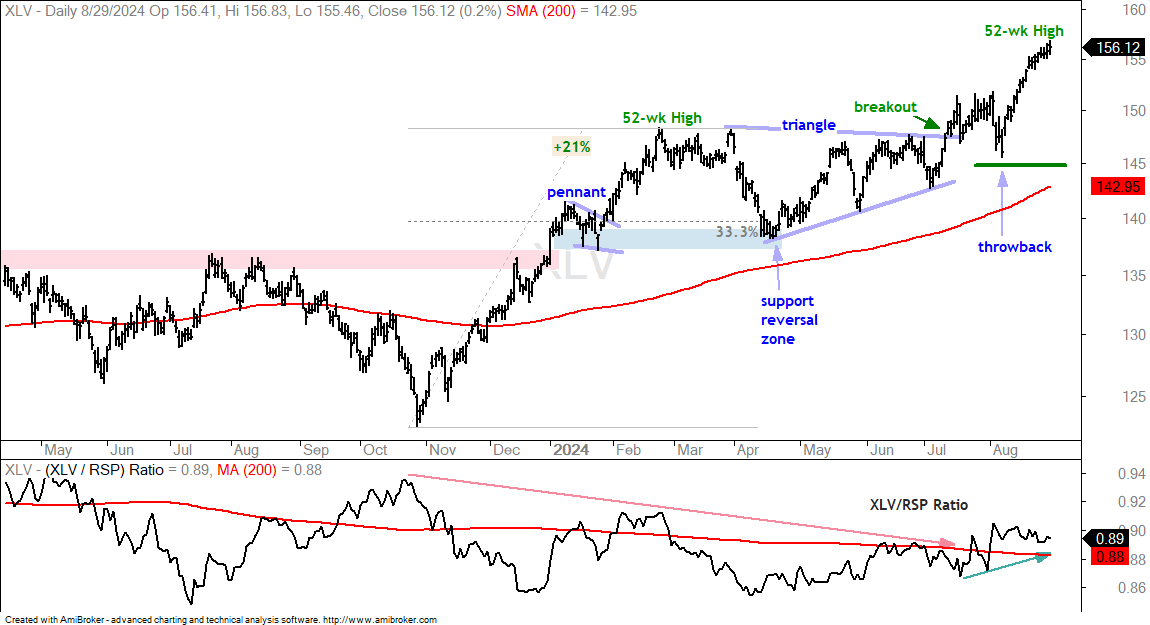
Seven of the eleven sector SPDRs hit new highs this week. These include Industrials (XLI), Finance (XLF), Healthcare (XLV), Consumer Staples (XLP), Utilities (XLU), Materials (XLB) and Real Estate (XLRE). This is largely positive as it shows money moving into other areas of the stock market. These new highs, however, came at the expense of Technology (XLK) and Consumer Discretionary (XLY), both of which remain well below their July highs. Communication Services (XLC) is back near its July high and holding up rather well. Energy (XLE) has been trending lower since April and is the weakest of the eleven sectors. The main takeaway here is that Tech and Consumer Discretionary are lagging, while Healthcare, Staples and Utilities are leading. This shows a defensive tilt in the market.
The first chart shows the Technology SPDR (XLK) with a short-term breakout around 212, some follow through and an outside reversal on August 22nd (yellow shading). XLK fell further after this reversal. A break below 212 would signal a failed breakout and a lower high from July to August. This would then open the door to a deeper correction with a target zone in the 180-190 area.
The next chart shows the Consumer Staples SPDR (XLP) with a breakout in mid July and a string of new highs in August. I do not see a tradable setup on this chart, simply a leading uptrend.
The next chart shows the Utilities SPDR (XLU) with a breakout in mid July, follow through and a string of new highs in August. Again, I do not see a tradable setup on this chart, simply a leading uptrend.
The next chart shows the Healthcare SPDR (XLV) with a triangle breakout in mid July, a throwback in early August and a strong rebound to new highs. I do not see a tradable setup on this chart, simply a leading uptrend.
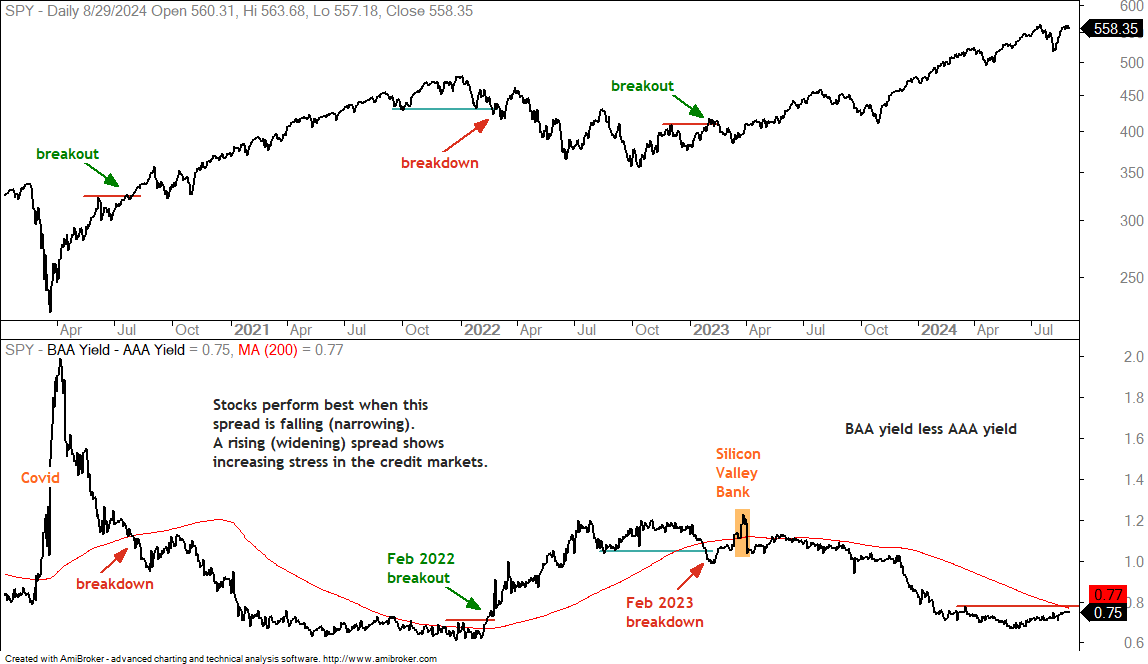
BAA Yield less AAA Yield
The next chart shows the difference between the BAA corporate bond yield and the AAA corporate bond yield (bottom window). According to Moody’s, AAA bonds are the highest grade corporate bonds with the lowest level of default risk. BAA bonds have moderate credit risk and “certain speculative characteristics”. The spread between these two narrows (falls) when credit conditions are favorable (no stress). The spread widens (rises) when conditions are deteriorating (increasing stress).
On the chart below, we can see some confirming signals with SPY and the spread. SPY broke out in July 2020 and the spread broke below its 200-day SMA (breakdown). SPY went on a strong bull run as the spread narrowed into late 2021. SPY then broke down in February 2022 and the yield spread broke out (widened) with a surge in February 2022. This brought on the 2022 bear market in stocks. SPY broke out with a higher high in February 2023 and the AAA-BAA spread broke down. After a Silicon Valley Bank hiccup, the spread narrowed into 2024 and remains relatively narrow. It edged higher since June, but remains short of a breakout that would signal significant widening. A break above the red line (March high) would show stress returning to the credit markets.
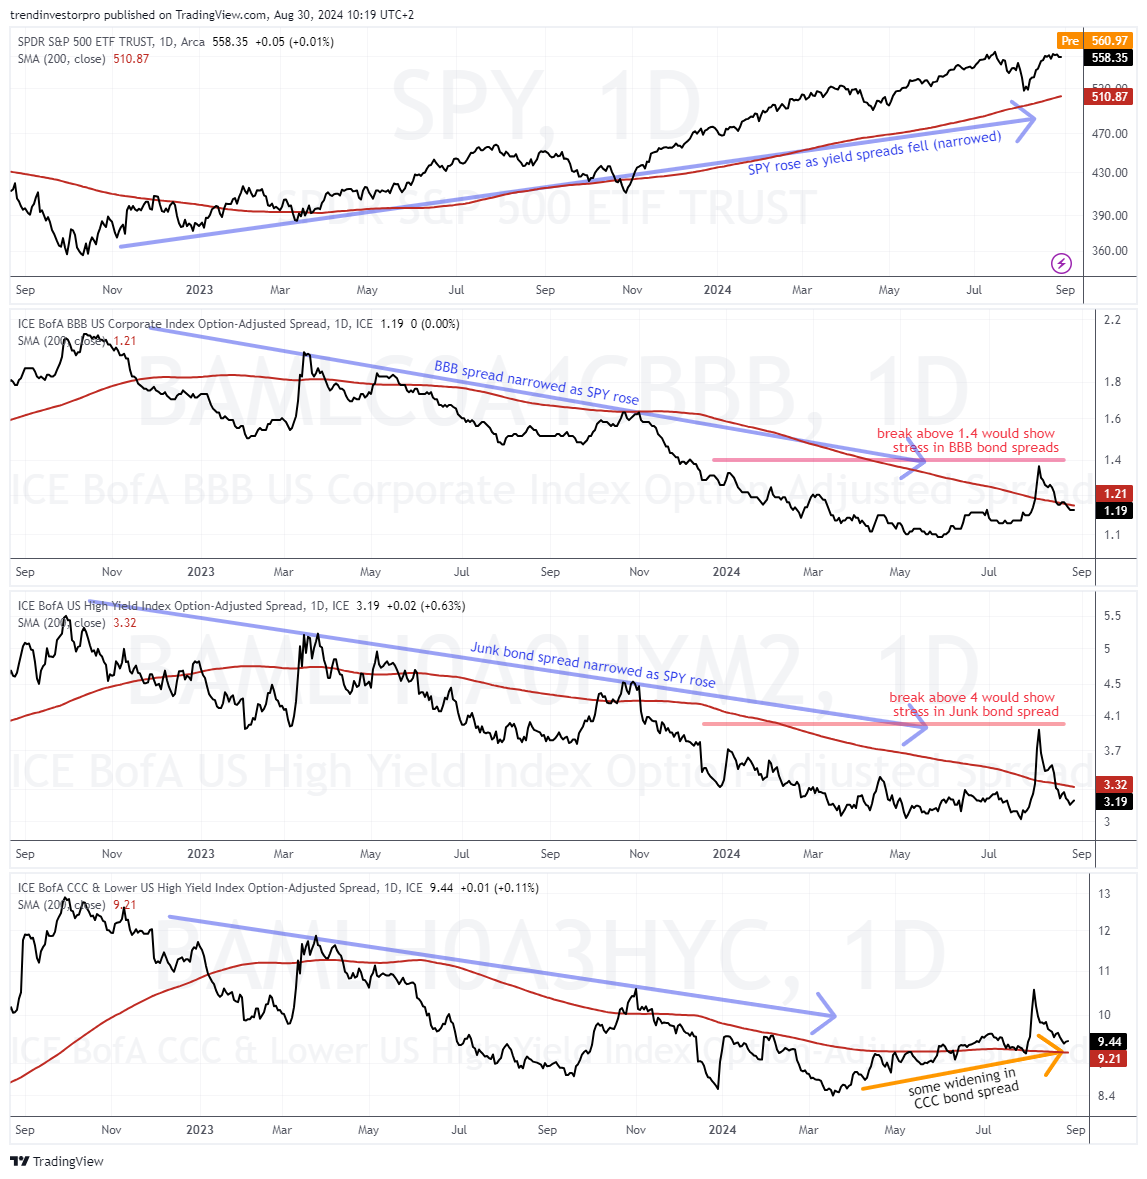
Yield Spreads Fall back as Stress Subsides
The chart below comes from TradingView. It shows SPY, the BBB spread, the Junk bond spread and the CCC bond spread with their 200-day SMAs. These yield spreads surged in early August and peaked on August 5th as news of the Yen carry trade unwind hit the markets. This widening in spreads immediately subsided as they fell back into their prior ranges. All three are still above their spring lows, but at relatively low (narrow) levels overall. More importantly, stress conditions subsided and this is positive for stocks. The red lines mark the key levels to watch for the BBB and Junk bond spreads.
SOXX Falls after Outside Reversal
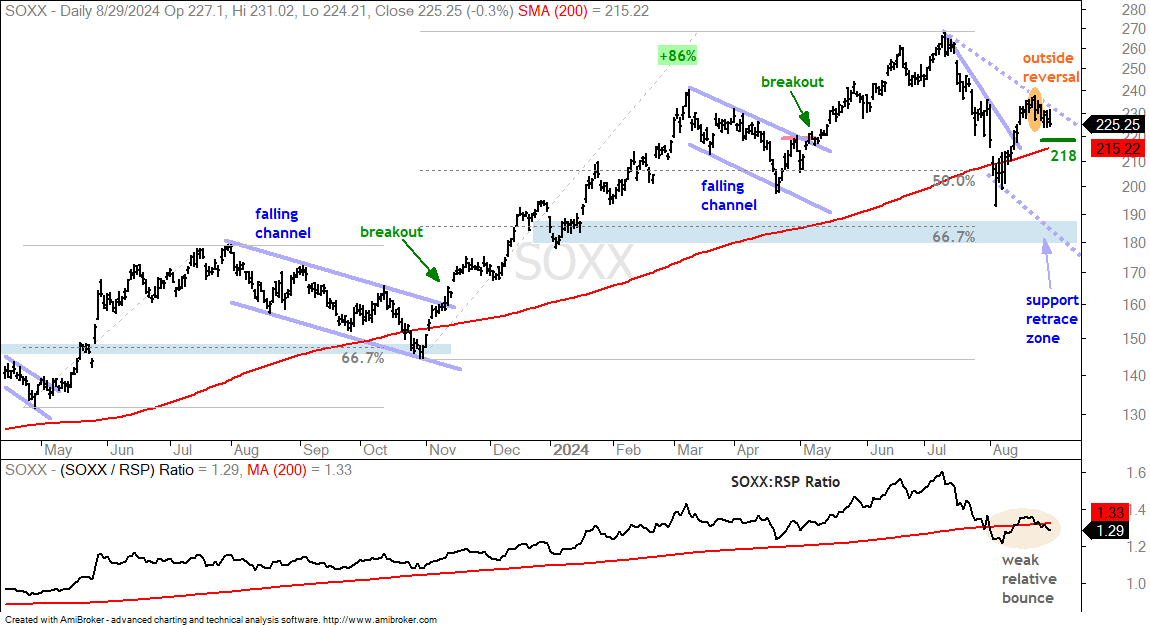
The first chart shows the Semiconductor ETF (SOXX) with a surge and breakout around 22 in early August. The ETF extended after this breakout and then formed an outside reversal on August 22nd. SOXX fell after this outside reversal and could be forming a lower high. I am also noticing relative weakness in August because of the weak bounce in the price-relative (SOXX:RSP ratio). I am therefore raising my re-evaluation level to 218. A failed breakout would put in a lower high and argue for a deeper correction, perhaps to the 180-190 area (blue shading).
CIBR Challenges February High
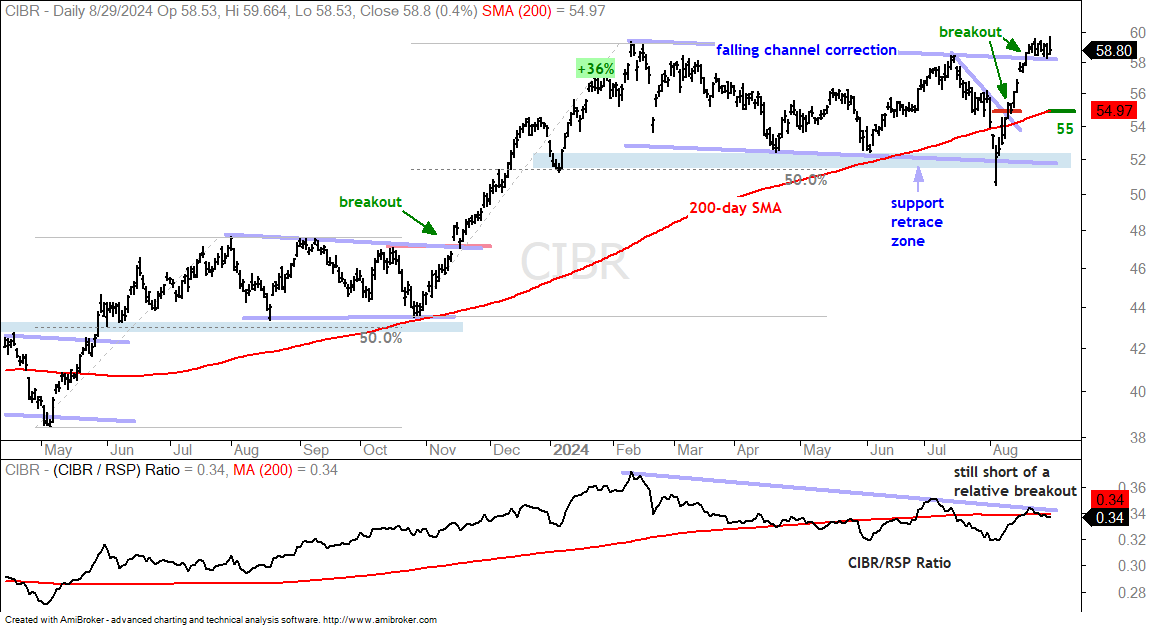
The Cybersecurity ETF (CIBR) is the strongest of the tech-related ETFs. Why? Because it broke its mid July high and exceeded the February high by a whisker (52wk High). Overall, CIBR advanced 36% in 70 trading days (late October to early February). It then embarked on a 130 day (six month) correction as a falling channel formed. CIBR broke short-term resistance with a surge in early August and followed through to break channel resistance. I view these breakouts as bullish. CIBR is still a bit short-term overbought after a 13.5% surge in mid August and this means we could see some choppy price action to digest the gains. I would use the short-term breakout level and rising 200-day to mark re-evaluation support at 55.
IGV Bounces within Long Consolidation
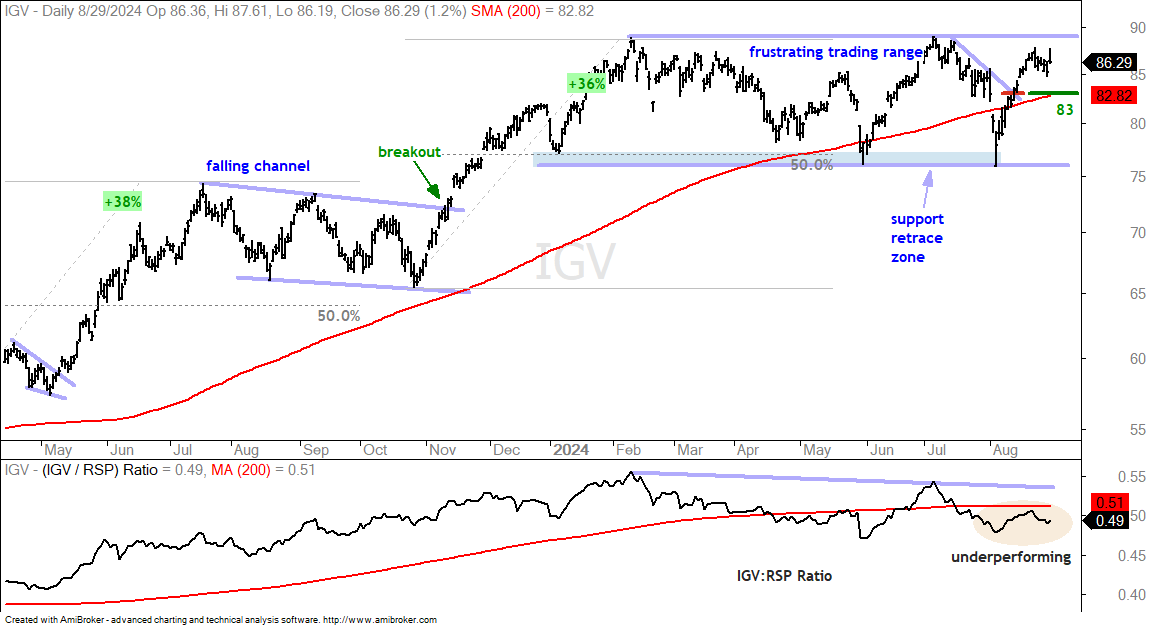
The next chart shows the Software ETF (IGV) struggling since February. IGV advanced 36% and then consolidated for six months with support around 76 and resistance near 89. It is a frustrating range as sharp declines lead to bounces and strong bounces are followed by pullbacks. Most recently, IGV surged in early August and broke short-term resistance. This means the cup is half full. As with XLK, IGV formed an outside reversal on August 22nd and then edged lower. This is potentially negative, but I will give it some wiggle room. My re-evaluation is set at 83. A close below this level would negate the short-term breakout and break the 200-day SMA.
FINX Breaks July High
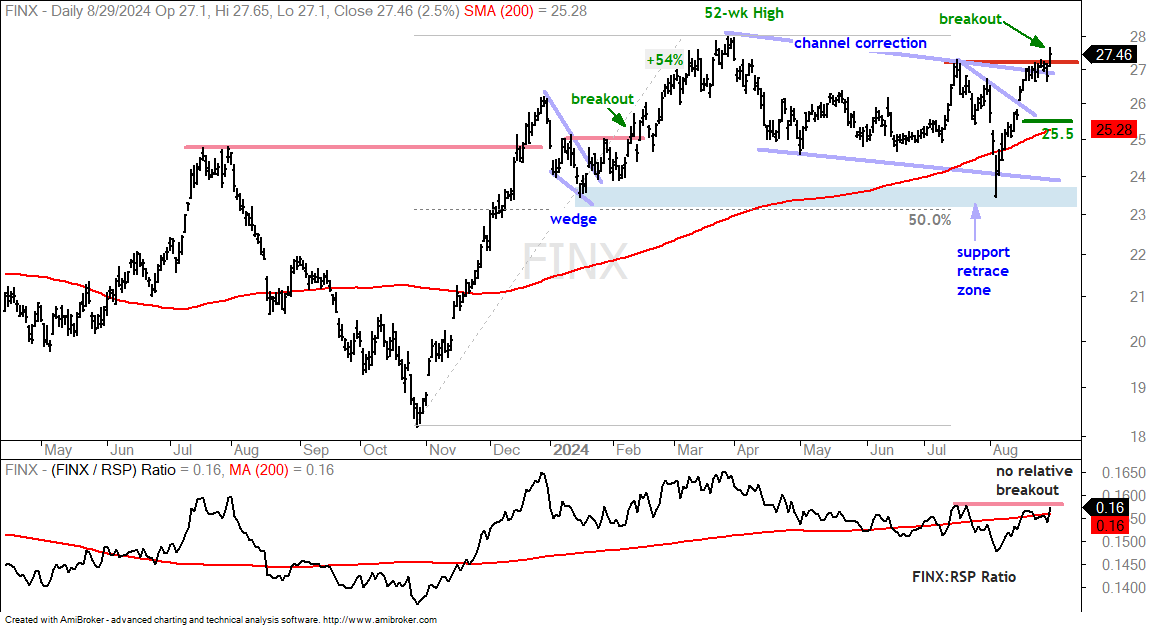
The next chart shows the FinTech ETF (FINX) with a 54% advance and new high in March. FINX then embarked on a long correction as a falling channel of sorts formed. After some serious fireworks (volatile moves) in July-August, the ETF broke the channel trendline and July high. Overall, I view this channel as a correction within a bigger uptrend. The break above the July high signals an end to this correction and a continuation higher. Short-term, FINX broke out with a surge in early August and I am marking my re-evaluation level at 25.50 (green line).
Leading ETFs: XLRE, ITB, ITA, KIE, IBB, FAN, PBJ
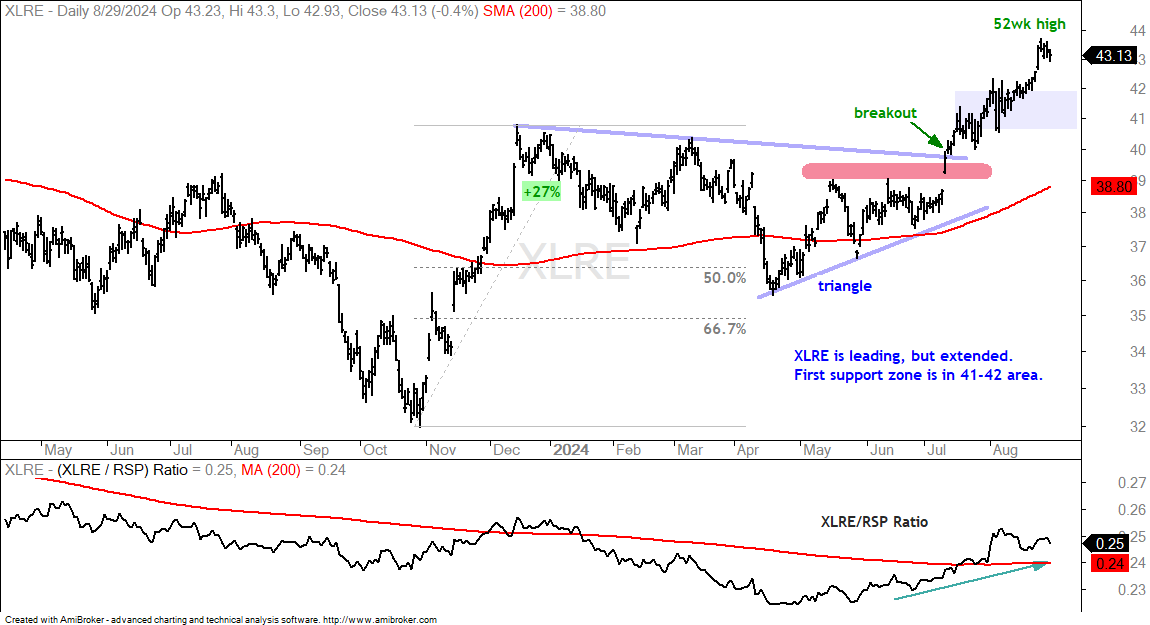
The next charts show some leading ETFs (groups). Some hit new highs and some are breaking out. The first chart shows the Real Estate SPDR (XLRE) with a six month consolidation and a breakout in mid July. XLRE extended on this breakout with new highs throughout August. The triangle represents a long consolidation after the 27% advance. This makes it a bullish continuation pattern. The mid July breakout ended this corrective period and signaled a resumption of the uptrend. XLRE is short-term extended after a 15% advance since early July, but it is clearly a leader and one to have on the radar.
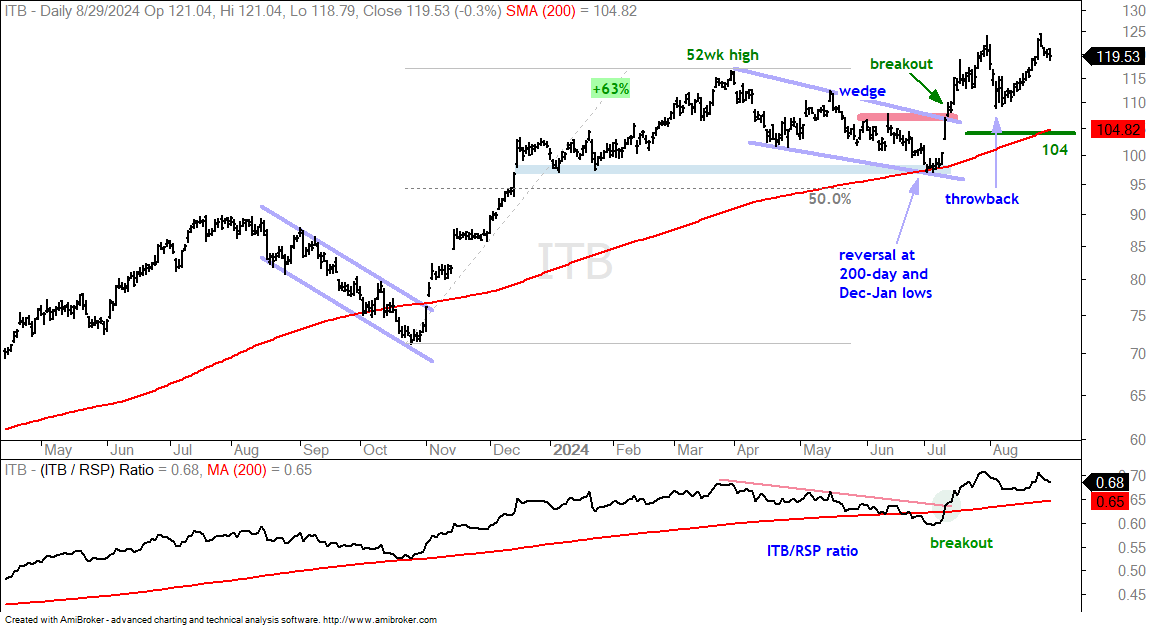
The next chart shows the Home Construction ETF (ITB) with a new high in March, a falling wedge correction into early July and a breakout in mid July. In contrast to some of the breakouts above, this breakout held during the early August air pocket. ITB fell back to the breakout zone (throwback), firmed for a few days and resumed its advance the last two weeks. This chart is bullish with the first re-evaluation level at 103.
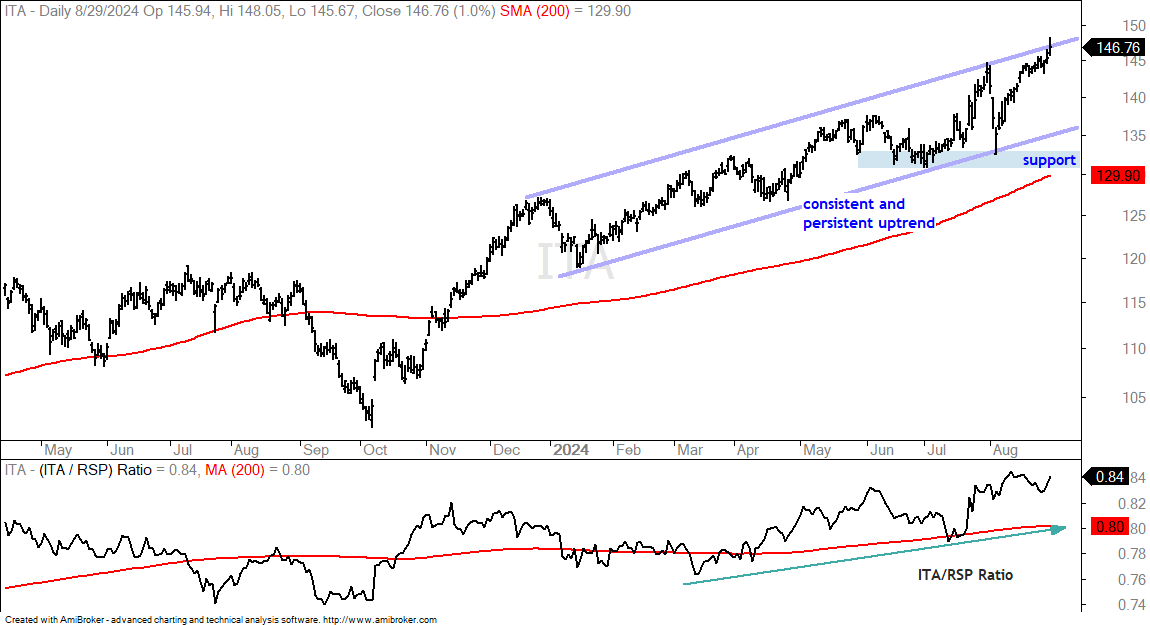
The next chart shows the Aerospace & Defense ETF (ITA) with one of the most consistent and persistent uptrends in the market right now. ITA surged from October to December, pulled back in January and then began its march higher. ITA hit new highs throughout the year and tagged a new high this week. It is also a bit extended short-term. Watch for a pullback into the 135-140 area for a chance to partake in this uptrend at a discount.
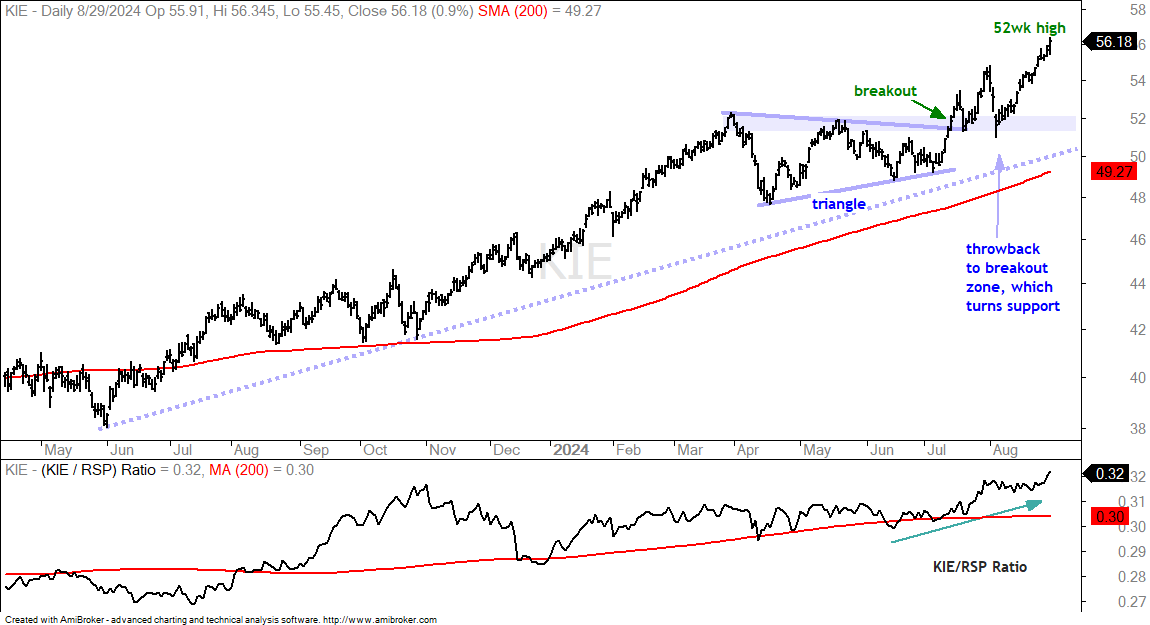
The next chart shows the Insurance ETF (KIE) with a strong uptrend over the last 18 months. The ETF consolidated from April to June with a triangle and broke out in mid July with a strong move. Notice how KIE surged above 54 in on August 1st and then fell back to the breakout zone on August 5th. This is a throwback to the breakout zone, which turns into support. Throwbacks offer a second chance to partake in the breakout. KIE moved to new highs this week and is leading the market.
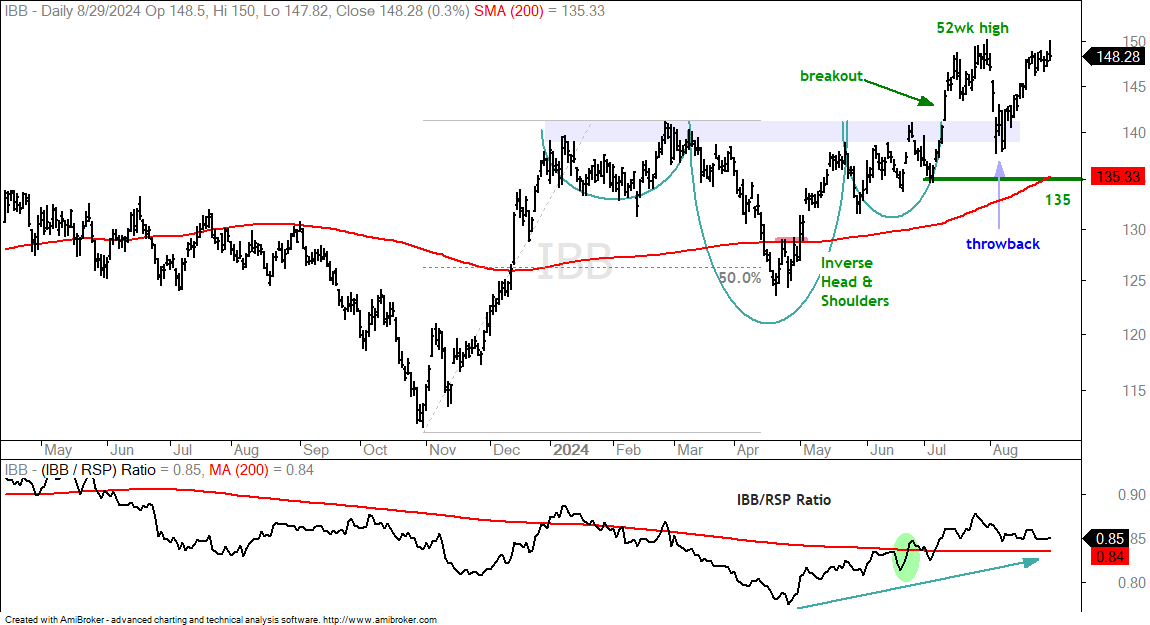
The next chart shows the Biotech ETF (IBB) with a breakout surge in mid July and a throwback in early August. The pattern from January to June looks like an inverse head-and-shoulders with a neckline breakout. After the throwback, the ETF rebounded with the rest of the market the last few weeks and is back near its 52-week high. The August low and rising 200-day mark support at 135.
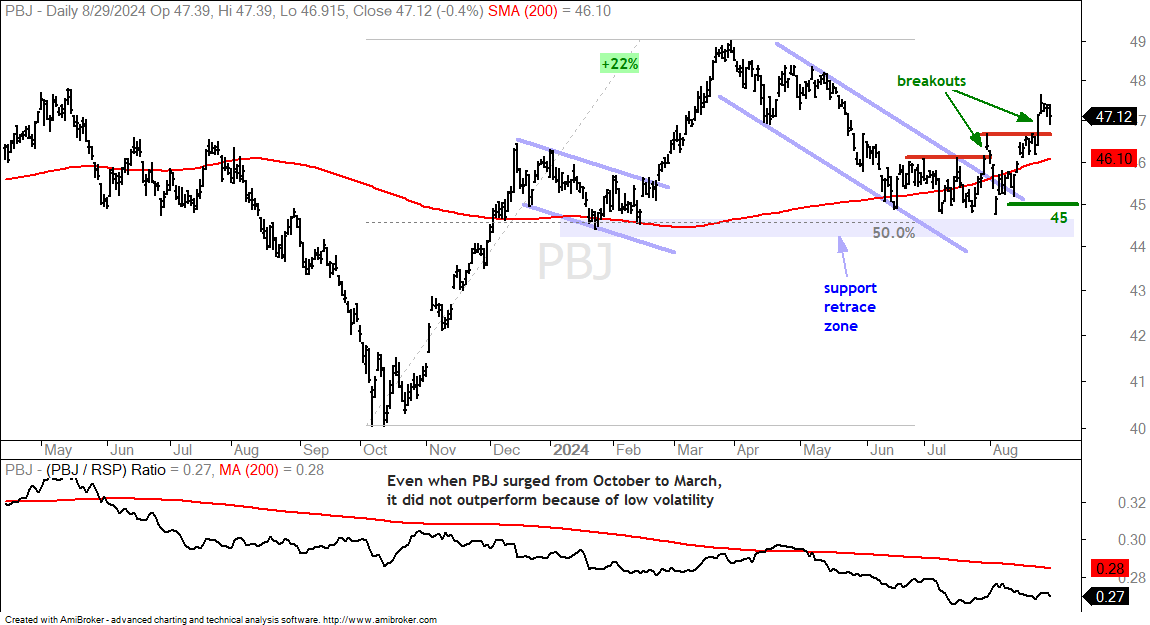
The next chart shows the Food & Beverage ETF (PBJ) with a pair of breakouts in August. First, the ETF surged some 22% and hit a new high in March. PBJ then corrected with a move back to the rising 200-day SMA. Notice that this move retraced half of the 22% advance and the ETF firmed just above the January-February lows (blue shading). This amounts to a Support-Retracement Zone that can give way to a price reversal. PBJ firmed around 45 for two months and broke out in August. These breakouts are bullish and signal a continuation of the bigger uptrend. Support is set at 45.
Palo Alto Breaks Out
Palo Alto Networks (PANW) is part of the Cybersecurity ETF (CIBR). The stock was leading the market into January, but got hit hard after an earnings report in February. The stock then started working its way higher and eventually formed a large triangle consolidation. I view this triangle as a big consolidation within a long-term uptrend. This makes it a bullish continuation pattern. PANW plunged below its 200-day SMA on August 5th, but quickly recovered and broke above its June-July highs. This move broke triangle resistance and signals an end to the consolidation. More importantly, it signals a continuation of the bigger uptrend. I am marking first support at 400.
CyberArk Challenges February High
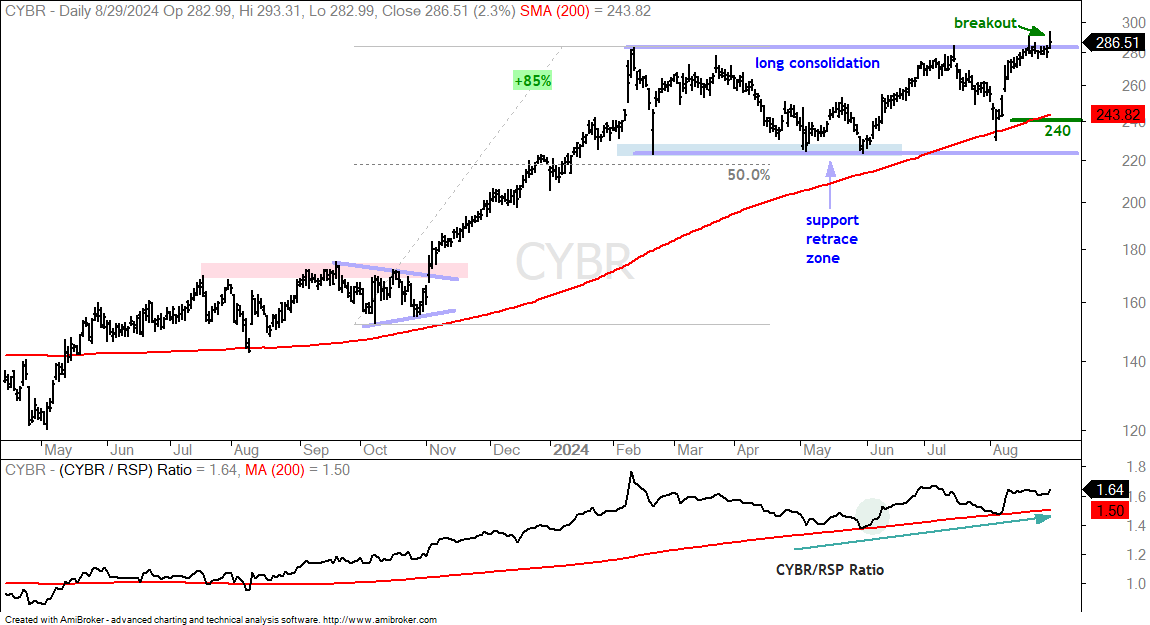
CyberArk (CYBR) is another stock in the Cybersecurity ETF (CIBR). It too was in a long consolidation and broke free this week. Overall, CYBR advanced some 85% into February and then traded in a range for six months (220-280). After tagging 280 in July, it returned to the 200-day SMA with the August 5th dip. CYBR held above the May low during this dip and quickly recovered with a run to resistance. As with PANW, I view this as a big consolidation within a long-term uptrend. The breakout is bullish and signals a continuation of this uptrend. I am marking re-evaluation support at 240.
Jack Henry Breaks Out of Channel
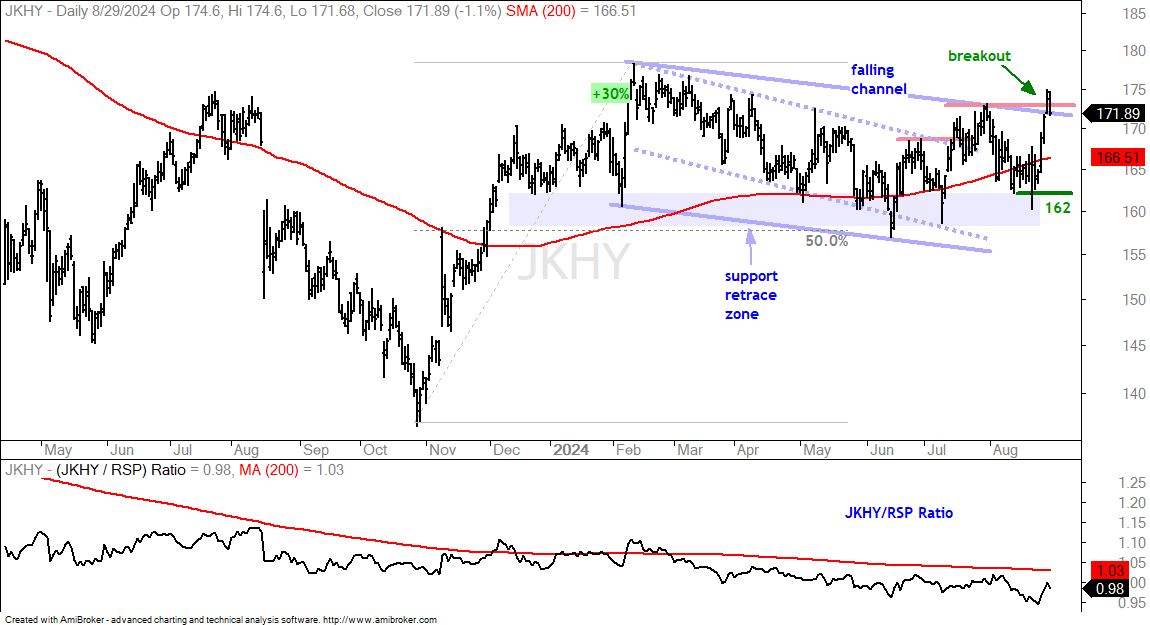
Jack Henry (JKHY) is part of the FinTech ETF (FINX). The company provides IT and payment related services to financial institutions. JKHY was featured on July 25th[7] with a channel breakout, but the channel was tighter then (dashed lines). On the price chart, JKHY advanced some 30% into February and then corrected back to the 200-day SMA in May-June. A rather wide falling channel formed as this correction retraced around 50% of the prior advance. Also notice that the low from December to July marked a support zone. Taken together, we have a Support-Retracement Zone to watch for a reversal. The stock took its time testing this zone from June to August, but finally broke out of the falling channel with a big surge this week. This breakout signals a continuation of the 30% advance and I will mark re-evaluation support at 162.
Paypal Breaks Out of Big Range
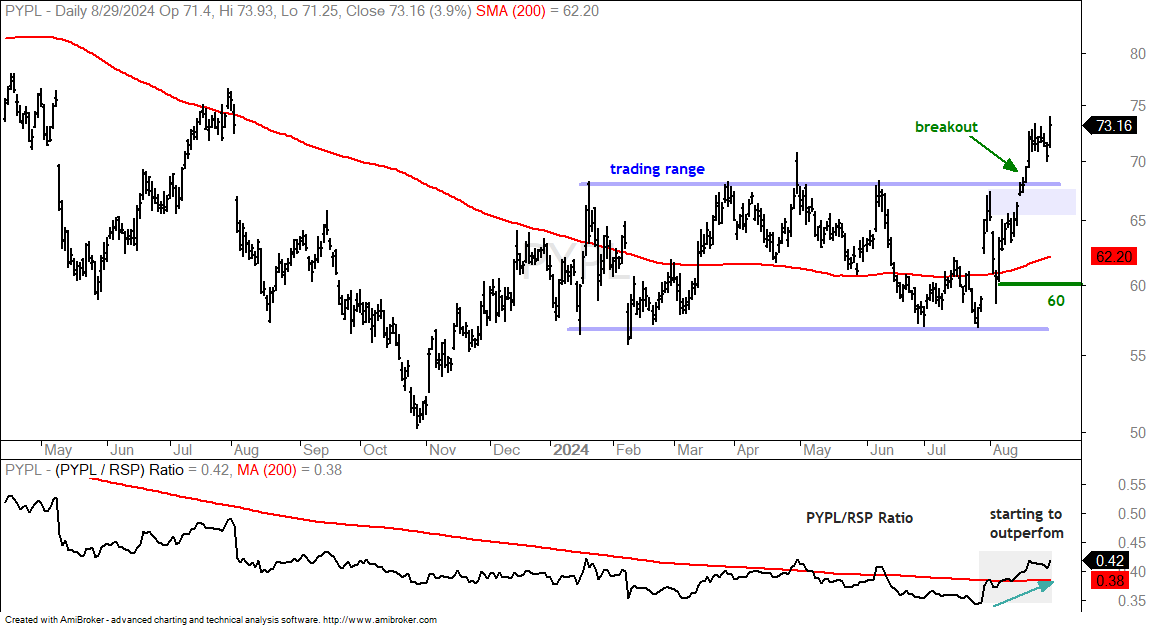
Paypal (PYPL) is also part of the FinTech ETF (FINX). In fact, it is the second largest holding and weighs in at 7% of the ETF. Paypal traded above 300 in 2021, but fell back to earth in 2022 and hit its nadir in October 2023. The stock bounced with the market from October to January and then moved into a large consolidation. PYPL established support in the 57 area and resistance around 68. The stock broke free with a big surge in August and hit a 52-week high. A breakout and a 52-week high are long-term bullish. PYPL is up some 20% since late July and a bit overbought short-term. This means we could see some backing and filling. The breakout zone turns into first support should we see a throwback. I would mark a potential support zone in the 66-68 area. I am marking long-term support at 60.
TLT Remains in an Uptrend
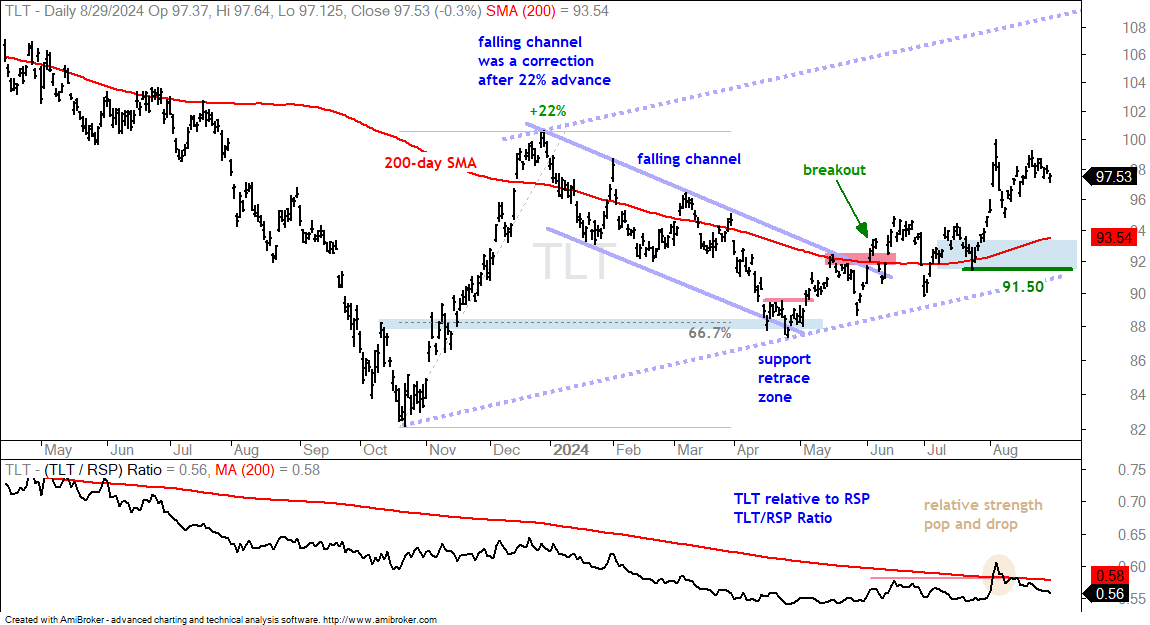
There is no change on the 20+ Yr Treasury Bond ETF (TLT) chart. The mid June breakout remains the current signal at work. Overall, TLT surged 22%, corrected with a 66.7% retracement and broke channel resistance in mid June. TLT worked its way higher since this breakout with a series of higher highs and higher lows. The July low marks long-term support at 91.50. The upside target is in the 108 area.
GLD Maintains Breakout
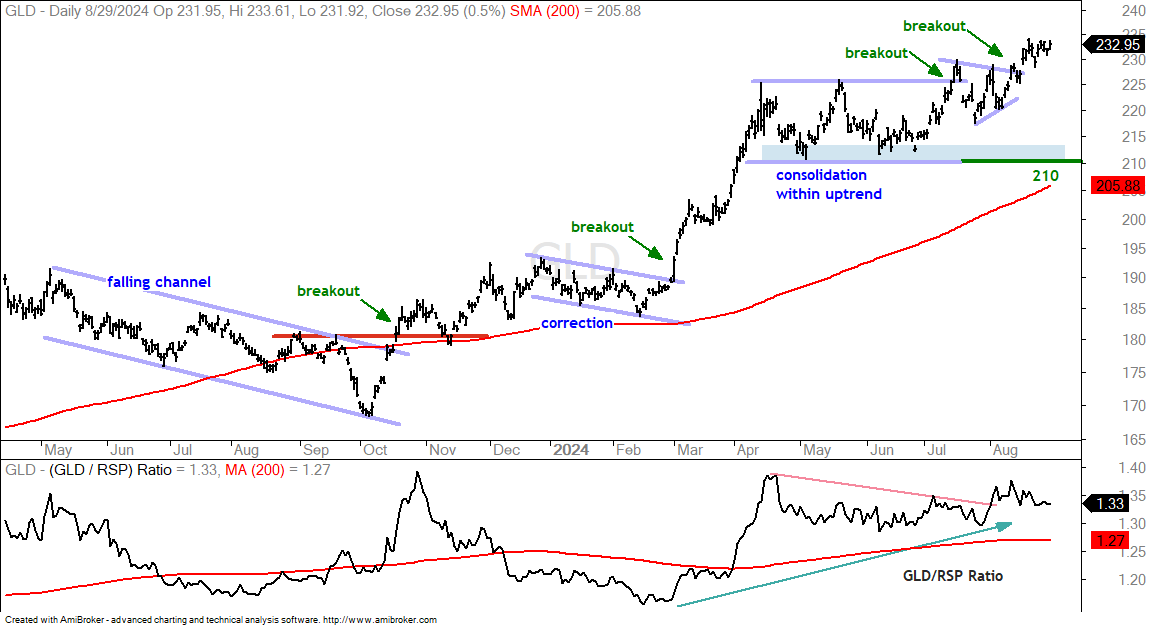
There is no change in the Gold SPDR (GLD) chart as the ETF tagged new highs here in August. GLD is well above its rising 200-day SMA and in a long-term uptrend. Most recently, GLD consolidated from mid April to early July and broke out in mid July. There was a battle around this breakout zone as the ETF formed a pennant, but the breakout ultimately held. The May-June lows mark support at 210.
Bitcoin Bounces within Downtrend
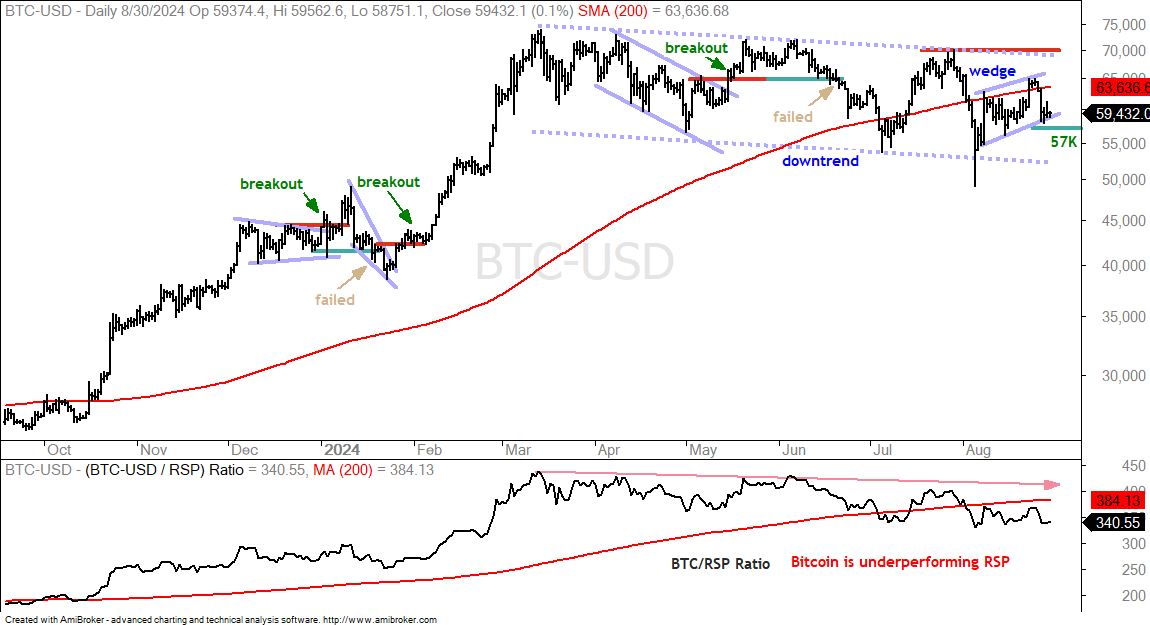
Bitcoin remains in a long-term downtrend with a series of lower lows and lower highs since April. This benchmark crypto currency fell sharply in early August as the market got hit with a risk-off rush. Bitcoin also recovered with the market over the last few weeks and even broke its 200-day SMA, though it did not lasty. Overall, I view this bounce as a counter-trend bounce and will mark short-term support at 57000. A break here would reverse the short-term upswing and signal a continuation lower. The downside target is in the 4500 area.