AVGO Breaks out of Falling Channel AMAT Surges Back above Rising 200-day
MSFT and GOOGL Reverse Near Support-Retracement Zones
META Forms Bullish Ascending Triangle
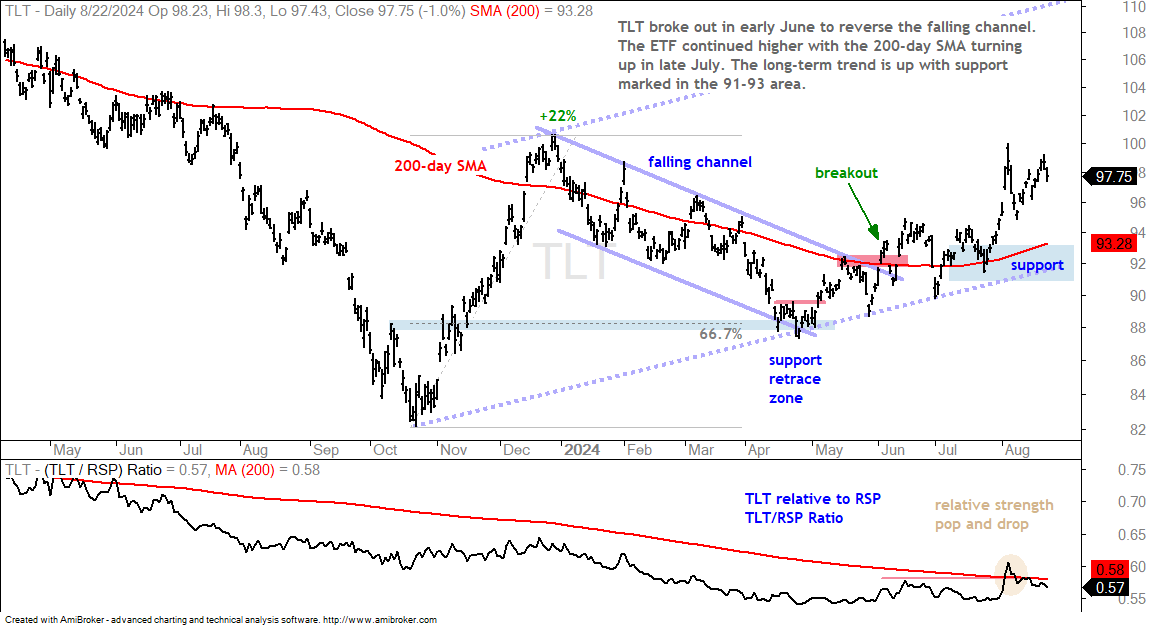
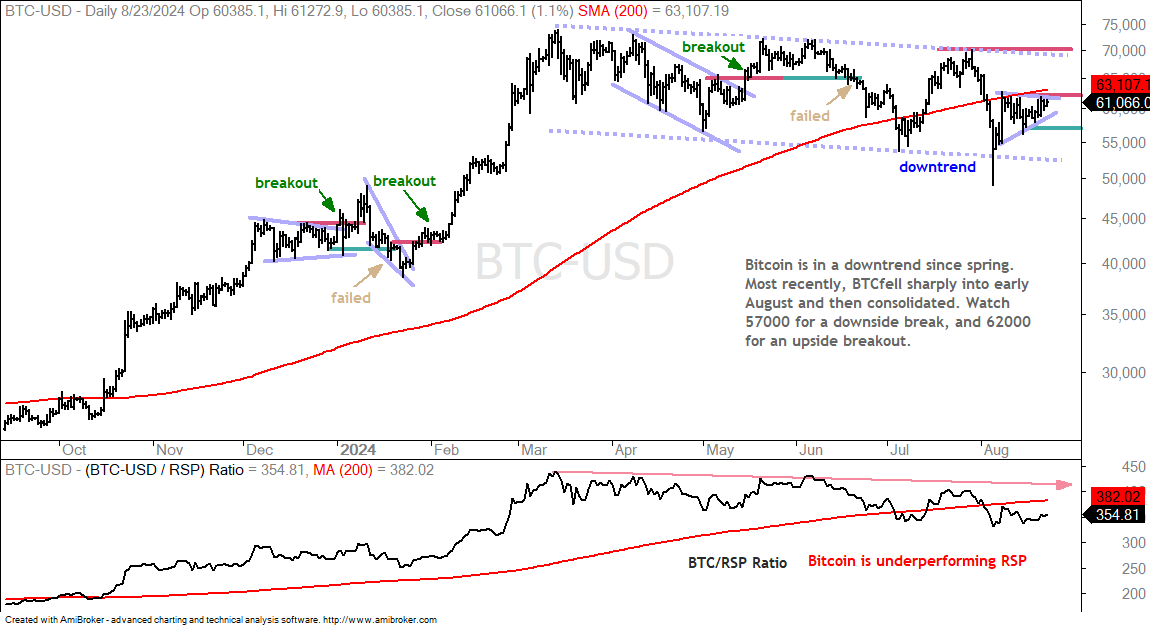
Gold SPDR, 20+ Yr Treasury Bond ETF and Bitcoin
The next Chart Trader will be posted on Friday morning, August 30th.
Programming Note - Moving to Fridays
Instead of producing two reports on Tuesdays and Thursday, I would like to combine the analysis and move to one report on Fridays. This will give the report move shelf life and give subscribers more time to access the analysis (Friday, Saturday, Sunday).
There will be two reports on Friday. First, there will be a broad market report that includes the breadth models and yield spreads. Second, there will be a report focusing on the big three (SPY,QQQ,MAGS), select ETFs and stocks, the Gold SPDR, the 20+ Yr Treasury Bond ETF and Bitcoin.
Our breadth models remain bullish[7], which means we are in a bull market environment. SPY, QQQ and MAGS are in long-term uptrends to confirm the bull market. All three corrected with sharp declines into early August, but rebounded with steep advances and broke short-term resistance levels. Many stocks and ETFs became short-term overbought this week and these conditions could lead to some corrective price action. I am also concerned because volatility reared its ugly head with the highest readings in over a year. This is not outright bearish, but it increases the chances for a choppy trading environment.
Stocks Became Short-term Overbought
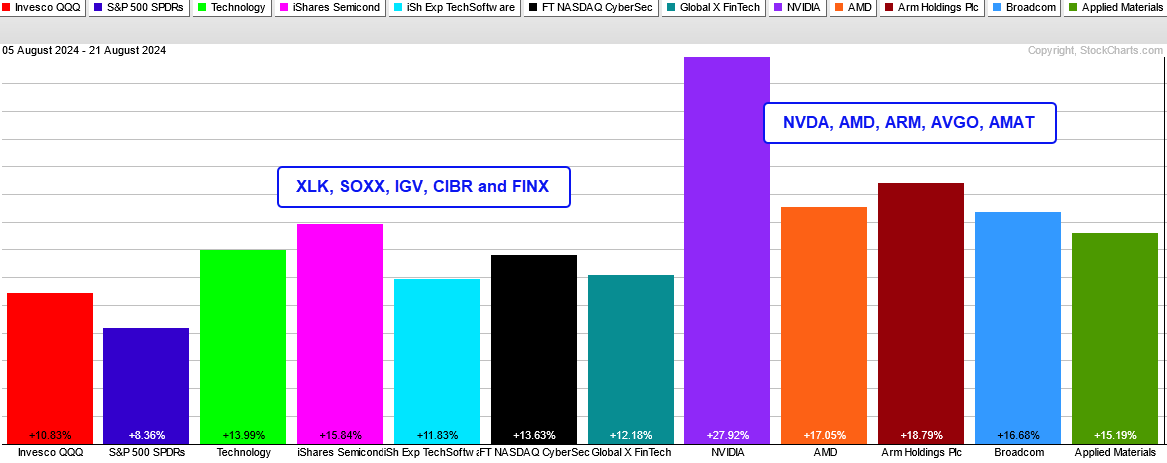
Many ETFs and stocks became short-term overbought after sharp advances from August 5th to 21st. Many tech-related ETFs and stocks were up over 10%. Short sharp moves show strong buying pressure and this is bullish because it shows strong upside momentum. Overbought conditions, however, increase the odds for a corrective period to digest gains.
The chart above shows QQQ, SPY, XLK, SOXX, IGV, CIBR and FINX with 10 plus percent gains (5 to 21 August). We then have NVDA with a 28% gain and four other semiconductor stocks with gains greater than 15%. Coming off a multi-month low, such gains would likely signal the start of a big bull run, as in early December 2023. These gains, however, are coming after a sharp pullback from new highs. In other words, this is not a thrust off multi-month lows.
Volatility Increases
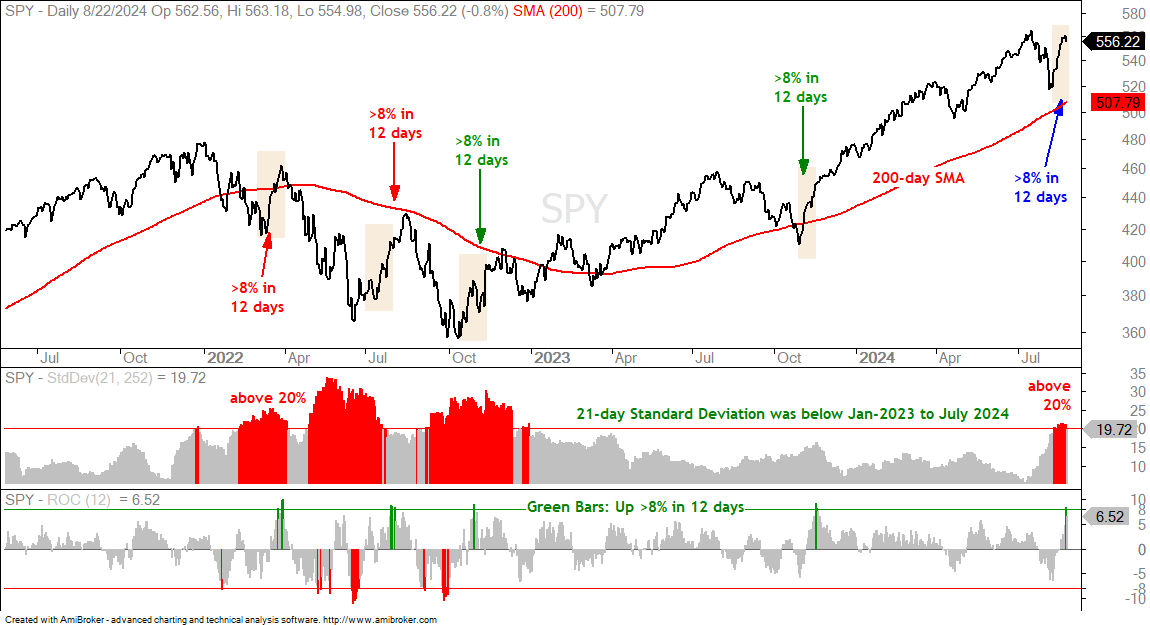
The next chart shows SPY with the 21-day Standard Deviation and the 10-day Rate-of-Change indicators. After laying low from January 2023 to July 2024, the 21-day Standard Deviation surged above 20% for the first time since December 2022. Bull markets thrive in low volatility environments and this expansion could be negative. At the very least, it points to an increase in volatility that could lead to choppy trading.
Not all sharp surges result in further gains. It usually depends on the starting point and broad market conditions. The bottom window shows the 12-day Rate-of-Change exceeding +8% in March 2022, July 2022, October 2022, November 2023 and August 2024. The sharp advances in March and July 2022 were bear market bounces (red arrows). In contrast, the sharp advances in October 2022 and November 2023 kicked off extended bull runs (green arrows). This advance is a bit different because it is the only one that started when SPY was above the 200-day SMA. The other four started when SPY was below its 200-day SMA. Thus, this one is not starting from a position of long-term weakness.
SPY Maintains Long-term Uptrend
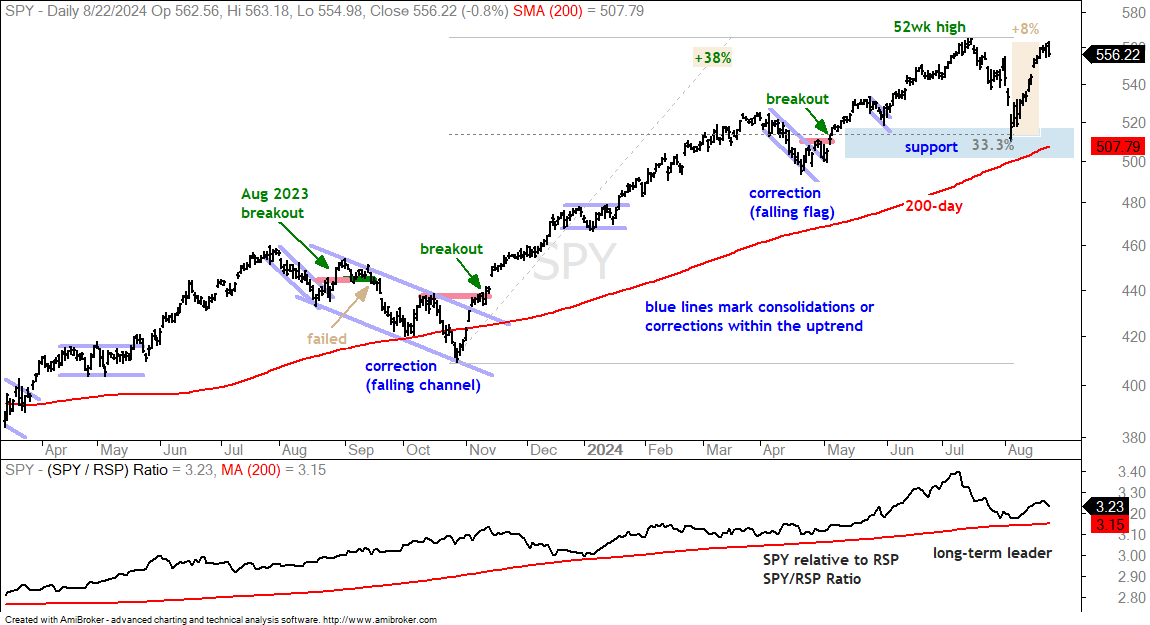
SPY is in a long-term uptrend. It is above the rising 200-day SMA and near its July high. SPY fell 10% from the July high to the August 5th low, and then surged over 8% in 12 days. The ETF is back near its July high and stronger than QQQ, which is still well below its July high. The 10% decline from the July high to the early August low could be an “accelerated” correction. SPY also corrected with a 10% decline in 2023. This decline, however, extended from late July to late October and lasted three whole months. Corrections take all shapes and forms. Some are short and sharp (recently), and some are extended (Jul-Oct 2023). The August low, 33% retracement and rising 200-day SMA mark long-term support in the 500-520 area.
QQQ and MAGS Extend on Breakouts
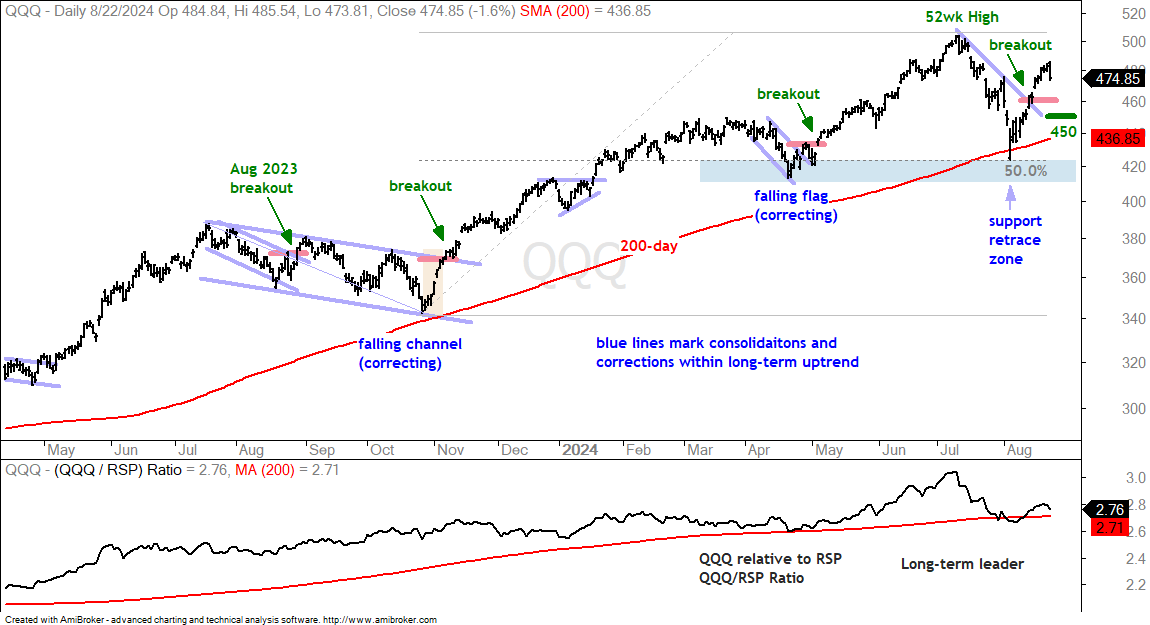
QQQ is in a trend is up with support marked in the 420 area. QQQ fell harder than SPY as it dipped below the 200-day SMA on August 5th. The ETF fell 16% from the mid July high to the early August low. On a closing basis, QQQ fell around 13.5% in four weeks. For comparison, QQQ fell just 12% during the correction from late July to late October 2023. With the early August plunge, QQQ found support near the April low, the 50% retracement line and the rising 200-day SMA (blue shading). The ETF then broke the July trendline and short-term resistance on August 13th. The short-term trend is up with this breakout. A close below 450 would negate the short-term breakout and perhaps lead to a corrective period.
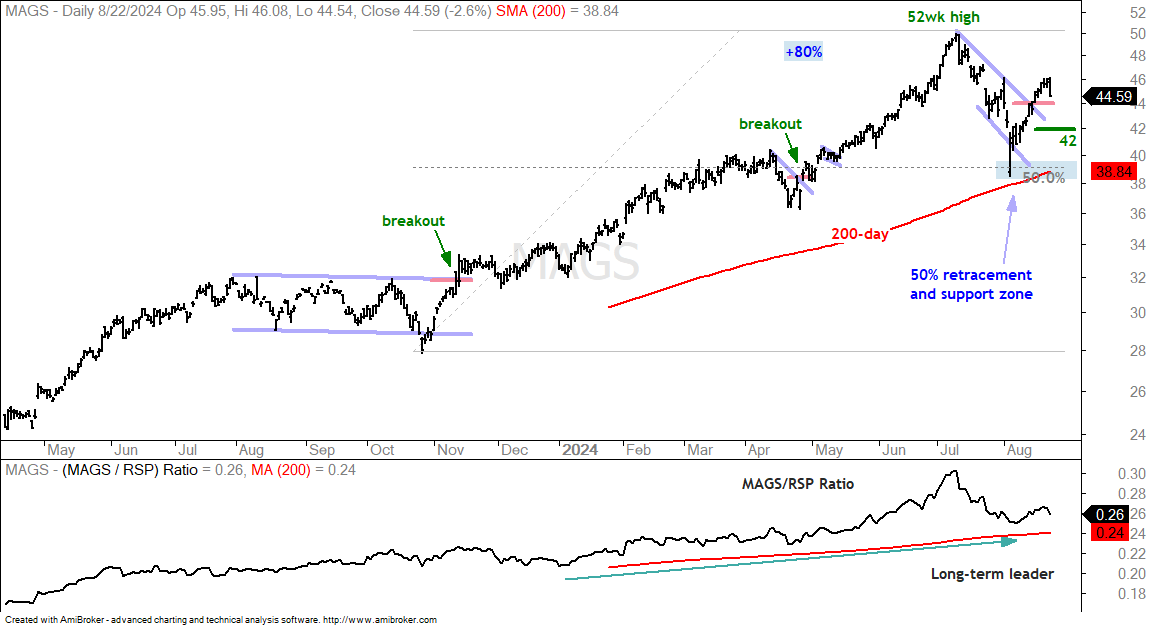
QQQ is not going very far without help from the Mag7 ETF (MAGS) so I will include it with the broad market analysis. The chart below shows MAGS hitting a new high in mid July and then falling sharply to the 50% retracement line with the intraday low in early August. Overall, the 38-40 zone marks a Support-Retracement Zone (rising 200-day SMA and 50% retracement line). MAGS bounced off this zone and broke short-term resistance at 44 to reverse the short-term decline. The ETF extended on this breakout and I would mark re-evaluation support at 42. A close below this level would signal a failed breakout and put the ETF back in corrective mode.
Prior Reports
Note that short-term resistance levels were marked for SPY, QQQ and MAGS in the report on August 13th[8]. I also covered NVDA, AVGO, GEHC and ABT in this report.
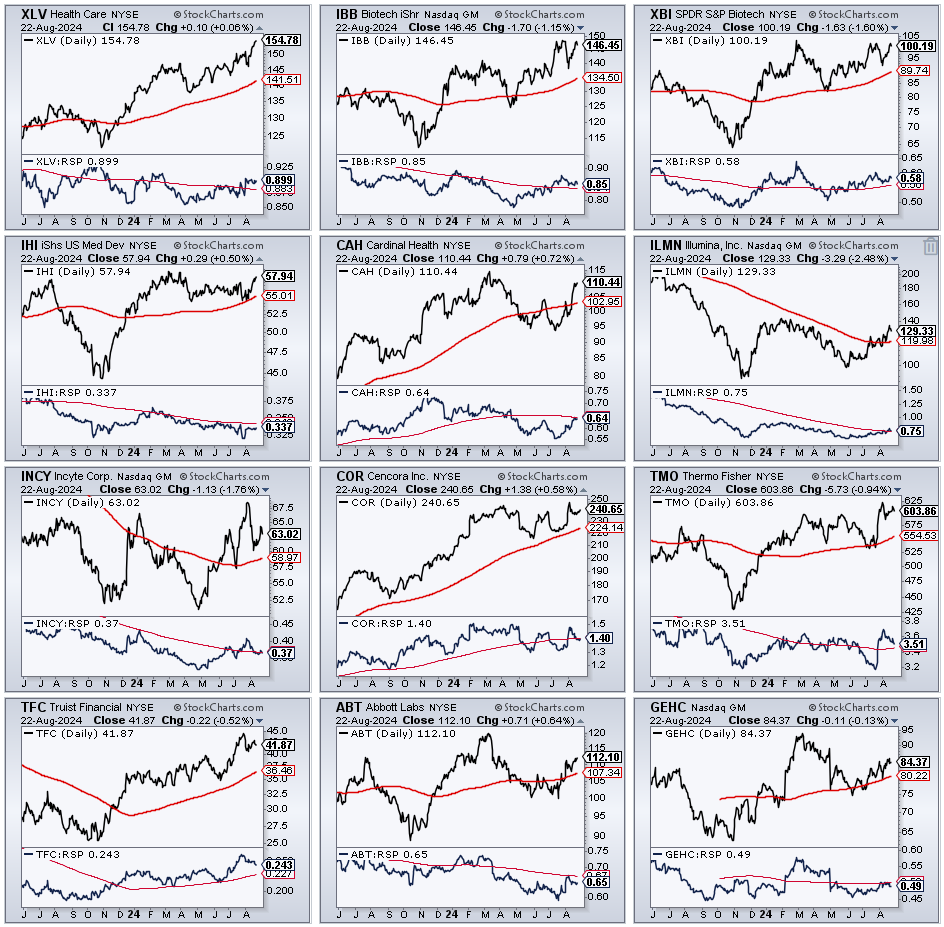
Tuesday’s report[9] featured the Healthcare SPDR (XLV), Biotech ETF (IBB) and three Healthcare stocks (CAH,ILMN,INCY). The report/video from August 15th[10] featured four more Healthcare stocks (COR,TMO,ABT,GEHC).
Breakout, Plunge and Surge - All in 12 Weeks
Many charts were looking good in mid July with surges and breakouts. Then came normal pullbacks into late July and then came the air pocket in early August. Fueled by the unwinding of the Yen carry trade, stocks fell sharply on August 1st, 2nd and 5th. Many tech-related stocks even broke below their rising 200-day SMAs in early August. Stocks then rebounded with sharp advances the last 13 days. Wow, what a roller coaster. We do not need a volatility indicator to understand that volatility is up. Tech-related stocks led the recovery with some of the sharpest advances off the August 5th lows. This means the rising 200-day SMAs are back in play. The August surge is in good shape as long as the rising 200-day SMAs hold. There were also several short-term breakouts last week. On the charts below, I will mark the short-term breakout levels and the first support levels to watch going forward.
XLK and SOXX Surges off Support-Retracement Zone
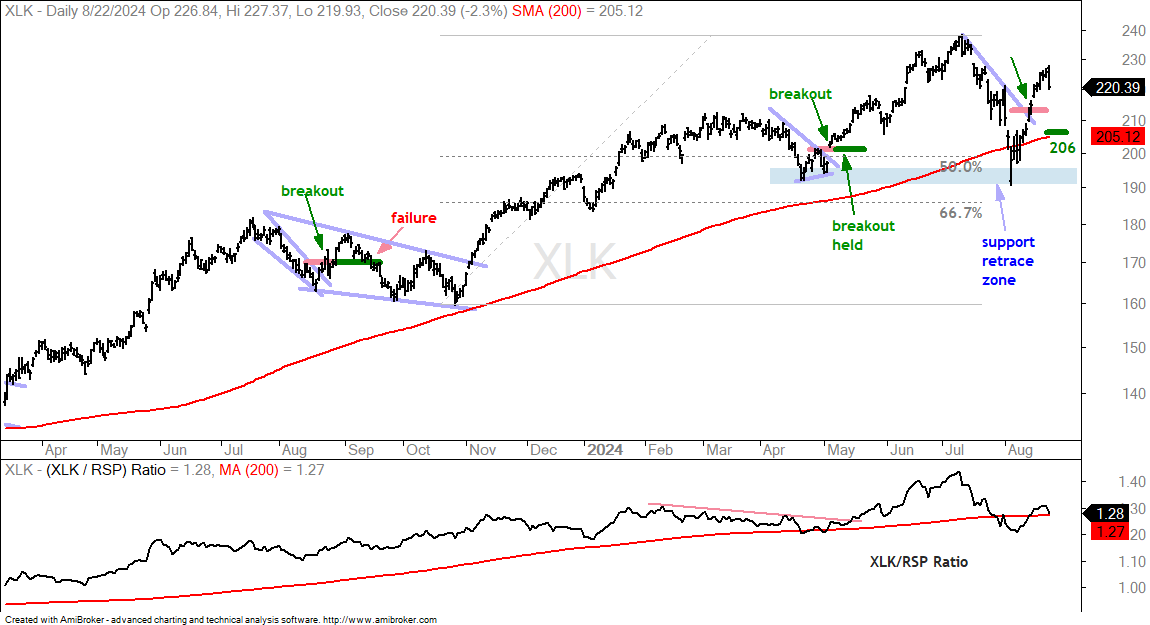
The chart below shows the Technology SPDR (XLK) bouncing off the Support-Retracement Zone in the 190-195 area and breaking short-term resistance. The re-evaluation level is set at 206. Note that a close below 206 would negate the breakout, but it would not reverse the long-term uptrend. It would simply suggest that the corrective process is extending. Declines are considered as corrections as long as the long-term trend is up.
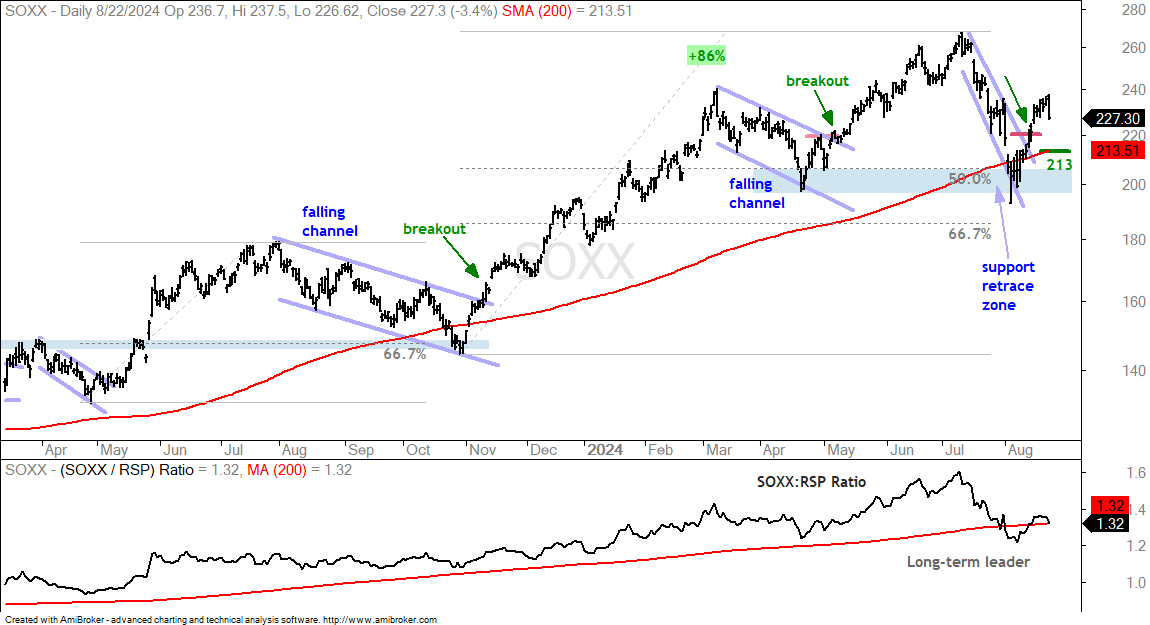
The next chart shows the Semiconductor ETF (SOXX) with a chart profile similar to XLK above. This is no surprise because semiconductors and semiconductor equipment account for a whopping 42% of XLK[11]. NVDA, AVGO and AMD are the top three. The chart shows SOXX bouncing off the Support-Retracement Zone in the 200 area and breaking short-term resistance. The re-evaluation level is set at 213.
IGV, CIBR and FINX Renew their July Breakouts
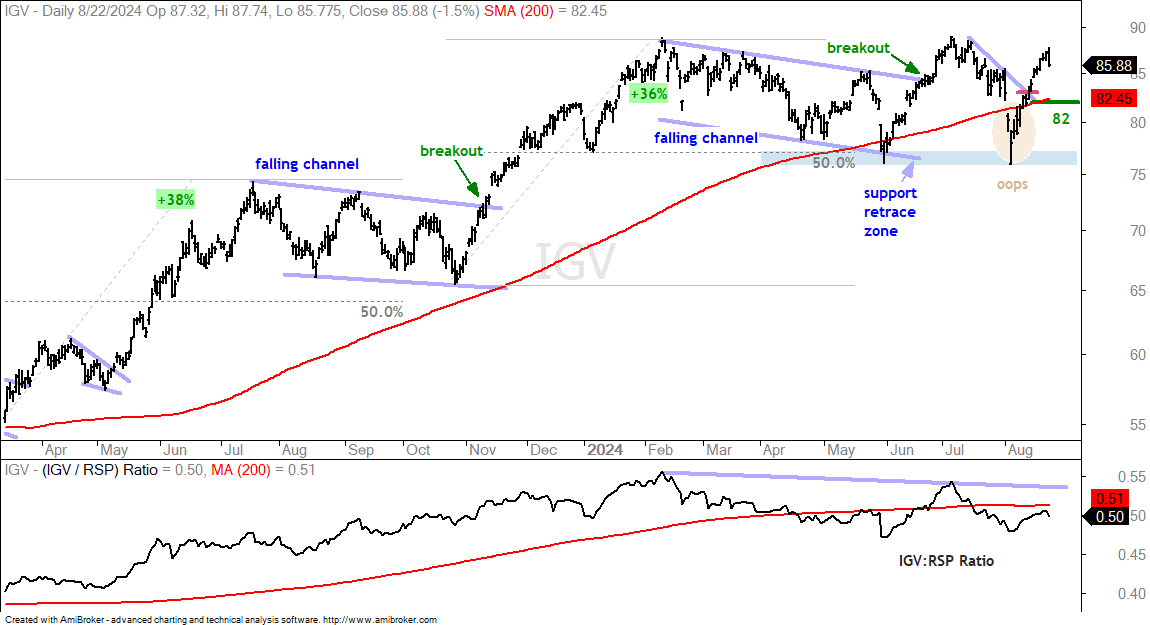
The next chart shows the Software ETF (IGV) with a falling channel correction into late May (dashed blue lines) and a breakout in mid June. This breakout failed as the ETF fell back below the 200-day SMA on August 2nd and 5th (oops). This break did not last long either as IGV surged back above the 200-day SMA. It was a messy hold, but this key moving average ultimately held. More importantly, it looks like the channel breakout from late June is back in play. Short-term, IGV broke out on August 13th and I view this as bullish. Re-evaluation support is set at 82. A close below this level would negate the short-term breakout and the channel breakout.
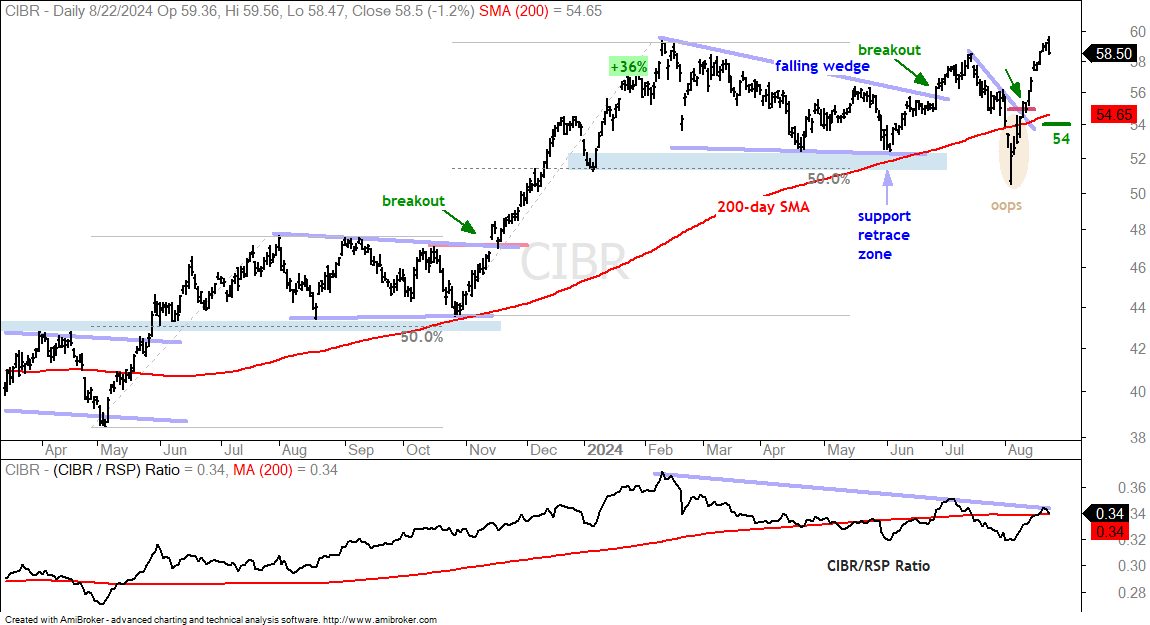
The Cybersecurity ETF (CIBR) chart is similar to the IGV chart above. CIBR hit a Support-Retracement Zone around 52 in late May and broke wedge resistance with a surge in late June. A normal pullback started in July, but selling pressure accelerated and CIBR broke the rising 200-day SMA. This break down did not last long as the ETF surged above its mid July high over the last two weeks. Overall, the falling wedge breakout is back on and I am marking re-evaluation support at 54 (just below the 200-day SMA).
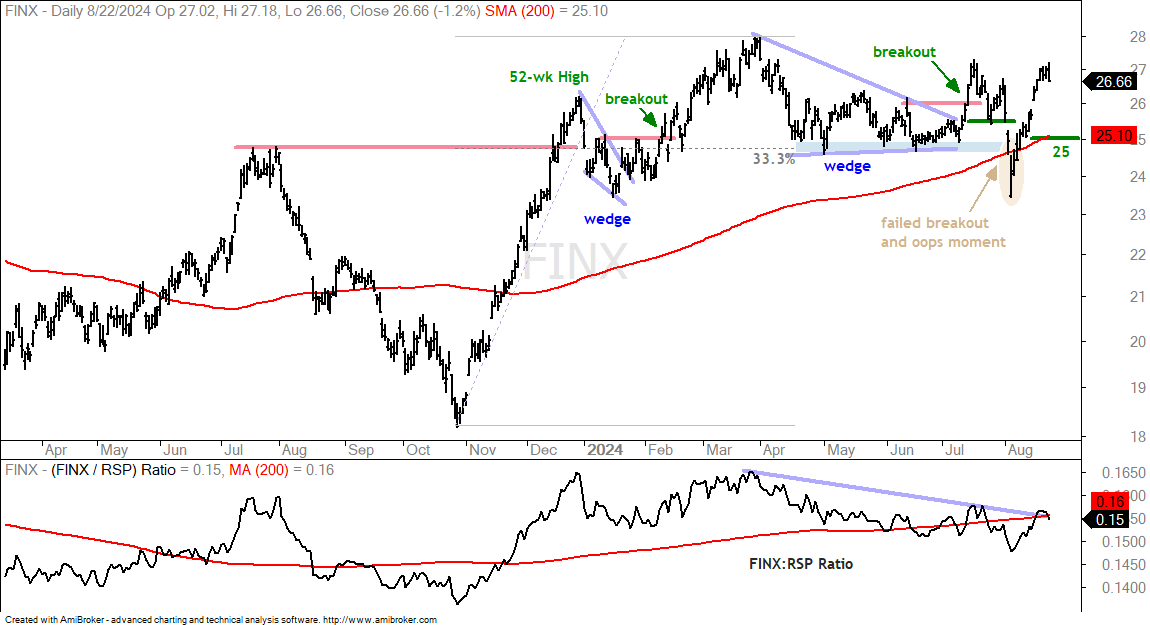
The next chart shows the FinTech ETF (FINX) with a failed breakout, an oops moment and a sharp rebound. The wedge breakout was looking good in mid July, but the ETF plunged into early August and broke the 200-day SMA. Again, this break did not last long as FINX quickly recovered and returned to its mid July levels. Overall, I am calling this an oops moment. The July breakout is back on with first re-evaluation support marked at 25.
XLC Leads with a Steady Uptrend
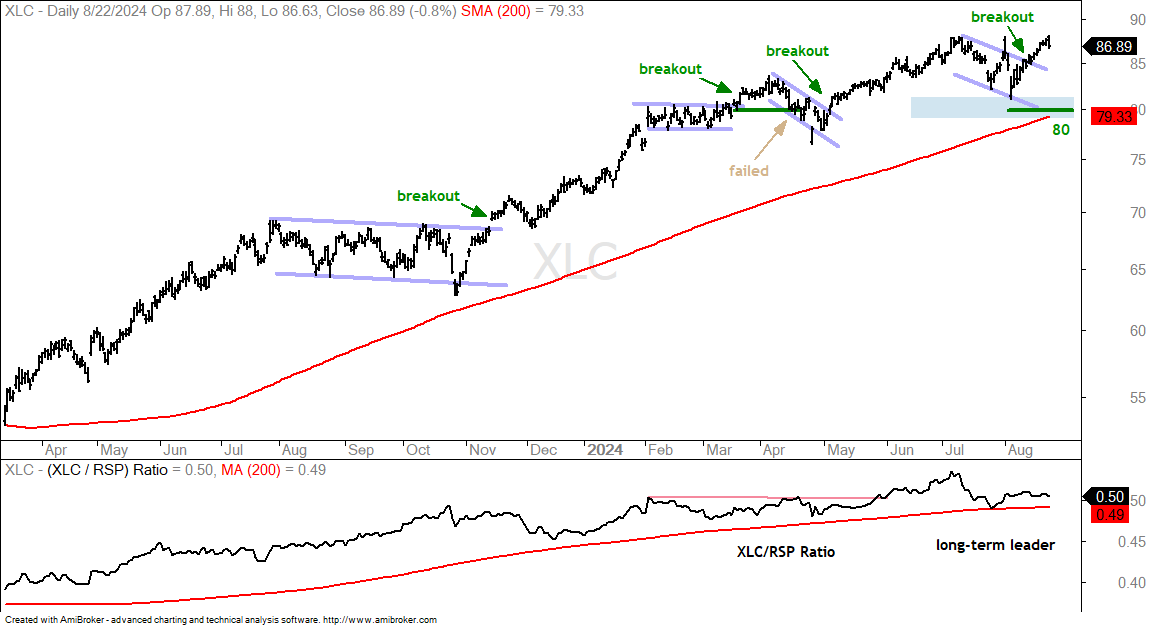
The next chart shows the Communication Services SPDR (XLC) in a steady uptrend since the November breakout. There were some short pullbacks along the way, but these did not last long as the ETF quickly moved back to new highs. The last pullback occurred from mid July and early August. Again, XLC quickly recovered and is back near a new high. I am marking long-term support at 80. META and GOOGL account for 45% of this ETF.
ITB Held the Breakout During the Air Pocket
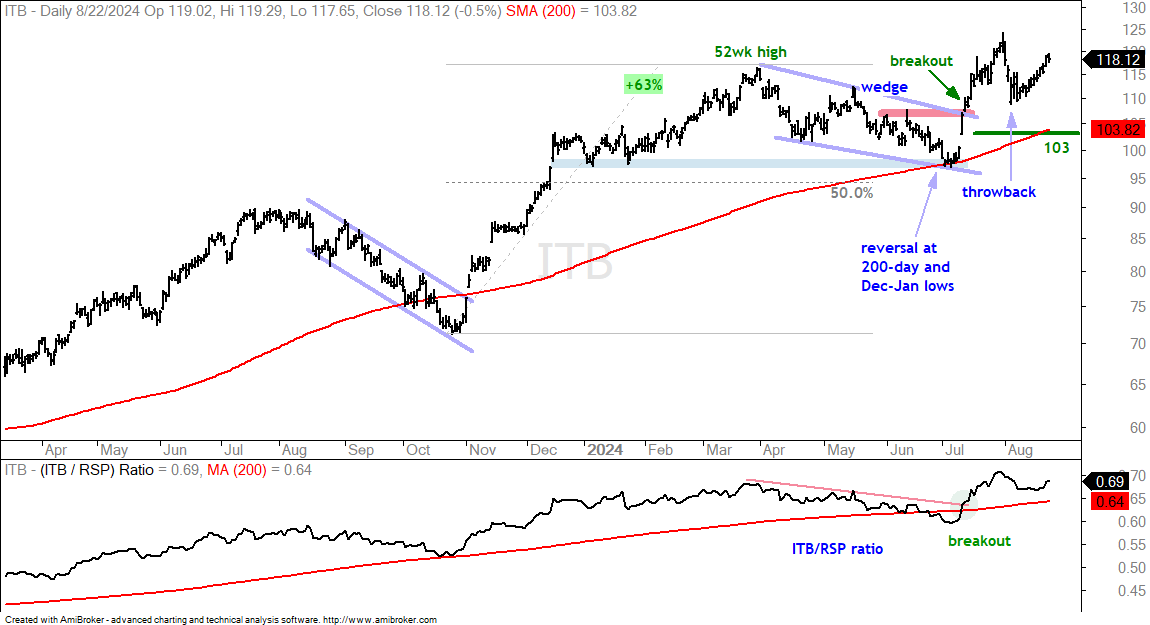
The next chart shows the Home Construction ETF (ITB) with a new high in March, a falling wedge correction into early July and a breakout in mid July. In contrast to some of the breakouts above, this breakout held during the early August air pocket. ITB fell back to the breakout zone (throwback), firmed for a few days and resumed its advance the last two weeks. This chart is bullish with the first re-evaluation level at 103.
FAN Challenges Wedge Resistance
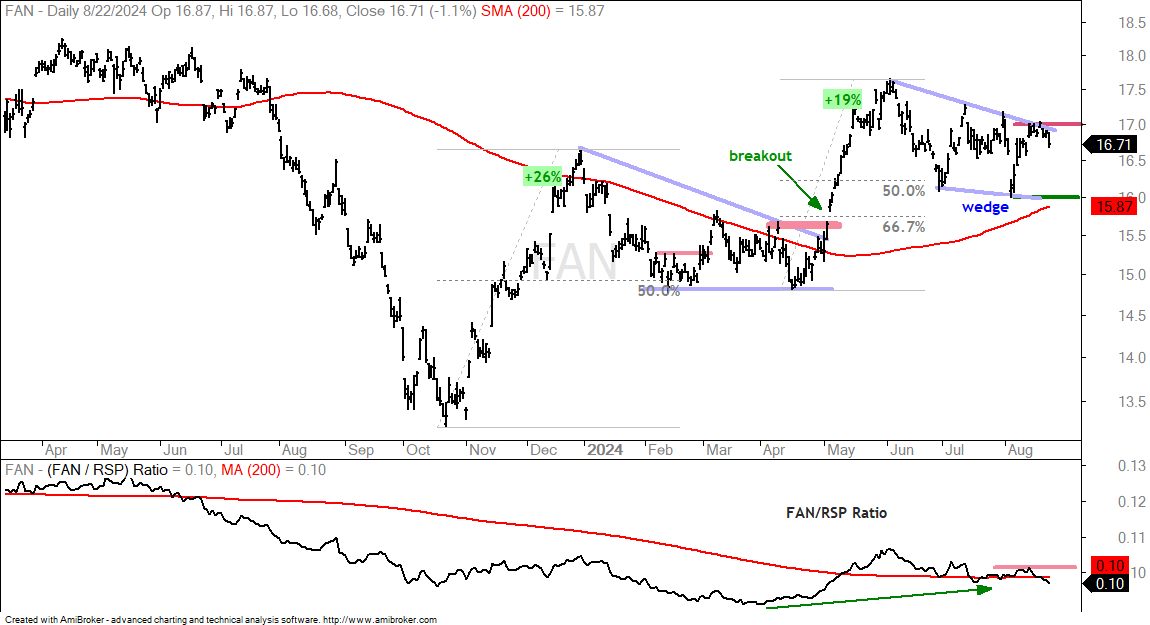
The next chart shows the Wind Energy ETF (FAN) trading above its 200-day SMA and the 200-day SMA turning up over the last two months. The ETF surged 19% and then corrected with a falling wedge. FAN also plunged with the market in early August and also recovered back to the mid July levels. FAN is near resistance and a breakout at 17 would be bullish. I would then mark re-evaluation support at 16.
NVDA Extends on Breakout
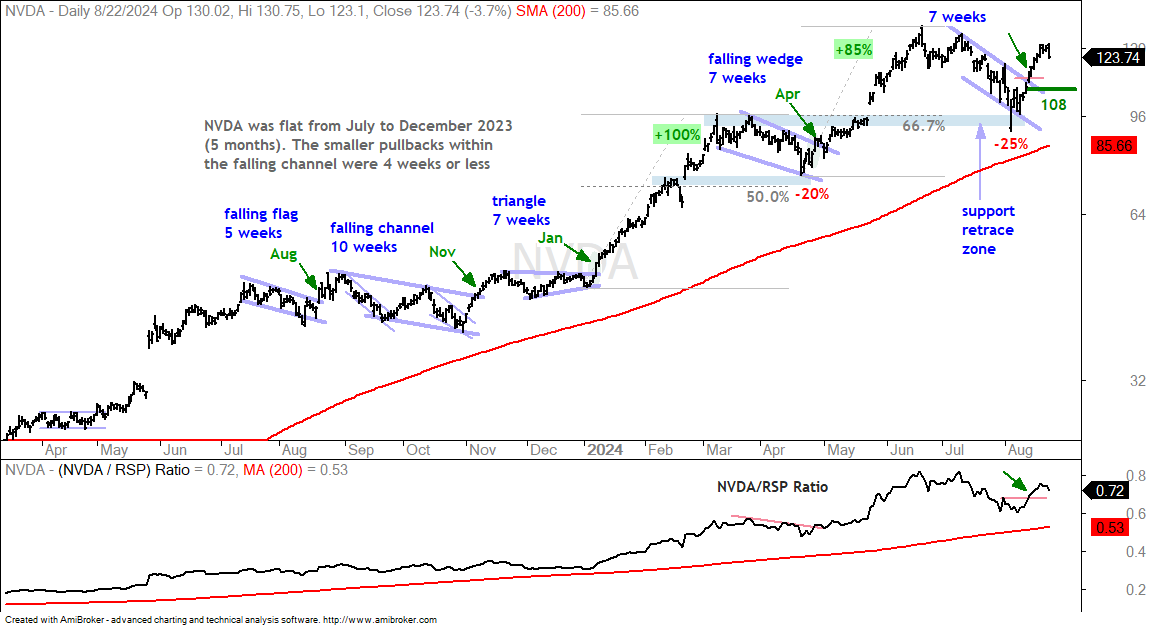
The chart below shows NVDA with characteristics similar to XLK and SOXX above. The stock hit a new high in June, corrected into early August and broke out with a surge off the August 5th low. Notice that NVDA hit a Support-Retracement Zone in the mid 90s in early August. The stock broke flag resistance at 113 and extended higher after this breakout. Short-term, I would mark a re-evaluation level at 108. A close below this level would negate the breakout. The indicator window shows the NVDA/RSP ratio turning up and breaking its late July high as NVDA returns to outperformance mode.
AVGO Breaks out of Falling Channel
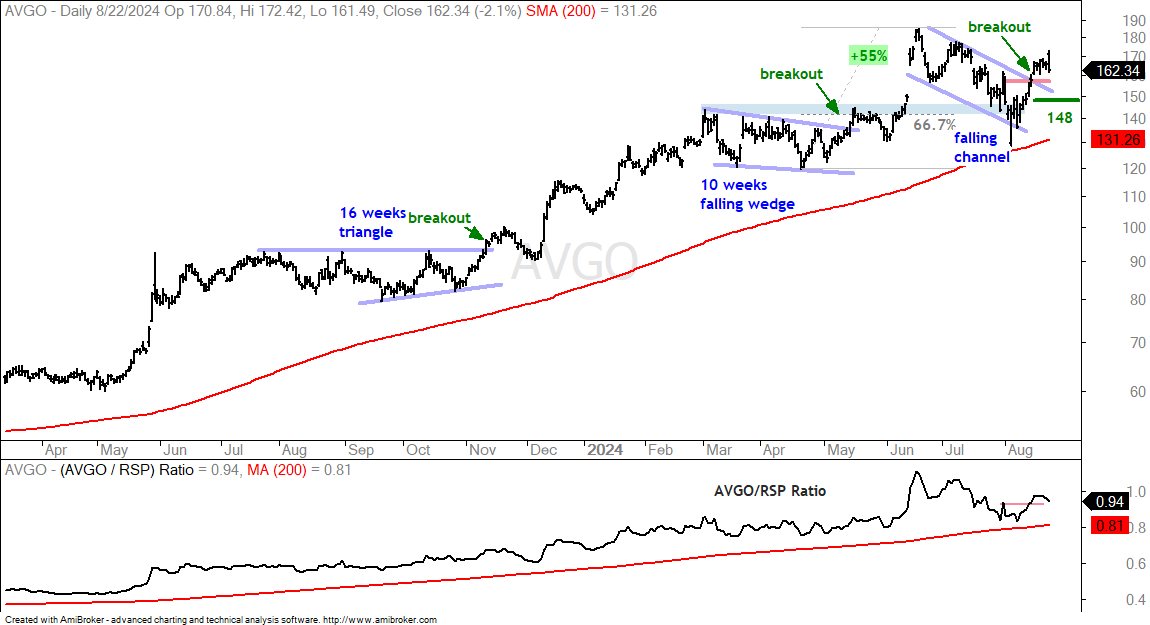
The chart below shows Broadcom (AVGO) with 55% gain into June and a new high. The stock then corrected with the rest of the semiconductor group as it fell back to the breakout zone in early August. A falling channel formed and this is typical for corrections within a bigger uptrend. AVGO broke out with a surge the last two weeks and this breakout is largely holding. I am marking my first re-evaluation level at 148. The indicator window shows the AVGO/RSP ratio turning up and breaking its late July high.
AMAT Surges Back above Rising 200-day
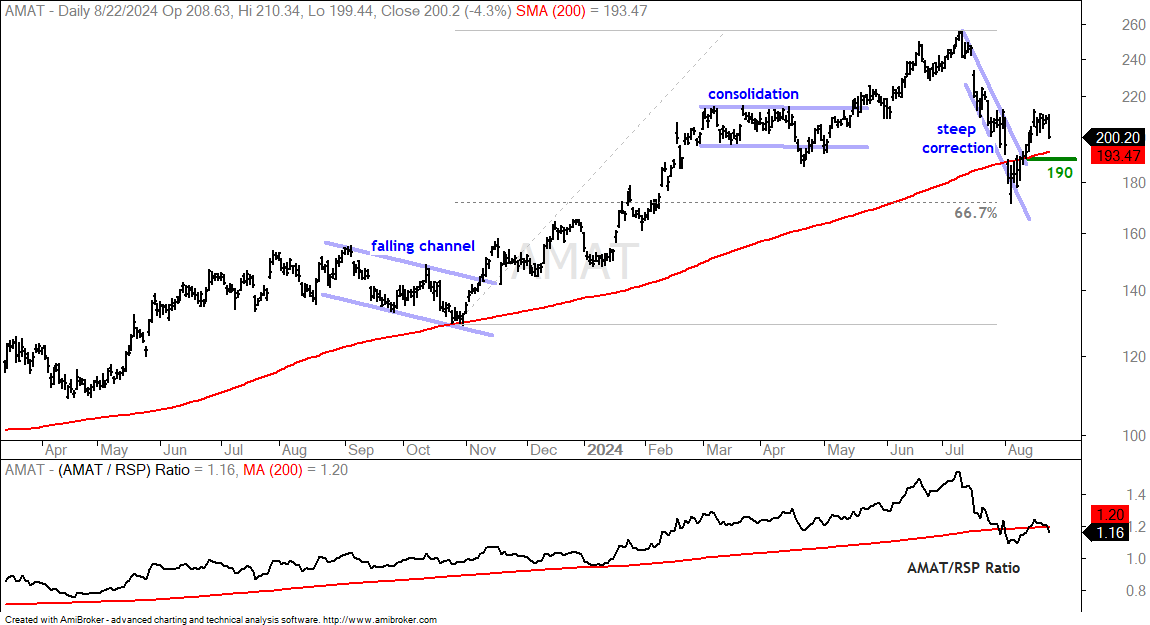
The next chart shows Applied Materials (AMAT) with a new high in mid July and a steep decline into early August. AMAT broke its 200-day SMA, but managed to reverse near the 66.7% retracement line. The stock broke out of the falling channel and reclaimed the rising 200-day SMA. These are both positive developments. I am marking my re-evaluation level at 190.
MSFT and GOOGL Reverse Near Support-Retracement Zones
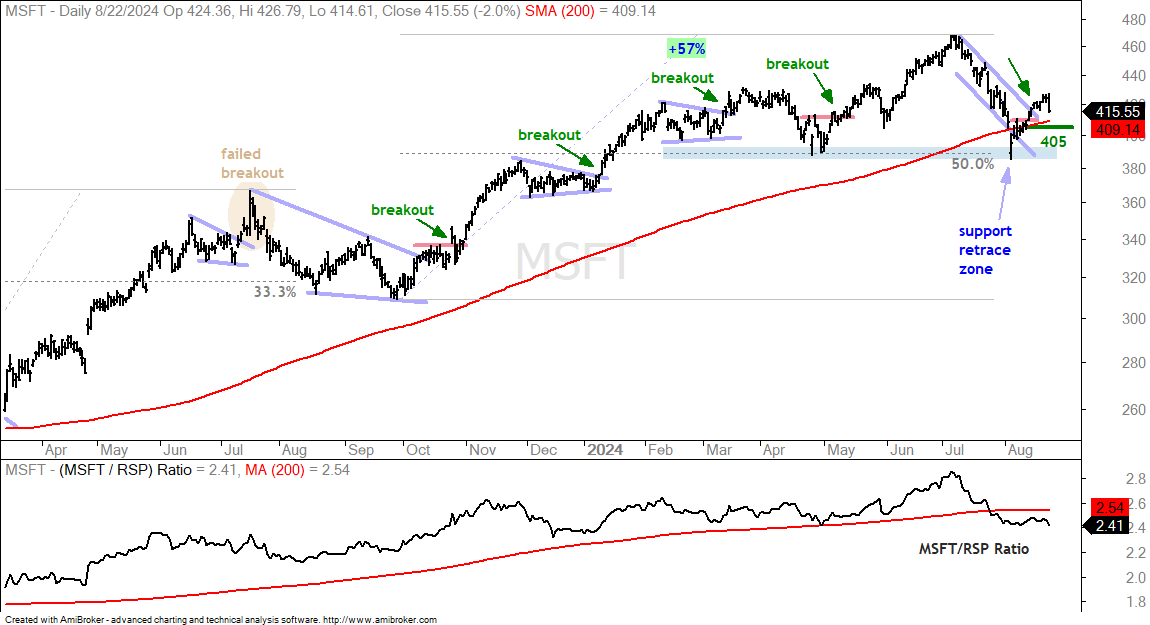
The next chart shows Microsoft (MSFT) bouncing off the Support-Retracement Zone in the 390 area. MSFT broke out of a falling flag/channel and this breakout is holding so far. MSFT is also back above the rising 200-day SMA. I am marking my re-evaluation level at 405.
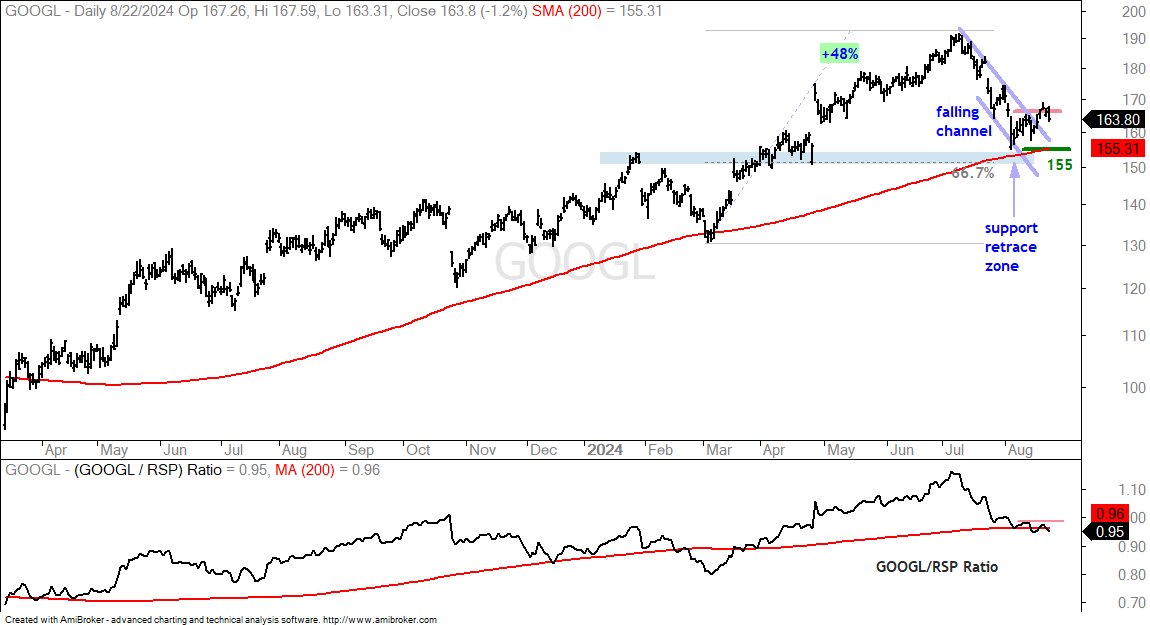
The next chart shows Alphabet (GOOGL) with a chart similar to MSFT above. GOOGL hit a Support-Retracement Zone with the early August low. A falling channel formed and the stock broke out with a close above 166 this week. I am using the 200-day SMA to mark my re-evaluation level at 155.