Video and Report Headlines
- Groups Leading the 10-day Surge
- ETFs Leading with New Highs
- Healthcare SPDR and Biotech ETF Bounce off Breakout Zones
- Illumina Turns the Corner
- Cardinal Health Surges off Support-Retracement Zone
- Incyte Reverses at Key Retracement
The next Chart Trader will be posted on Friday morning, August 23rd.
This report starts with the leaders over the last ten days and the leaders based on 52-week highs. Large-cap tech stocks led the 10-day surge, but Healthcare, Consumer Staples and Biotech are leading on charts. We then analyze the Healthcare SPDR, Biotech ETF and three Healthcare stocks (CAH, INCY, ILMN).
Large-cap Tech Stocks Lead the Bounce
Large-cap tech stocks led the surge off the early August low. QQQ, XLK and many of their cohorts surged over 10% in ten days. The Russell 2000 ETF (IWM) was up a paltry 6.43% as small-caps continue to lag large-caps. On a percentage basis, these are some of the leading groups with the biggest gains:
- S&P 500 SPDR (SPY) +8.16%
- Nasdaq 100 ETF (QQQ) +10.54%
- Technology SPDR (XLK) +13.72%
- Cloud Computing ETF (SKYY) +12.84%
- Cybersecurity ETF (CIBR) +12.46%
- Semiconductor ETF (SOXX) +15.75%
- Software ETF (IGV) +10.98%
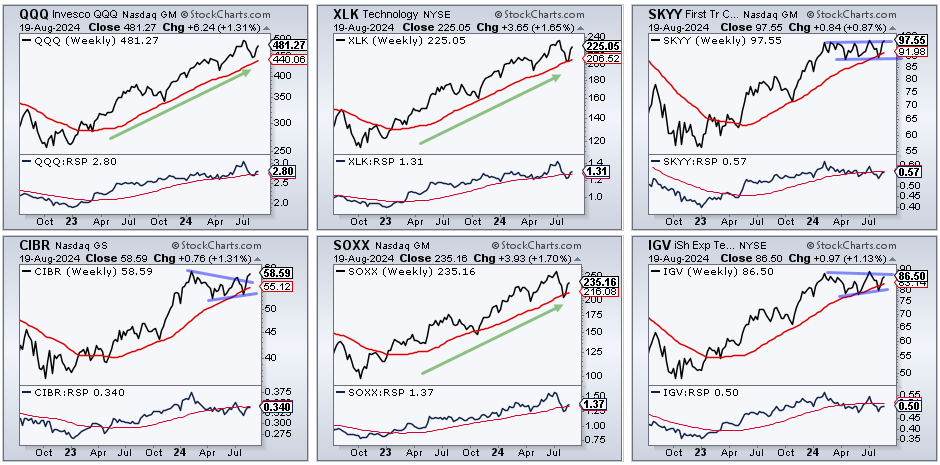
The list above shows that large-cap tech is alive and well. These groups corrected hard into July with many hitting their rising 200-day SMAs. They surged off these key moving averages to keep their long-term uptrends alive, and kicking. The chart below shows these six ETFs with their 200-day SMAs (red lines). SKYY, CIBR and IGV formed consolidations the last few months (blue lines). A consolidation after an advance is a bullish continuation pattern and breakouts would signal a continuation of the long-term uptrends. Note that I covered weekly charts for six tech-related ETFs last week Thursday. [7]
ETFs Leading with New Highs
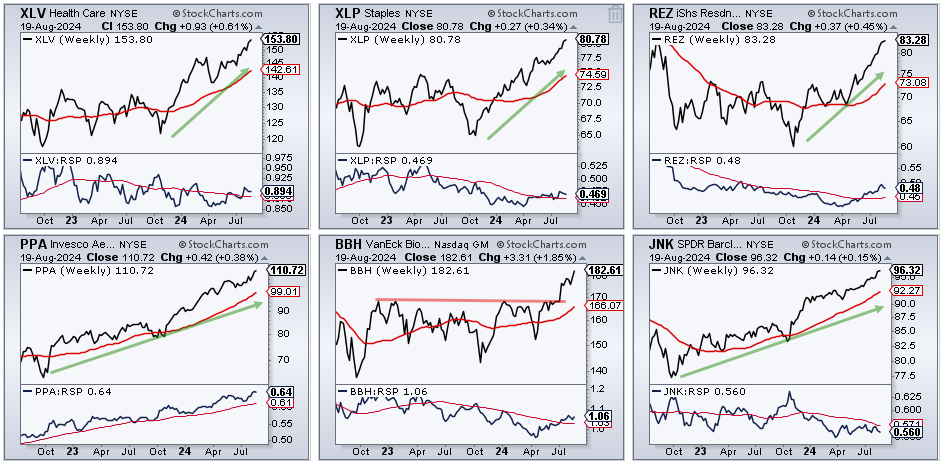
Even though tech and high-beta ETFs led the market in percentage terms, these ETFs have yet to hit new highs. Many, however, are close, The list below shows some ETFs that recorded new highs over the last five days. ETFs and stocks hitting new highs shows chart leadership. It is a rather interesting group, to say the least.
- Healthcare SPDR (XLV)
- Consumer Staples SPDR (XLP)
- Residential REIT ETF (REZ)
- Aerospace & Defense ETF (PPA)
- Biotech ETF (BBH)
- Junk Bond ETF (JNK)
Healthcare SPDR and Biotech ETF Bounce off Breakout Zones
The Healthcare SPDR (XLV) has been on my radar for a few months now. I featured XLV as it first broke resistance [8] in late July and again in mid August [7] as it continued to lead. Today I will show a weekly chart going back four years. XLV advanced into April 2022 and then embarked on a long consolidation. The 40-week SMA (red line) was not effective as the ETF oscillated around this long-term moving average. XLV broke out of this long consolidation with a surge from October 2023 to February 2024. This breakout led to an all time high. After a throwback in April and triangle consolidation into June, the ETF broke out again in July and hit new all time highs here in August.
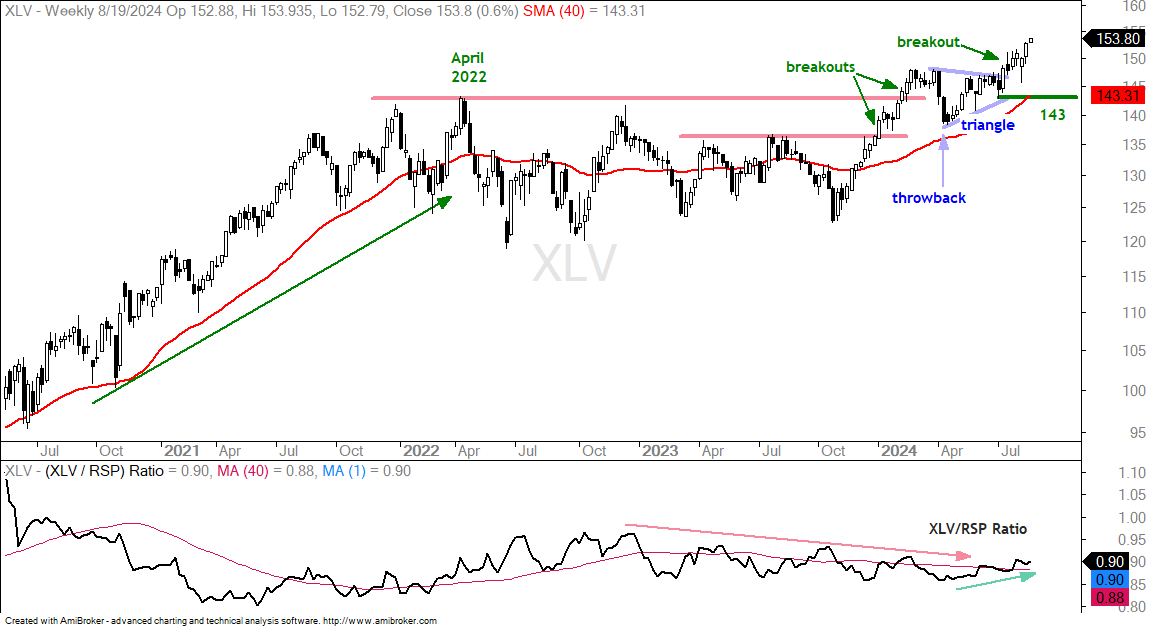
XLV is leading on the price charts and in a strong uptrend. I would use the July low and rising 40-week SMA mark re-evaluation support at 143. The indicator window shows the XLV/RSP ratio falling from January 2023 to March 2025 and turning up the last few months. XLV is starting to outperform again, but just barely.
The next chart shows the Biotech ETF (IBB) breaking out to new highs in July. IBB led the market lower from July 2022 to June 2023. It then embarked on a very choppy uptrend with several crosses of the 40-week SMA over the last 24 months. IBB finally broke free with a surge above the red resistance line and a multi-year high. IBB is still well below its 2021 highs, but the breakout is bullish and signals a long-term uptrend.
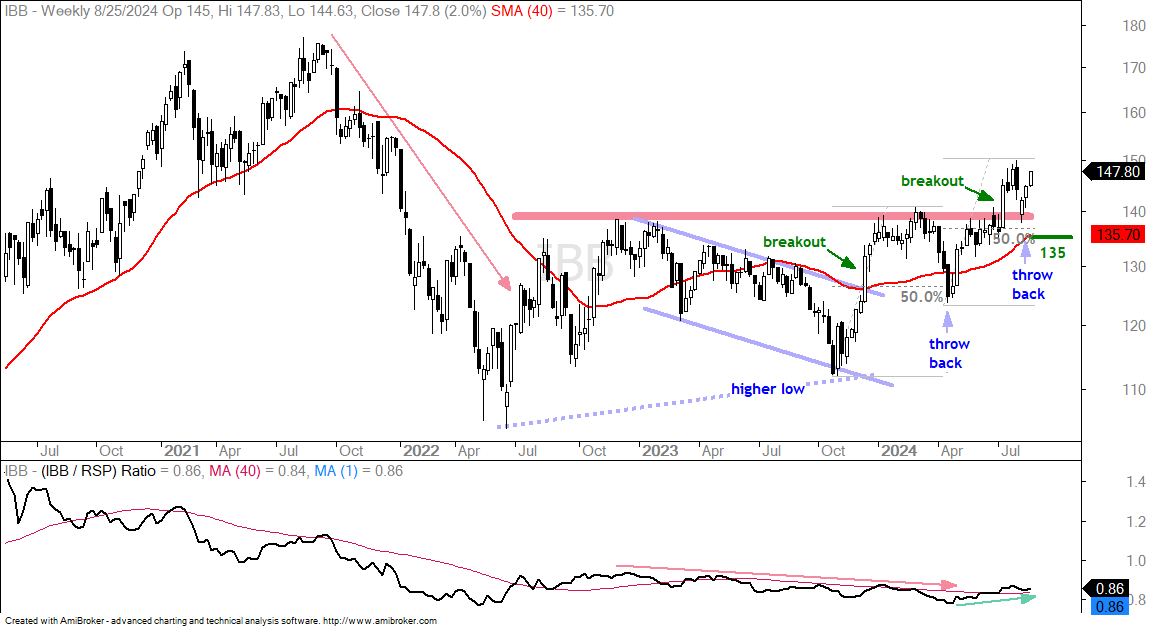
Looking at the last nine months, we can see a channel breakout in October and a throwback that retraced 50% in April. IBB surged from April to July and then fell back to the breakout zone with the early August low (Monday, August 5th). This throwback also retraced around 50%. Note that broken resistance turns support and the 137-140 area represented a Support-Retracement Zone. Chartists can use such zones to anticipate reversals. As with XLV above, I would use the July low and 40-week SMA to mark first support at 135.
Note that ChartTrader featured three Healthcare stocks last Thursday: Cencora (COR), Thermo Fisher (TMO) and Teleflex (TFX) [7]. I also featured Abbot Labs (ABT) and GE Healthcare (GEHC) [9] last week Tuesday.
Illumina Turns the Corner
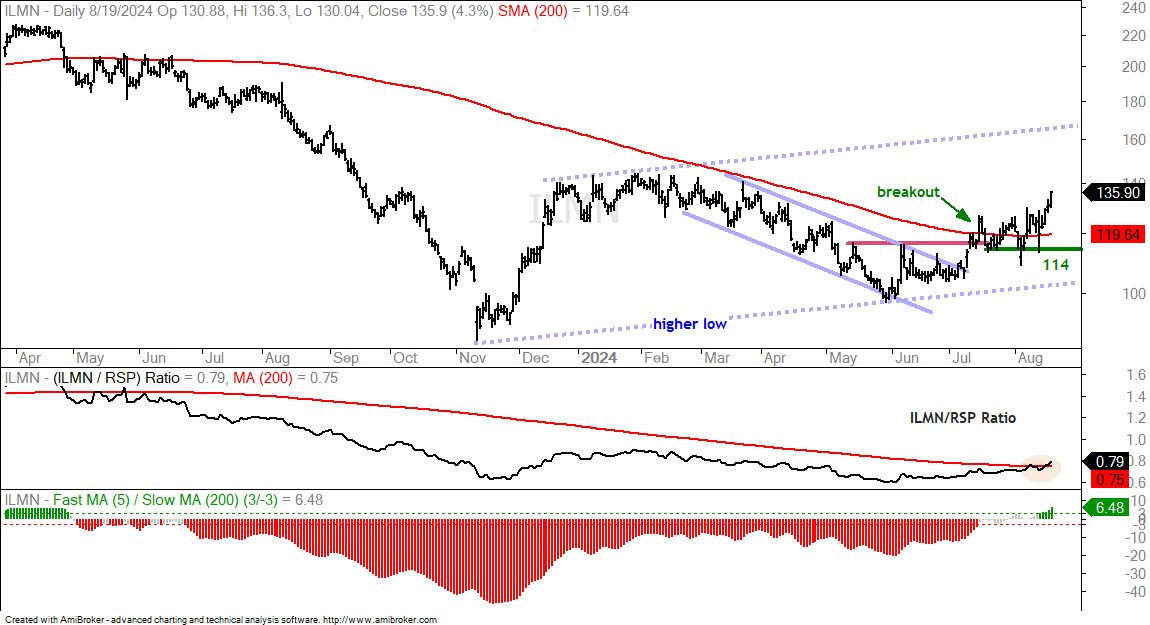
It has been a long time coming, but Illumina (ILMN) appears to be finally turning the corner and starting an uptrend. The chart below shows ILMN with a surge in November-December 2023 and then an extended decline into May 2024. ILMH held above the November 2023 low and formed a slightly higher low. A falling channel formed and the stock broke out with a surge in mid July. ILMN also exceeded the 200-day SMA, but this moving average turned into a battle line the last few weeks. ILMN is starting to distance itself from the 200-day and the 5-day SMA is now 6.45% above the 200-day SMA (bottom window). This the furthest since April 2023. Should a rising channel take shape, the upper trendline extends to the 160s and this is the first target. The closing lows from mid July and August mark re-evaluation support at 114.
Cardinal Health Surges off Support-Retracement Zone
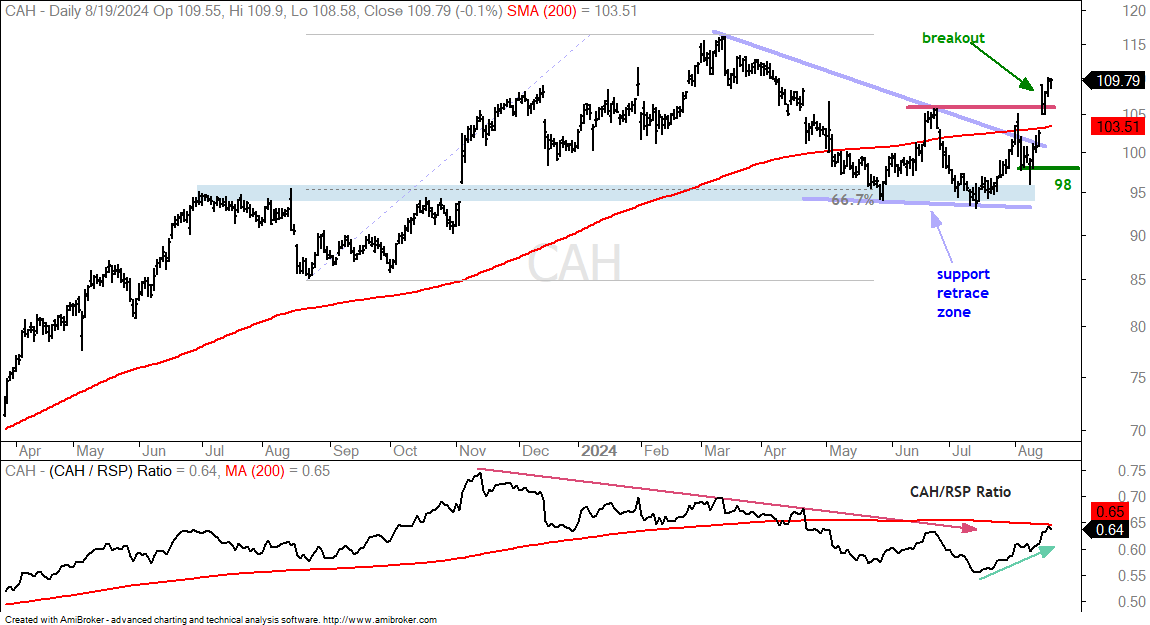
The next chart shows Cardinal Health (CAH), which distributes medical products. The stock hit a new high at 116 in March and then fell back to the 95 area. Even though CAH broke the 200-day SMA, this decline was a correction within a bigger uptrend. There are three hallmarks for tradable pullbacks. First, the decline retraces 33 to 67 percent of the prior advance. Second, the decline returns to a prior breakout zone. Third, a corrective pattern forms, such as a falling wedge or channel. CAH retraced 67% with a falling wedge that returned to the November breakout. The blue shading marks the Support-Retracement Zone, which is an area to watch for a reversal. The stock tested this level in May and July, and then broke out after earnings on August 14th. This breakout is long-term bullish and targets a move to new highs. I would re-evaluate on close a below 98.
Incyte Reverses at Key Retracement
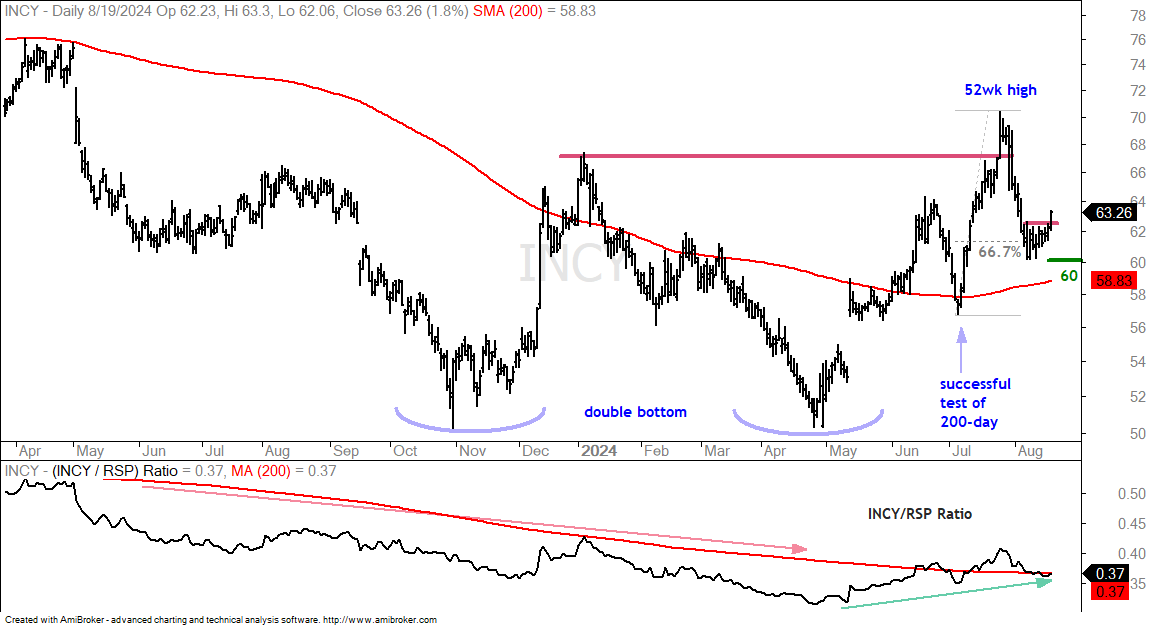
Incyte (INCY) is a biotech stock with above average volatility and risk. The chart shows big swings as the stock surged from 50 to 68 (Oct to Dec), fell back to 50 (Jan-Apr) and surged back to 68 (May-Jul). A double bottom formed from October to April and the stock managed to exceed the intermittent high. In fact, INCY recorded a 52-week high in July. The stock fell back after this high as it retraced 67% of the July surge. INCY firmed for a week or so and broke short-term resistance with a pop on Monday. This is short-term bullish. Volatile stocks need wide re-evaluation levels and I would re-evaluate on a close below 60.