The next Chart Trader will be posted on Tuesday morning, August 20th.
Defensive Sectors Lead in August
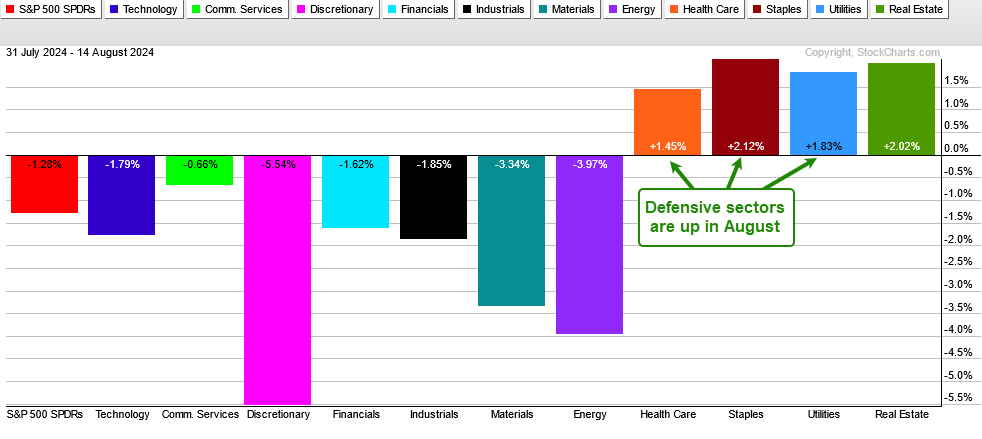
This report starts with the Healthcare SPDR because it is one of the leading sectors right now. Also notice that the Consumer Staples SPDR, Utilities SPDR and Real Estate SPDR are also leading with new highs this week. Leadership from the defensive sectors points to some risk aversion in the markets. We will then show three healthcare stocks with breakouts working. Attention then turns to the tech sector. Google and Microsoft are battling their rising 200-day SMAs and six key tech ETFs are battling their rising 40-week SMAs. It is important that these hold.
XLV Leads With a New High
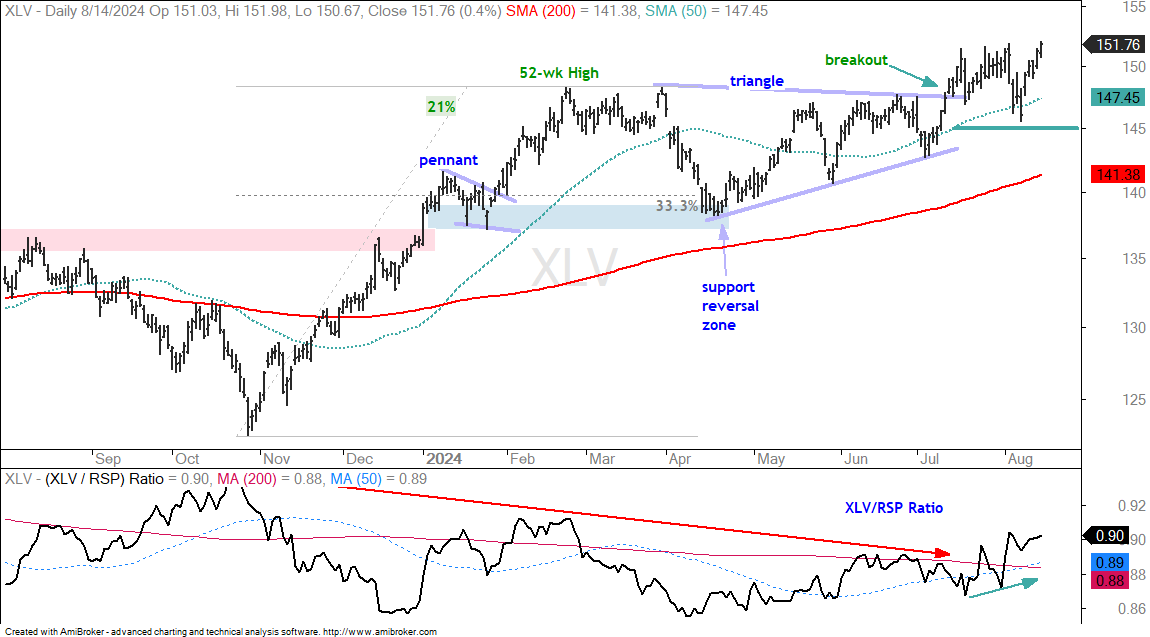
There are six big sectors within the S&P 500 and the Healthcare SPDR (XLV) is the leader. The other big sectors include the Technology SPDR (XLK), Communication Services SPDR (XLC), Industrials SPDR (XLI), Finance SPDR (XLF) and Consumer Discretionary SPDR (XLY). XLV is the only one to record a new high this week. The chart below shows XLV with a 21% advance, a triangle consolidation and a breakout in mid July. The ETF battled the breakout zone for a few weeks, but is back up and the breakout is holding. Re-evaluation support is set at 145. The indicator window shows the price-relative (XLV/RSP ratio) turning up in mid July as XLV shows some relative strength.
COR, TFX and TMO Get Breakouts
The next charts show three healthcare stocks with breakouts working. Note that these are relatively long-term patterns and breakouts. All three advanced into March and then corrected into July. TMO and COR formed sideways consolidations and broke out. TFX corrected with a rather deep falling wedge and broke out with a surge the last six weeks. All three are showing relative strength off the July lows.
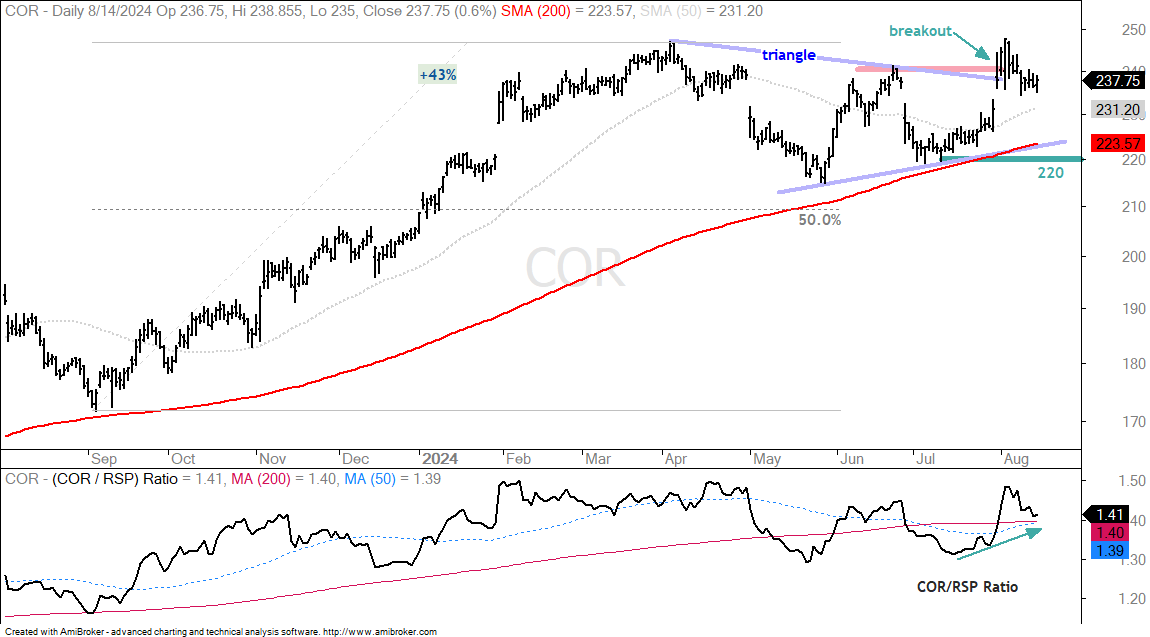
The first chart shows Cencora (COR) with 43% advance to new highs, a triangle consolidation and a breakout in early August. Notice that COR held the rising 200-day SMA with the triangle lows. Triangles within uptrends are bullish continuation patterns and the breakout signals a continuation of the bigger uptrend. COR fell back after the breakout, but a pullback after a surge from 220 to 250 is normal. The July lows mark re-evaluation support at 220.
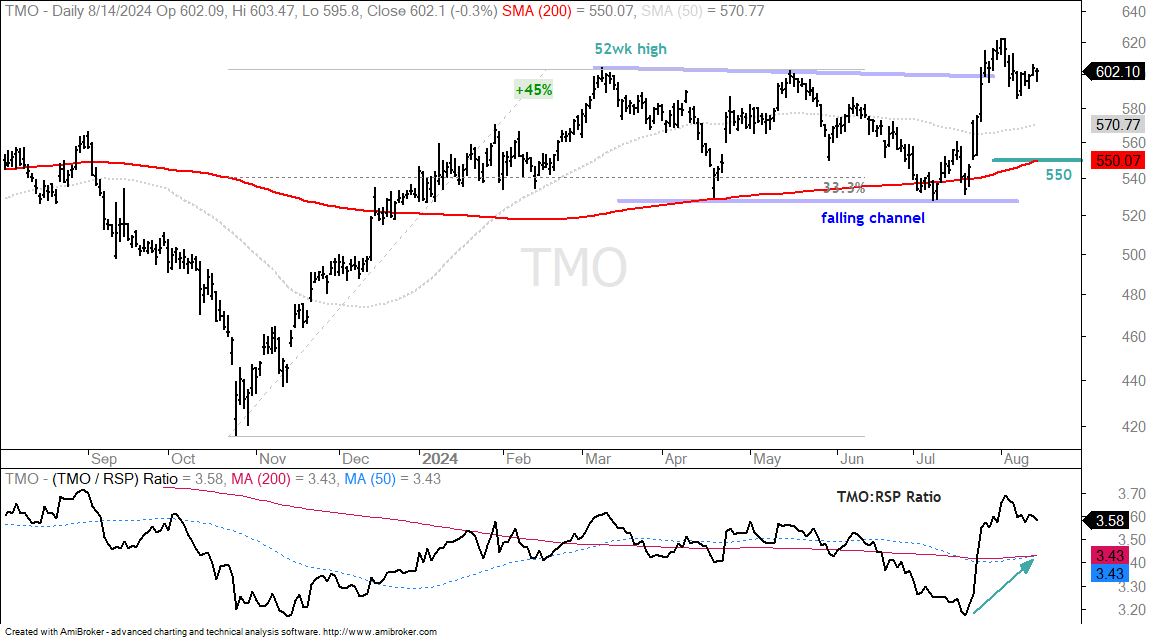
The next chart shows Thermo Fisher (TMO) advancing 45% to new highs and then consolidating with a falling channel into July. TMO successfully tested the 200-day SMA in April, June and July. The late July surge propelled TMO to a new high and triggered a breakout. TMO is currently consolidating around the breakout zone. Re-evaluation support is set at 550.
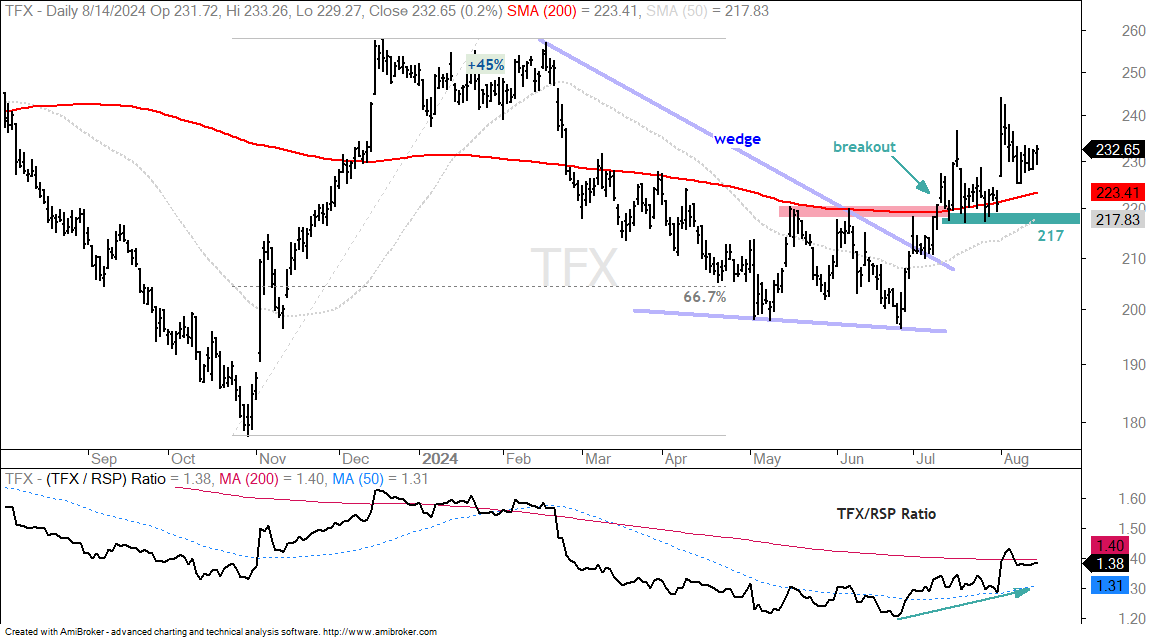
The next chart shows Teleflex (TFX) with a 45% advance and steep decline that retraced 2/3 (66.7%). TFX broke the 200-day SMA in the process, but managed to firm near the key retracement and establish support around 200. The stock broke out with a big move in July and the breakout held. Also notice that TFX broke the 200-day SMA and this moving average turned into support. I view this breakout as bullish and will mark re-evaluation support at 217.
GOOGL Hits Support-Retracement Zone
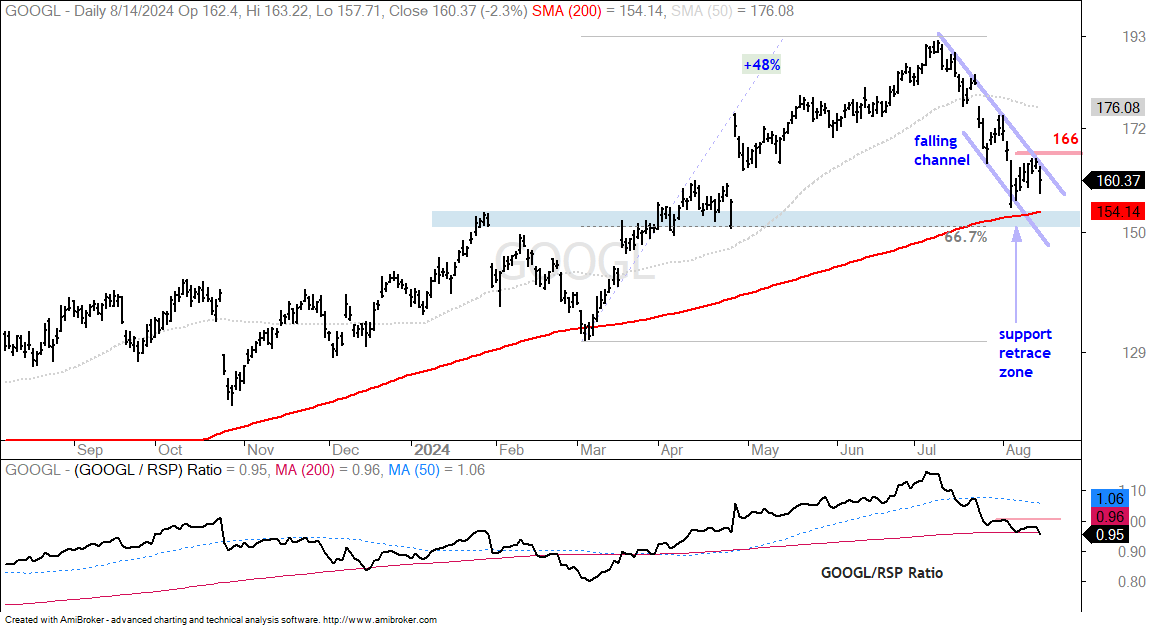
Google (GOOGL) hit a Support-Retracement Zone that could give way to a bounce and short-term trend reversal. The chart below shows GOOGL hitting a new high after a 48% advance into July. GOOGL then fell back to the rising 200-day SMA in early August. The blue shading marks the Support-Retracement Zone in the low 150s. I am using broken resistance, the April lows, the 200-day SMA and the 67% retracement to mark this zone. A falling channel formed with short-term resistance set at 166. A breakout here would reverse the short-term downtrend. I would then set re-evaluation support at 157.
MSFT Bounces off Support
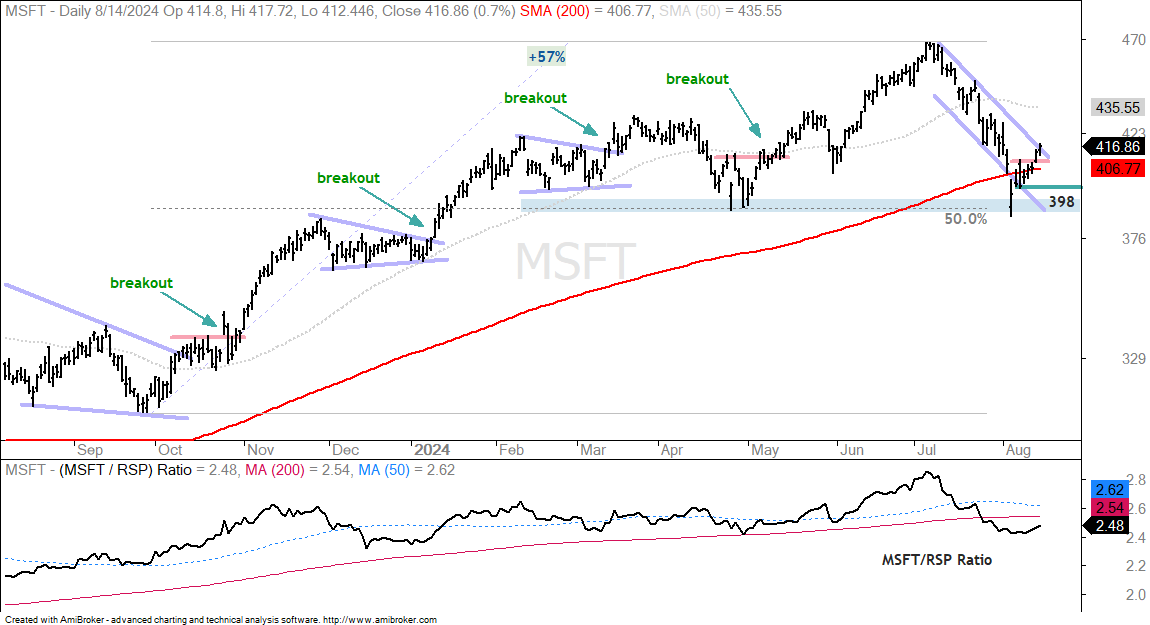
The next chart shows Microsoft (MSFT) with a new high in July and a decline to the rising 200-day SMA. MSFT actually broke the 200-day in early August, but rebounded back above this key moving average the last few days. Keep in mind that the 200-day SMA represents a battle zone and prices can oscillate around this key moving average as bulls and bears slug it out. Even though MSFT broke the 200-day, it bounced off a Support-Retracement Zone in the 390 area. I am using the April low and the 50% retracement to mark this zone. A falling channel formed as MSFT fell to this zone and the stock broke above last week’s high (red line). This breakout looks short-term bullish and I would mark re-evaluation support at 398.
Tech ETFs Battle 40-week SMAs
There are hundreds of tech-related ETFs, but we do not need to follow them all. In fact, most of my attention is on six:
Technology SPDR (XLK)
Semiconductor ETF (SOXX)
Software ETF (IGV)
Cybersecurity ETF (CIBR)
Cloud Computing ETF (SKYY)
FinTech ETF (FINX)
These six cover the Technology sector as a whole and the major sub-sets. I would also consider adding these three for good measure:
Mag7 ETF (MAGS)
Robotics & Artificial Intelligence ETF (BOTZ)
Connectivity ETF (SIXG)
Volatility reared its ugly head over the last three weeks as stocks fell sharply to begin the month, opened significantly lower on August 5th and then bounced over the last seven days. These bounces prevented a long-term trend reversal in many stocks and ETFs. In fact, the six tech ETFs on the list above held their rising 40-week SMAs. It is important that these moving averages hold. It would be negative if this bounce fails and the majority break their long-term moving averages.
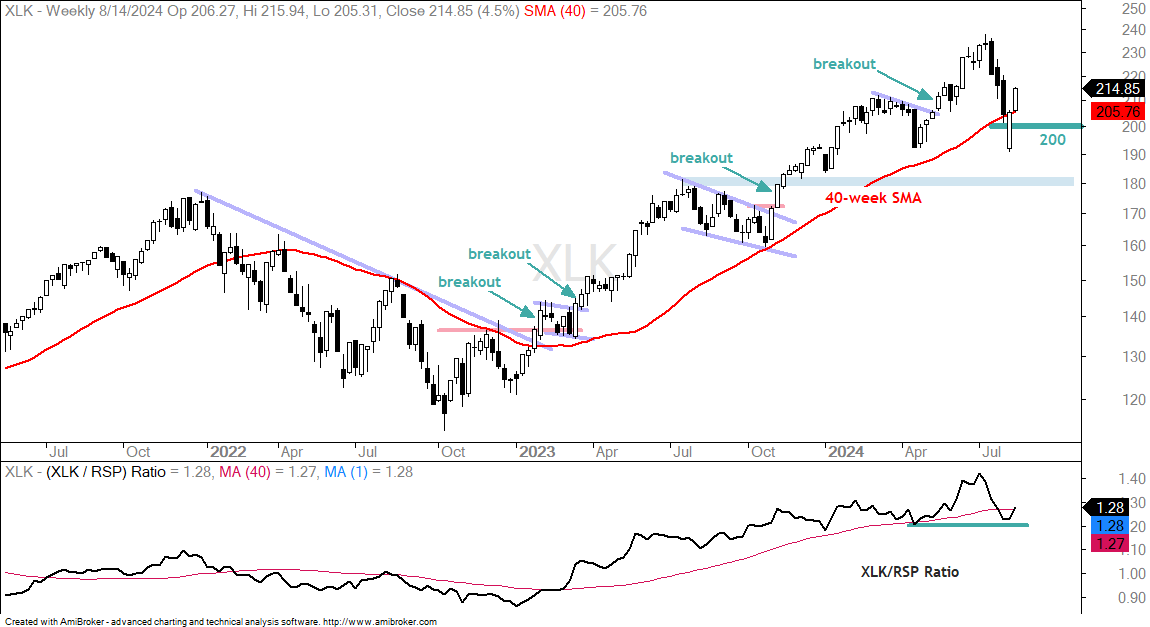
The chart below shows XLK hitting a new high in July and then falling sharply with three long black candlesticks. XLK closed near its 40-week SMA three weeks ago with a long black candlestick and then formed a long white candlestick that recaptured this moving average. XLK followed through with a 4.5% gain so far this week. This move affirms the 40-week SMA as a support level. The long-term trend is still up with the 40-week marking first support. Adding a buffer to this moving average, a weekly close below 200 would be negative.
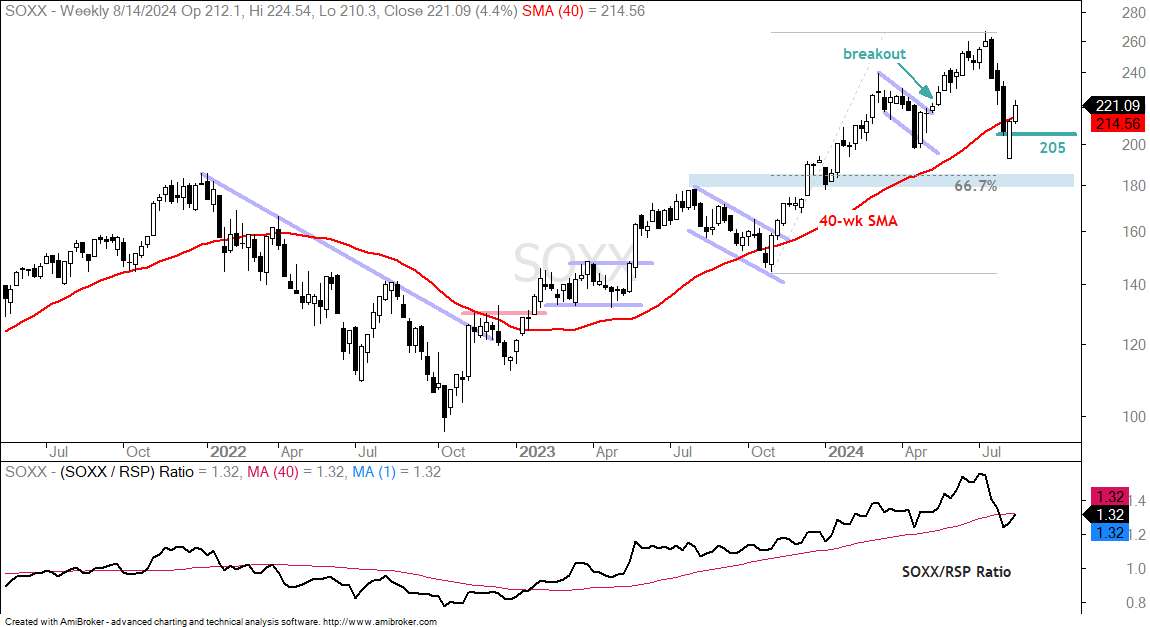
The next chart shows SOXX breaking its 40-week SMA three weeks ago and moving back above this week. This first test is proving successful. A close below 205 would break the 40-wk SMA again and I would then target a move toward the 180 area. Broken resistance and the 67% retracement line mark a Support-Retracement Zone here.
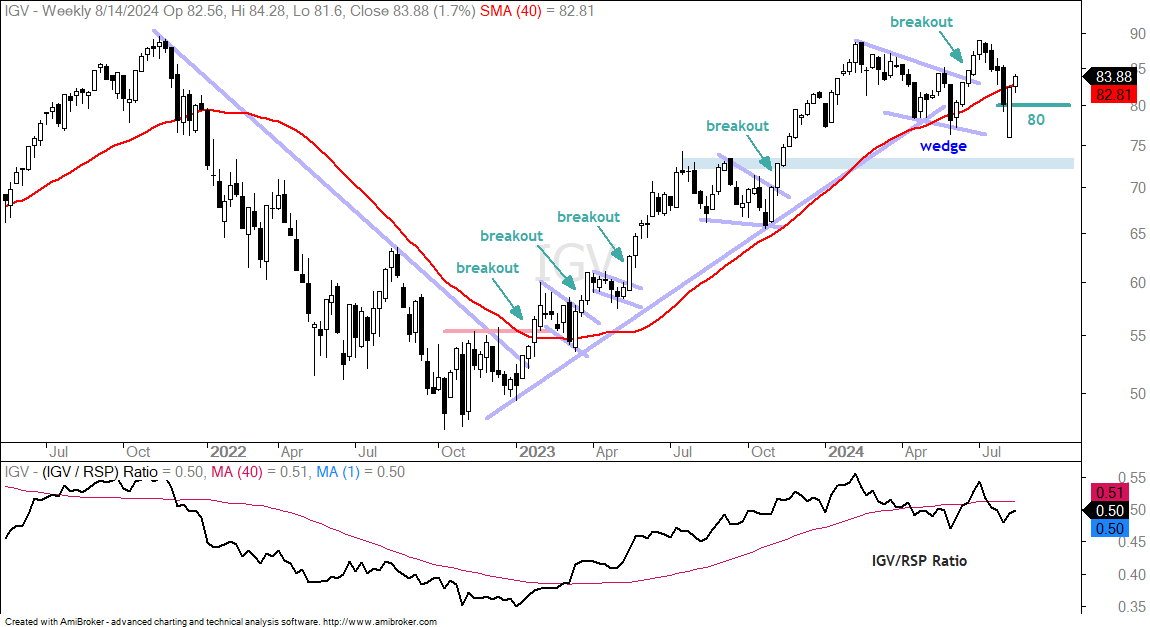
The next chart shows the Software ETF (IGV) with a wedge breakout in late June and a hard pullback in July-August. A pullback is normal after a breakout and a sharp five-week advance (+13%). This normal pullback turned ugly with the sharp decline into early August and the August 5th open at 76. IGV broke the 40-week SMA, but quickly recovered and moved back above this week. Adding a buffer, I would mark first support at 80. A close below this level would be negative and argue for a move to the low 70s.
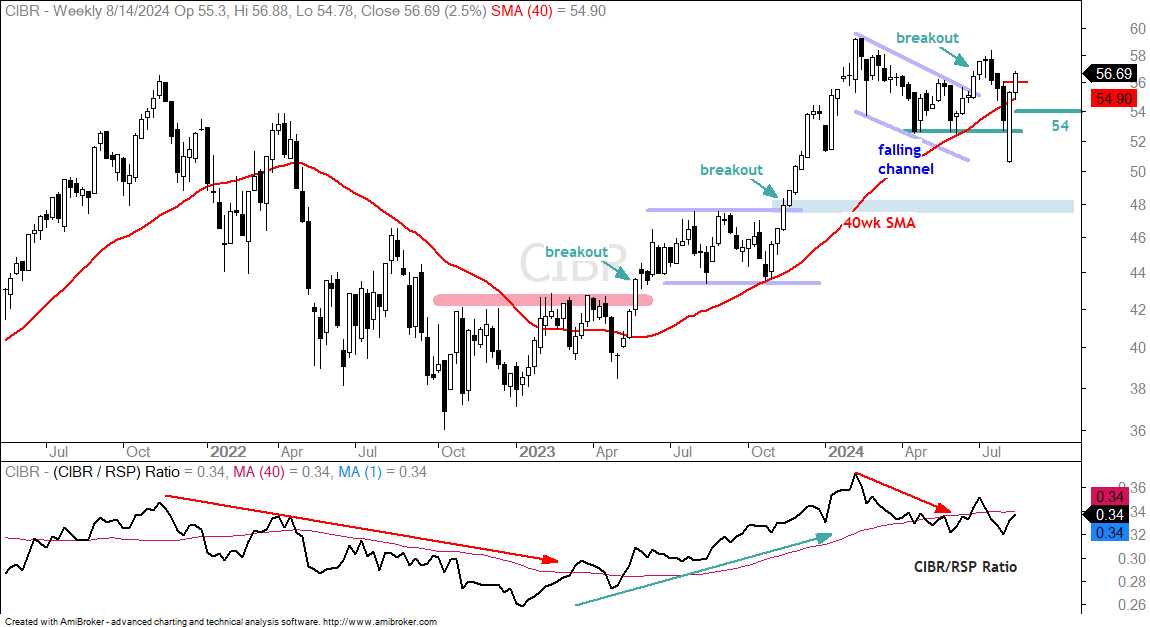
The next chart shows the Cybersecurity ETF (CIBR) with a leading bounce the last two weeks. CIBR is the only one of the six trading above its late July high (red line). As with IGV above, CIBR broke out in late June and held this breakout for a few weeks. It then fell with the rest of the market in early August and opened below the April-June lows (52) on August 5th. It then closed week above 54 and moved above 56 this week. Overall, I think the falling channel breakout is back on with support marked a 54. A break here would be negative.
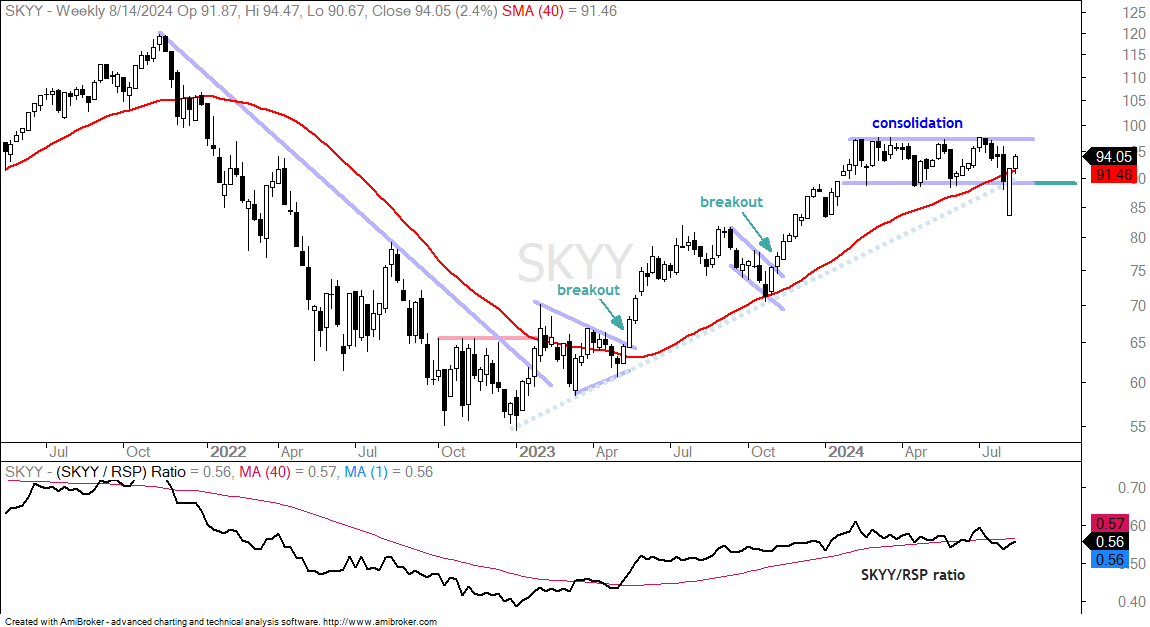
The next chart shows the Cloud Computing ETF (SKYY) hitting a new high in February 2024 and then consolidating the last six months. SKYY briefly broke consolidation support and the 200-day SMA last week, but recovered by the end of the week and bounced this week. Again, the rising 40-week SMA (red line) is in play, and holding so far. The consolidation lows mark support and a weekly close below 90 would be negative.
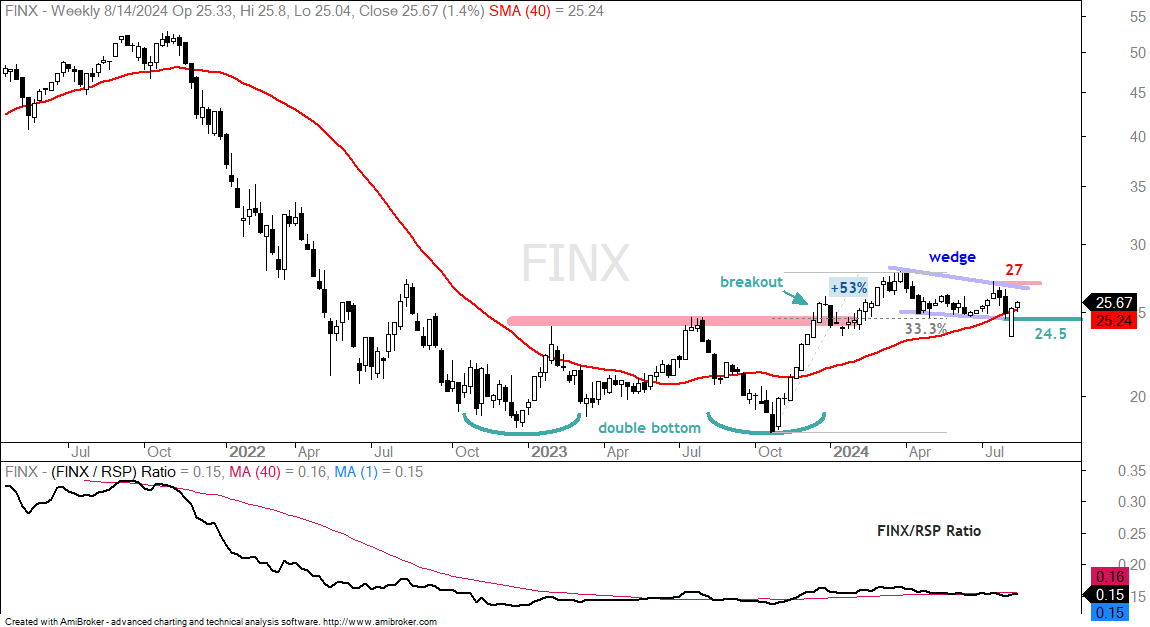
The next chart shows the FinTech ETF (FINX) with an extended double bottom and a breakout in December 2023. FINX extended on this breakout with further gains into early April and then embarked on a corrective period. A falling wedge retraced around a third of the 53% advance and returned to the breakout zone, which turns into support. Thus, FINX hit a Support-Retracement Zone in May and turned up in June. This upturn did not hold as the ETF fell back in early August. Nevertheless, the falling wedge remains and a breakout at 27 would be bullish. I am marking support at 24.5 and a break here would be negative.