The next Chart Trader will be posted on Tuesday morning, June 14th.
Still a Large-cap Tech World
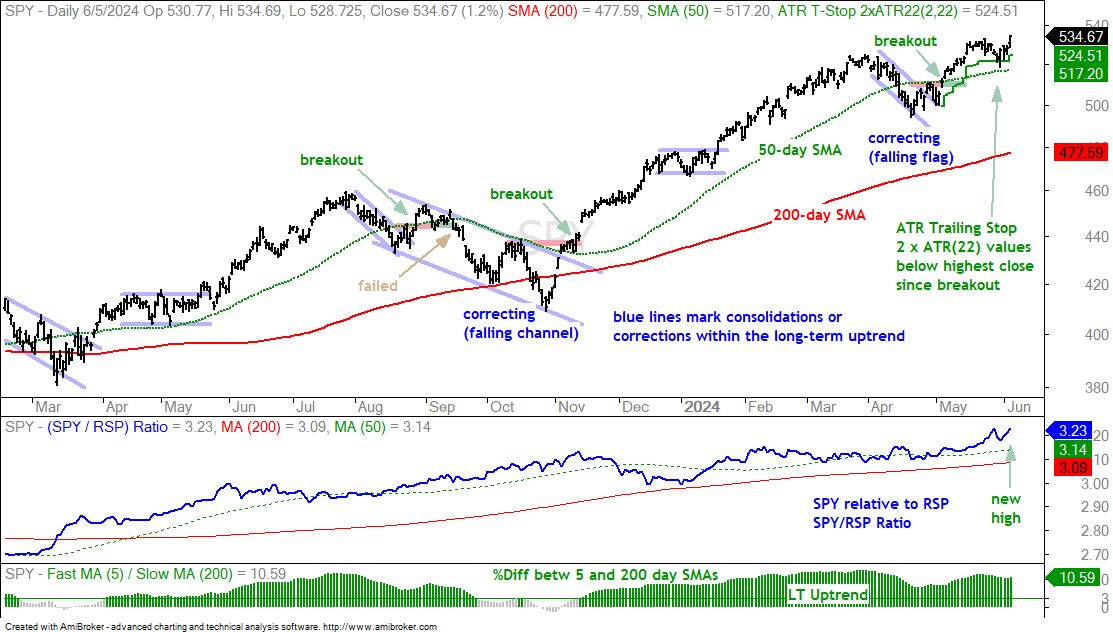
SPY and QQQ surged to new highs on Wednesday and continue to lead the market. Note that SPY and QQQ were the only major index ETFs to hit new highs this week. The S&P SmallCap 600 SPDR (IJR) tagged a new high in May, but RSP, MDY and IWM remain below their March highs. The Communication Services SPDR (XLC) was the only sector SPDR to hit a new high on Wednesday. The Technology SPDR (XLK), however, is very close to a new high. Overall, large-cap techs continue to power the market higher. The chart below shows SPY with a flag breakout on May 3rd and an extension higher. A bearish engulfing formed on May 23rd, but this did not lead to a sizable pullback. SPY held the 50-day SMA and the ATR Trailing Stop last week, and then resumed its advance this week. With the new high, the ATR Trailing Stop rose to 524.51 on Wednesday.
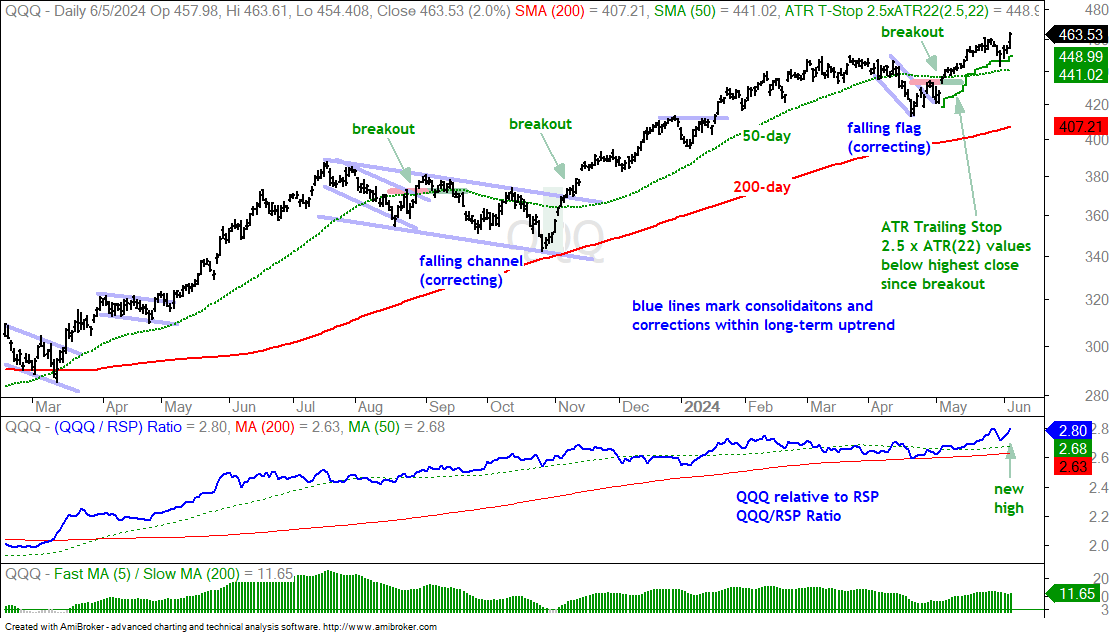
The next chart shows QQQ surging 1.6% and hitting a new high. The overall chart remains the same: QQQ broke out on May 3rd and extended higher. The bearish engulfing on May 23rd did not derail this upswing and the 50-day SMA held. With a higher high, the ATR Trailing Stop rose to 448.99 on Wednesday. The middle window shows the QQQ/RSP Ratio hitting a new high, which means QQQ is leading the S&P 500 EW ETF (RSP).
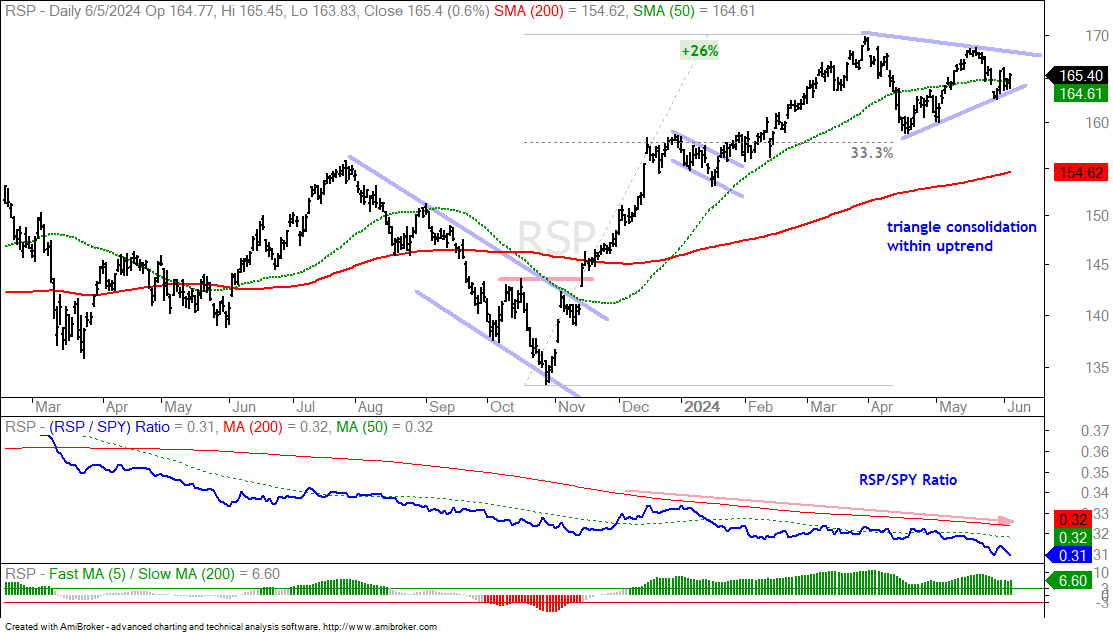
The next chart shows the S&P 500 EW ETF (RSP) for comparison. The ETF hit a 52-week low in October, surged some 26% and hit a new high in March. It then consolidated with a triangle taking shape. RSP is underperforming SPY and QQQ because it formed a lower high from March to May. Nevertheless, the long-term trend is up and the triangle is viewed as a consolidation within this uptrend. This makes it a bullish continuation pattern. A breakout would signal a continuation of the uptrend and suggest that the market advance is broadening. The middle window shows the RSP/SPY ratio in a long-term downtrend because RSP cannot keep pace with SPY.
Chart Analysis, Setups and Trading Ideas
The following charts show price bars with the 200-day SMA (red line), the 50-day SMA (green line), the price-relative (ITB/RSP ratio) with the 200-day SMA and the percentage difference between the 5 and 200 day SMAs. On the price chart, I am looking for tradable pullbacks within a bigger uptrend or bullish consolidation patterns. With the price-relative, I am looking for relative strength. The price-relative (ITB/RSP ratio) rises when the ETF or stock outperforms. And finally, the percentage difference between the 5 and 200 day SMA is bullish (long-term uptrend) with a move above 3% and stays bullish until a move below -3%. This basically measures the tide or long-term bias.
IWM Forms Cup-with-handle
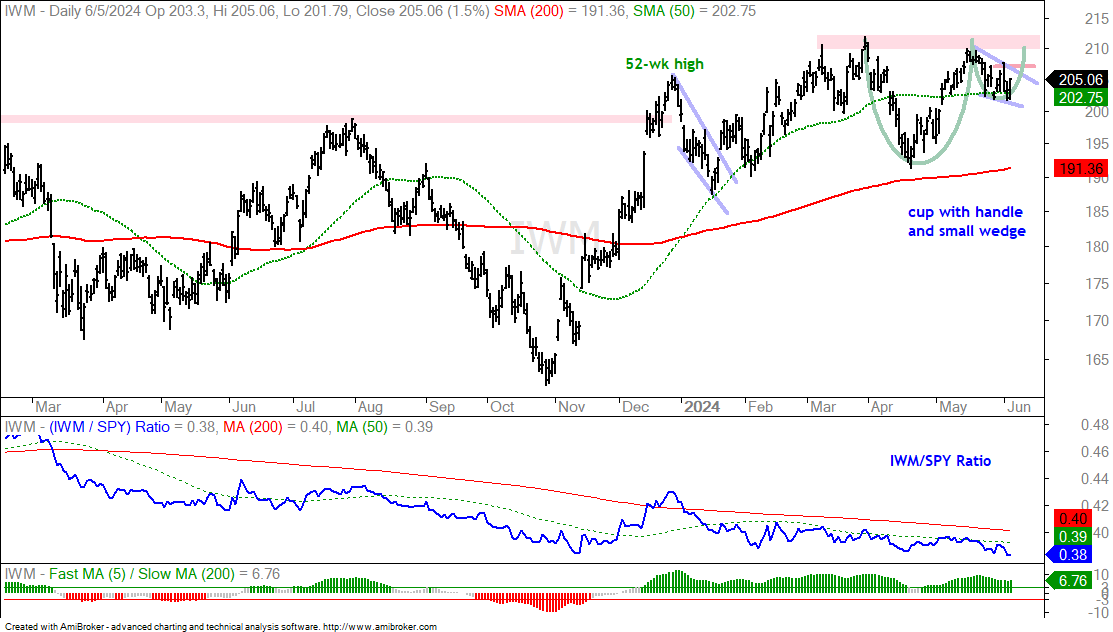
The next chart shows the Russell 2000 ETF (IWM) forming a cup-with-handle pattern and a small wedge. The cup-with-handle is a bullish continuation pattern and a break above rim resistance would be bullish. A small falling wedge formed as the handle takes shape and a breakout at 207 would be short-term bullish. This would increase the odds of a bigger breakout and new high. Should IWM break out at 207, I would mark an initial re-evaluation level at 202.
TLT Breaks Out as 10yr Yield Falls
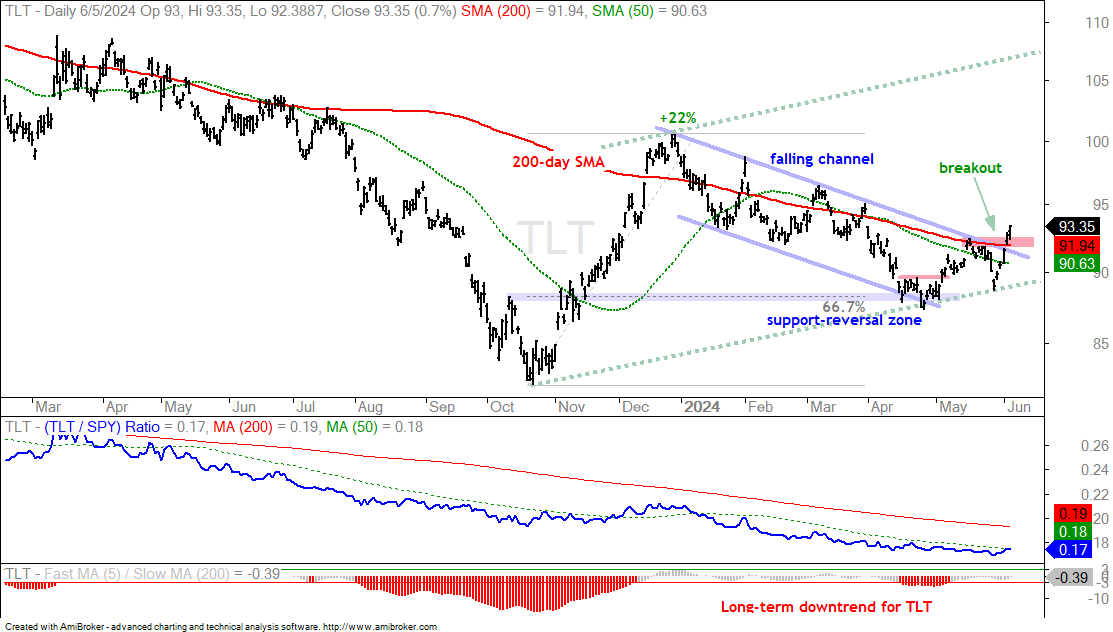
TLT failed at its falling 200-day SMA in mid May, but forged a sharp reversal over the last two weeks and broke out. Overall, the ETF advanced 22% into December and then retraced 66.7% with a falling channel. This is deemed a correction after the big advance. TLT broke resistance with a big surge this week and this targets a move toward the spring 2023 highs.
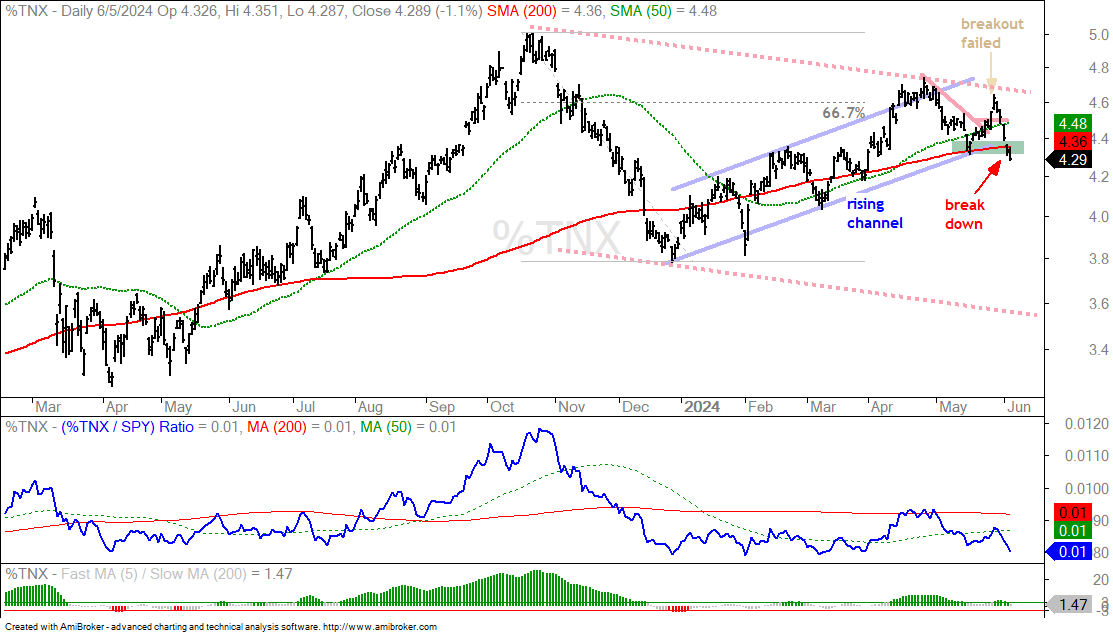
The next chart shows the 10-yr Treasury Yield breaking support to signal a continuation of the November-December decline. This targets a move to the 3.5-3.6 percent area.
Robotics ETF Breaks Out of Small Flag
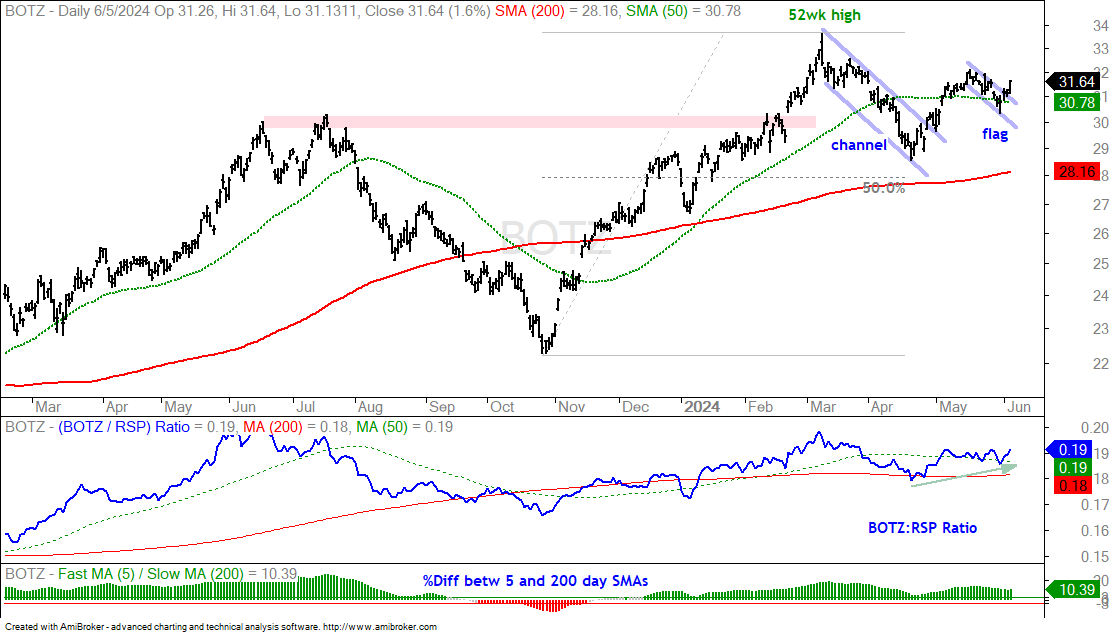
The next chart shows the Robotics & Artificial Intelligence ETF (BOTZ) turning up after a short pullback at the end of May. Overall, the long-term trend is up with price above the 200-day SMA and the 5/200 day differential showing uptrend. After hitting a new high in mid March, BOTZ corrected with a falling channel into mid April. This decline retraced a little less than half of the prior advance. BOTZ broke out in early May and this breakout signals a continuation of the bigger uptrend. Shorter term, the ETF exceeded the 50-day and then fell back into late May. This decline formed a small falling flag and the ETF broke out with a surge on Wednesday. A close below the 50-day would call for a re-evaluation.
MedPace Breaks Out
The market has been quite ruthless the last few weeks with several breakouts failing. DKNG, NBIX, HUBS, SMCI, UNP and CLFT were featured in May, but their breakouts failed. All was not lost because some breakouts succeeded with follow through. These include VRTX, LLY, NVDA and MAGS. This is just a heads up for the next breakout.
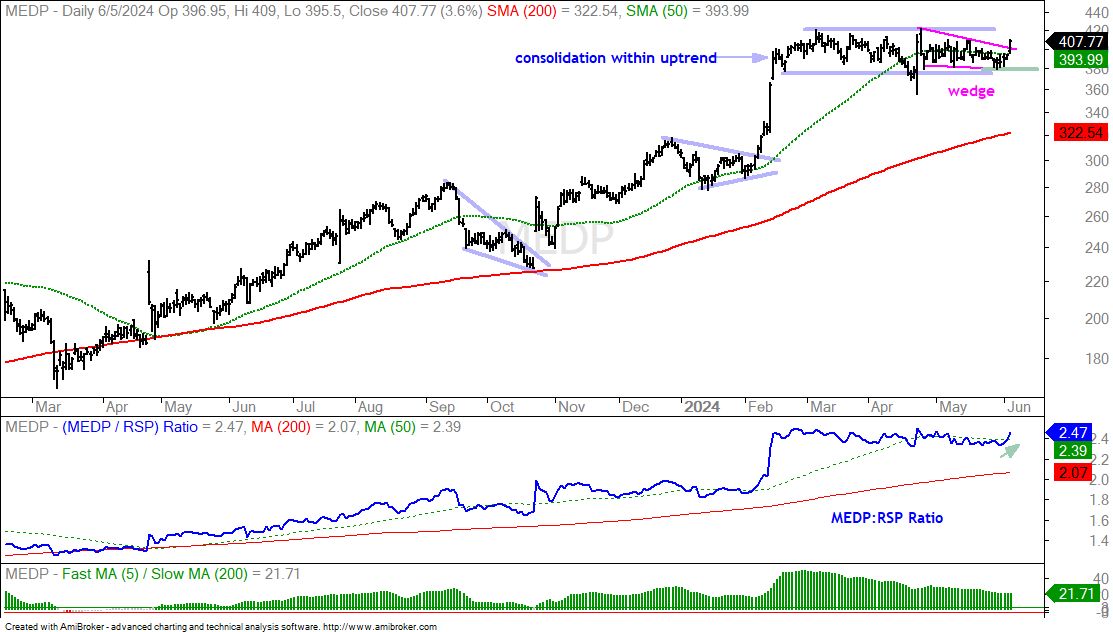
The chart below shows MedPace (MEDP) with a big surge in February and a long consolidation into early June. After a dip and surge in mid April, the consolidation narrowed into a falling wedge and the stock broke out with a big move on Wednesday. This breakout is bullish and I would mark the initial re-evaluation level using the late May lows.
Palantir Breaks Out within Bigger Pattern
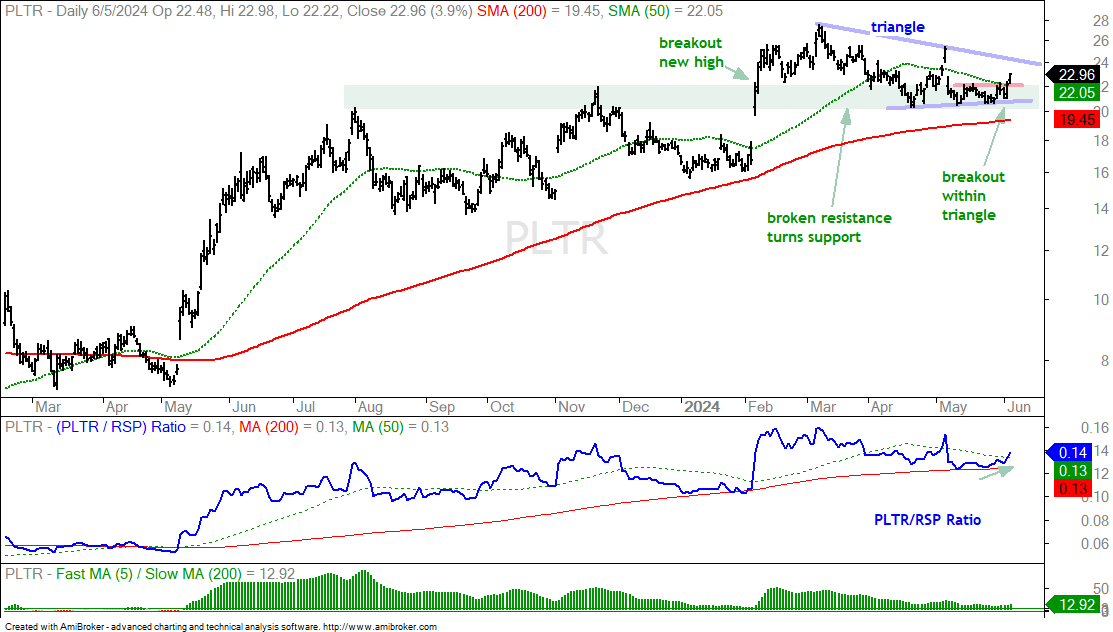
The next chart shows Palantir (PLTR) breaking out to a new high and then consolidating with a triangle forming. The breakout zone in the 20-22 area turned support and this area held with tests from April to June. Overall, I view the triangle a consolidation within a bigger uptrend – or a bullish continuation pattern. After falling sharply with a gap down on May 7th, the stock firmed the last few weeks and broke short-term resistance with a surge the last two days. This reverses the downswing within the pattern and increases the odds for a bigger breakout. A close below the May lows would argue for a re-evaluation.
China Large-Cap ETF Corrects after Breakout
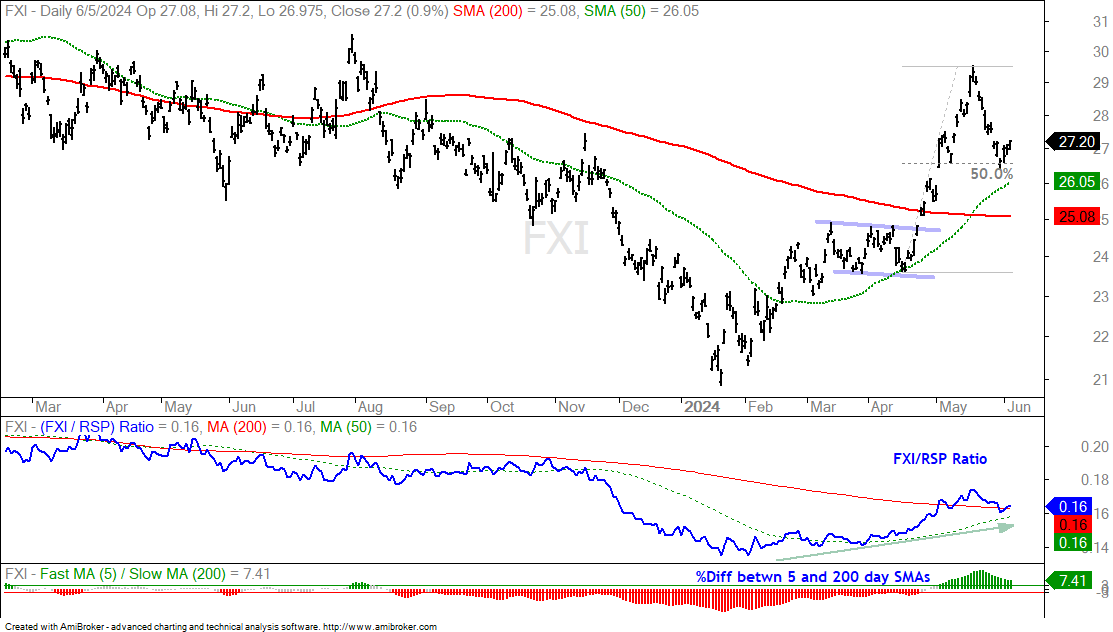
Chinese stocks led the market from mid January to mid May as the China Large-Cap ETF (FXI) surged some 41% and broke its 200-day SMA. In the meantime, the 5/200 differential exceeded +3% on May 2nd and the 50-day crossed the 200-day on May 17th. It certainly looks like the start of an uptrend. The chart below shows FXI exceeding 29 and then falling back towards the rising 50-day SMA (green dashed line). This decline also retraced around half of the advance from mid April to mid May. This is an area to expect some firmness and perhaps a resumption of the long-term uptrend.
Alibaba and JD.com Test Breakout Zones
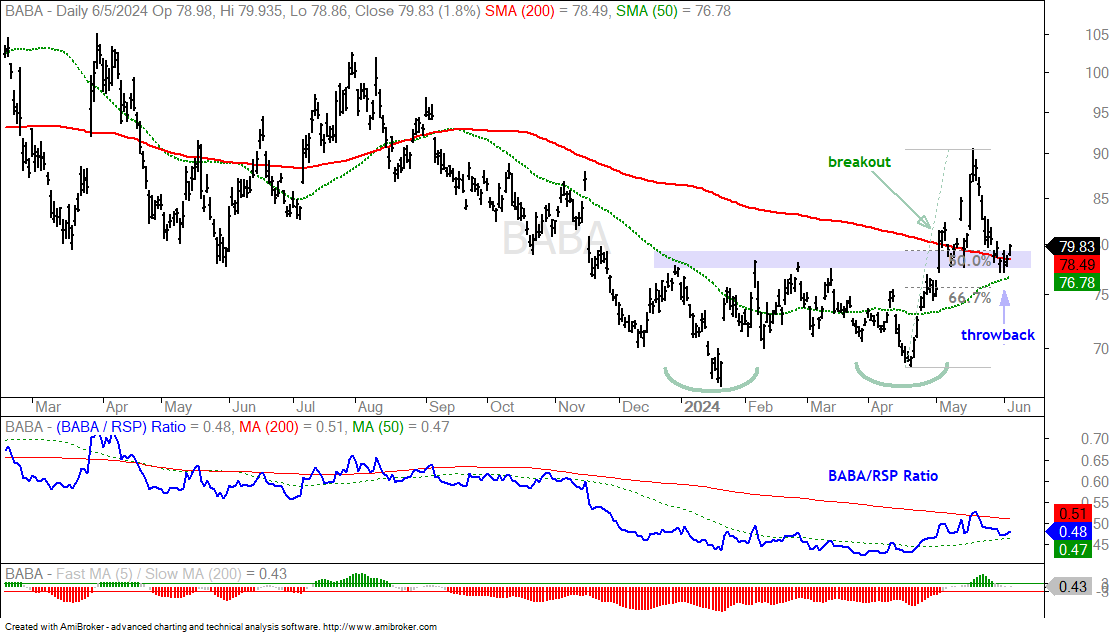
The next chart shows Alibaba (BABA) with a Double Bottom from January to April and a big breakout surge into mid May. Broken resistance turns into first support and the stock fell back to this zone. This decline back to the breakout is called a “throwback”. In theory, it offers a second chance to partake on the breakout, without chasing. This is the place to watch for support and a resumption of the uptrend.
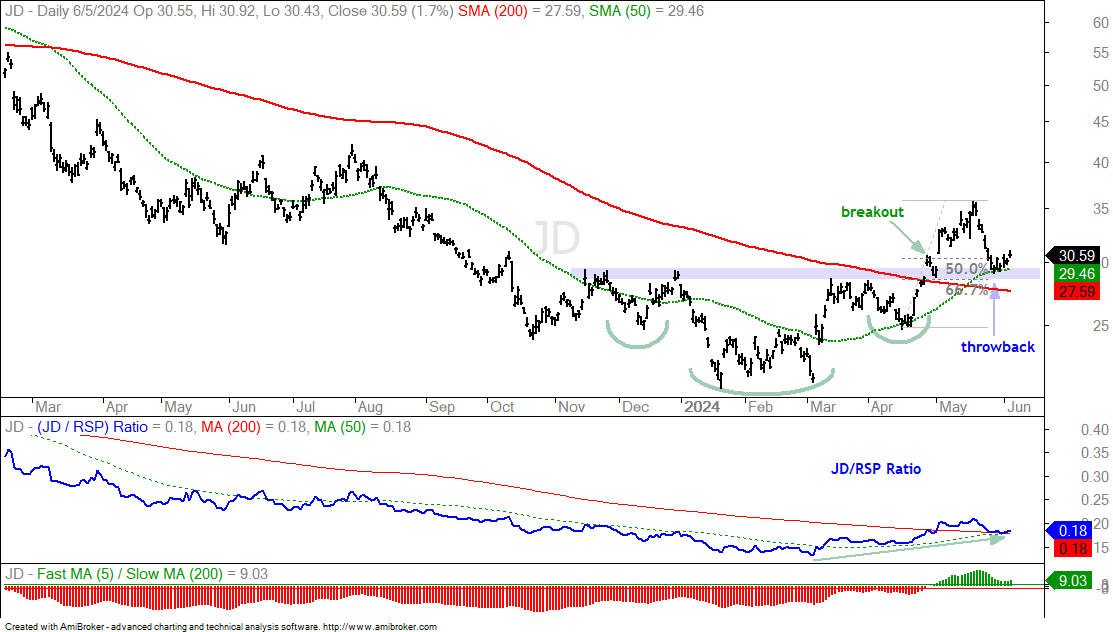
The next chart shows JD.com (JD) with an inverse head-and-shoulders pattern from December to April. JD broke out in late April and moved above 35. The stock then fell back to the breakout zone, which turns into support. The rising 50-day SMA is also in this area. As with BABA, this is the area to watch for firmness and a resumption of the bigger uptrend.