Gold/Silver Miners Go Parabolic – Uranium ETFs Extend on Breakouts – Bitcoin Setup
Posted By
Arthur Hill, CMT
On
In
Archive |
No Comments
Headlines
Gold and Silver Extend Higher
Gold and Silver Miners Tack on another 10%
Copper Extends on Breakout
Uranium ETFs Extends on Breakouts
US Oil Fund Falls back to Support
Bitcoin ETF Breaks Triangle Line
The next report will be the Friday Chart Fix (3 Oct).
The next Premium report will be on Tuesday, October 7th.
Metals remain strong with gold, silver and their respective miners leading the charge. Industrial metals are also strong with copper, DBA and uranium extending on their late August breakouts. Even Bitcoin caught a bid this week with the government shutdown. Oil reacted differently with a rather sharp decline this past week.
I would not read too much into the ramifications of the government shutdown. Adam Turnquist of LPL Financial notes[1] that the average stock market return is -1.6% during government shutdowns since 1950. However, the S&P 500 rose during each shutdown since 1990. Most recently, the S&P 500 rose 10% during the one month shutdown from December 22, 2018 to January 25, 2019. The lesson here: ignore the news and focus on the charts.
Gold and Silver Extend Higher
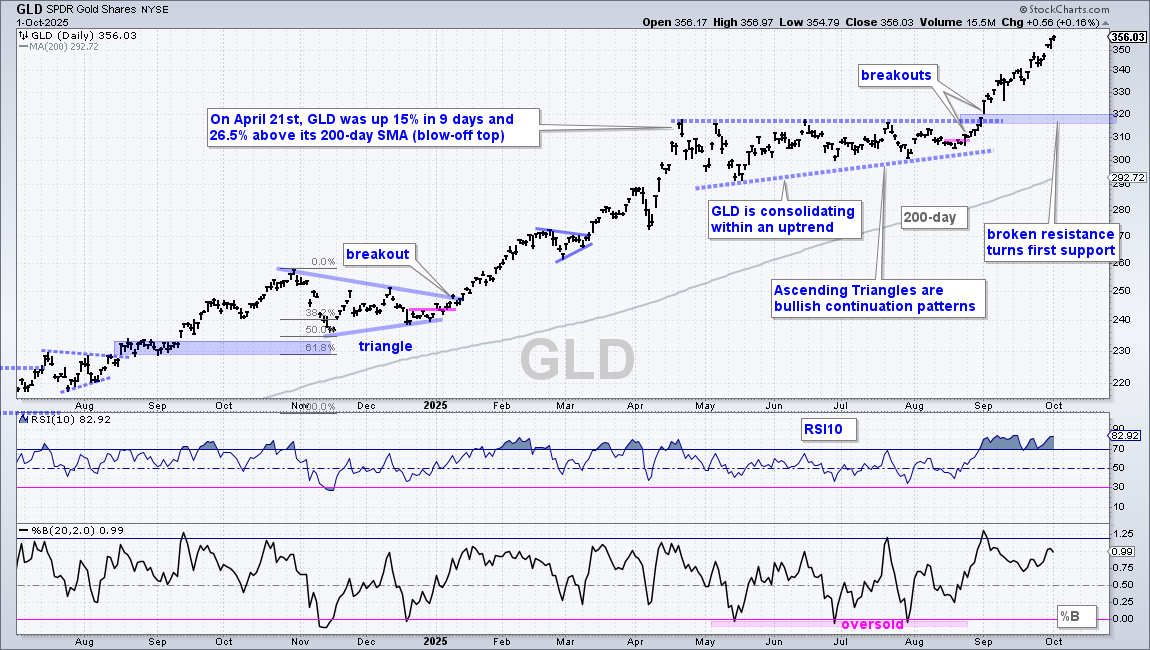
There is no change on the Gold SPDR (GLD) chart as it extends on its Ascending Triangle breakout. Forget about price targets based on the Ascending Triangle. The long-term trend is up, the Ascending Triangle is a bullish continuation pattern and the breakout signals a continuation of the long-term uptrend. End of story. Gold is getting extended after a 16% run since August 20th, but shows no signs of letting up. As you can guess, GLD is in the trend-monitoring phase, which means there is nothing to do here except monitor price action and wait for the next trading setup.
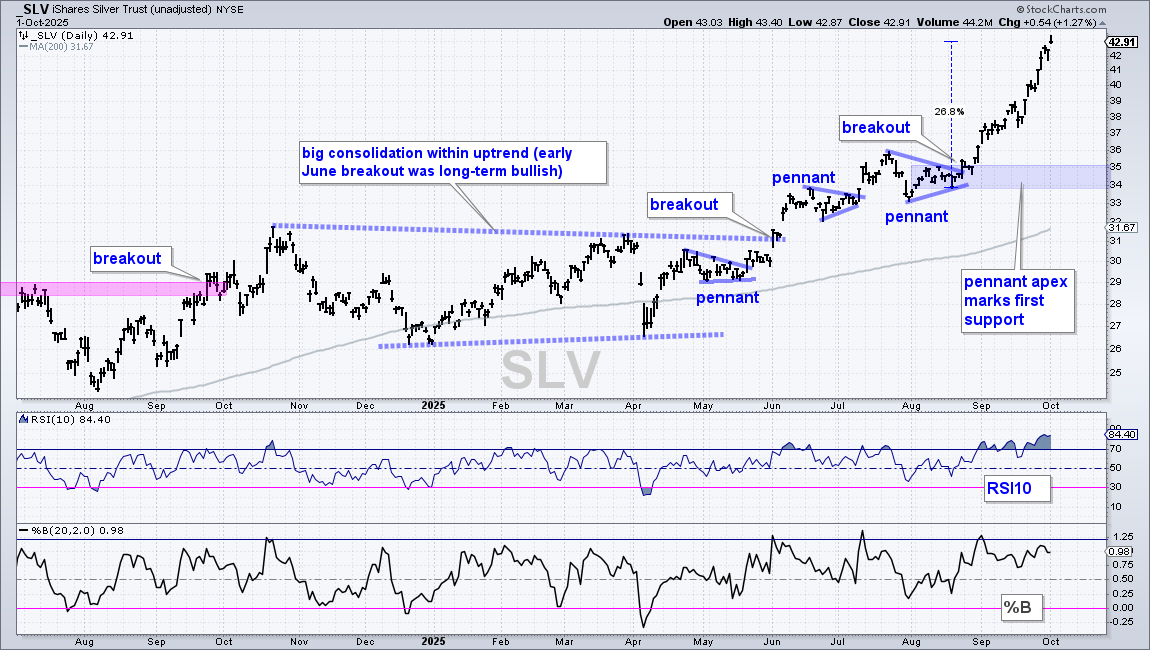
Anything gold can do, silver can do better. The Silver ETF (SLV) broke out in late August and is up 27% since August 20th. SLV is also looking extended, but showing no signs of letting up. Note that silver has a history of violent moves, both up and down. SLV is also in the trend-monitoring phase right now.
Gold and Silver Miners Tack on another 10%
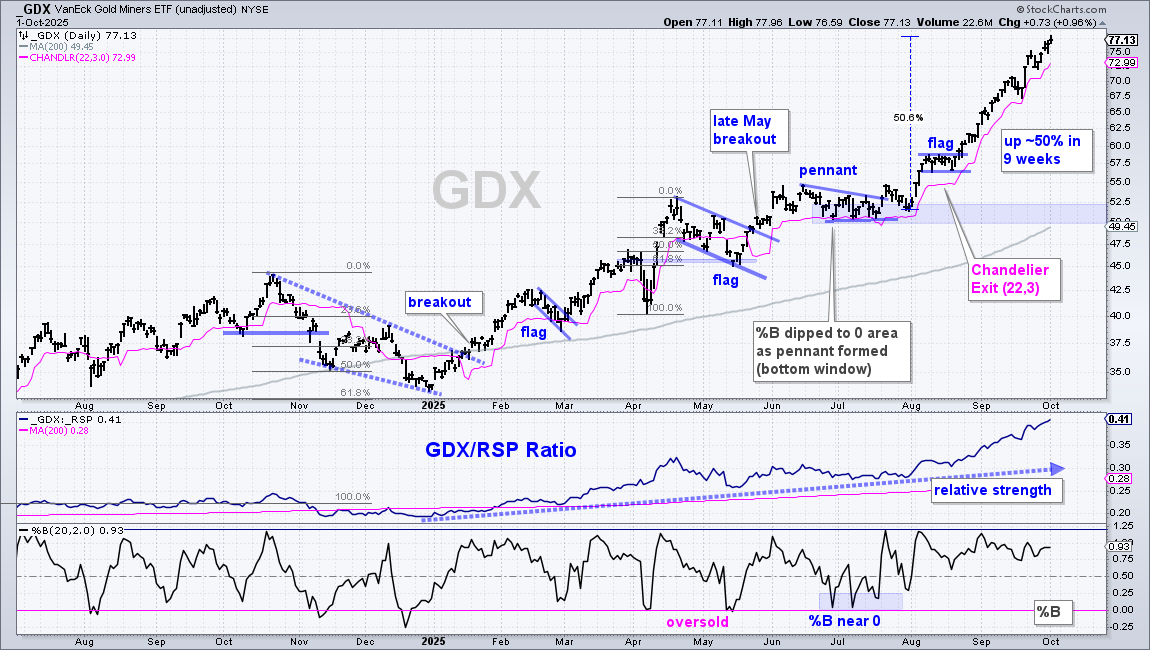
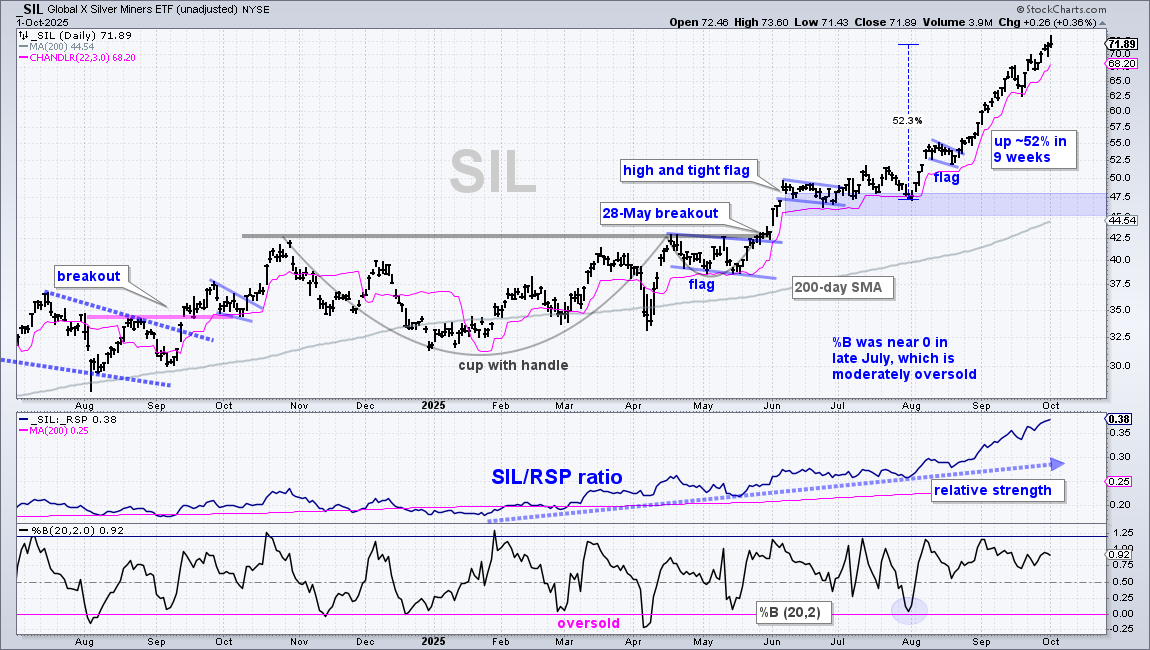
The Gold Miners ETF (GDX) and the Silver Miners ETF (SIL) are also in the midst of moonshots. The first chart shows GDX with a pennant breakout in late July and a flag breakout in mid August. GDX is up around 50% in nine weeks as this advance goes parabolic.
How do you manage a trade that goes parabolic? Try a tight trailing stop. The pink line shows the Chandelier Exit (22,3), which is 3 ATR(22) values below the 22-day high. GDX broke flag resistance in late May and held above this exit ever since. This exit trails price as long as the 22 day high rises. It is currently at 72.99. Try a Chandelier Exit (22,2) if you want an even tighter stop. The next chart shows SIL with similar characteristics.
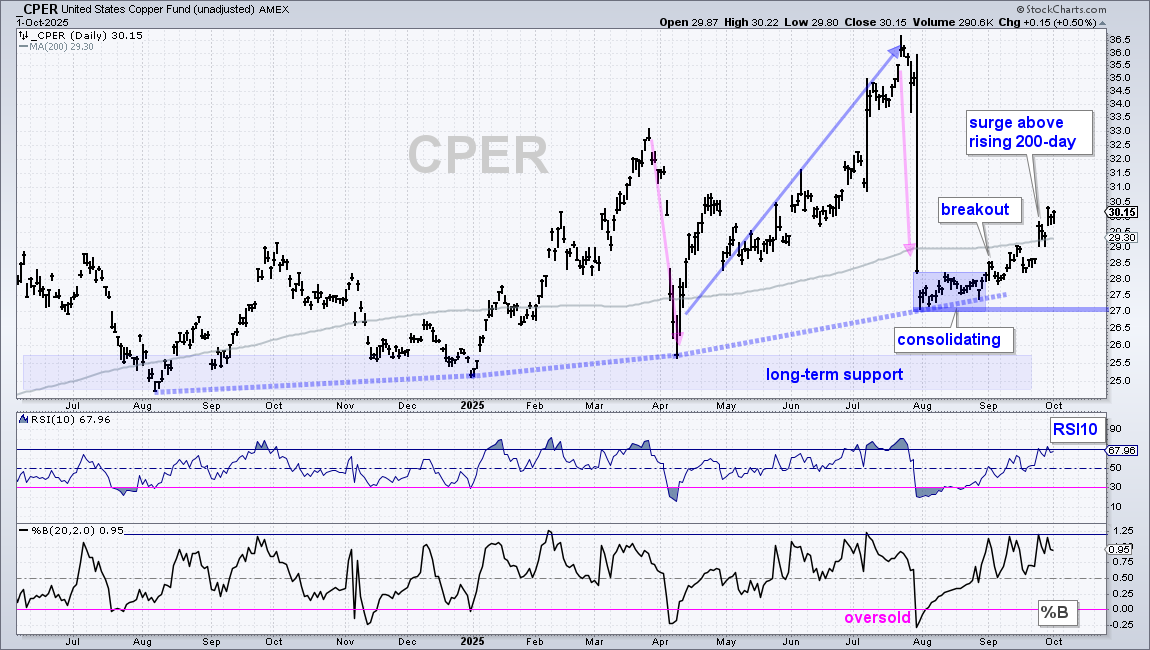
There is no change in the Copper ETF (CPER) as it extends on its late August breakout. Note that gold, silver and copper broke out in late August. Metals are running. The long-term trend for CPER is up with higher lows (blue dashed line) and higher highs the last 12 months. These highs and lows, however, are quite volatile with big swings. CPER is now in the midst of an upswing within a long-term uptrend as it extends above its rising 200-day SMA. The August lows mark support at 27.
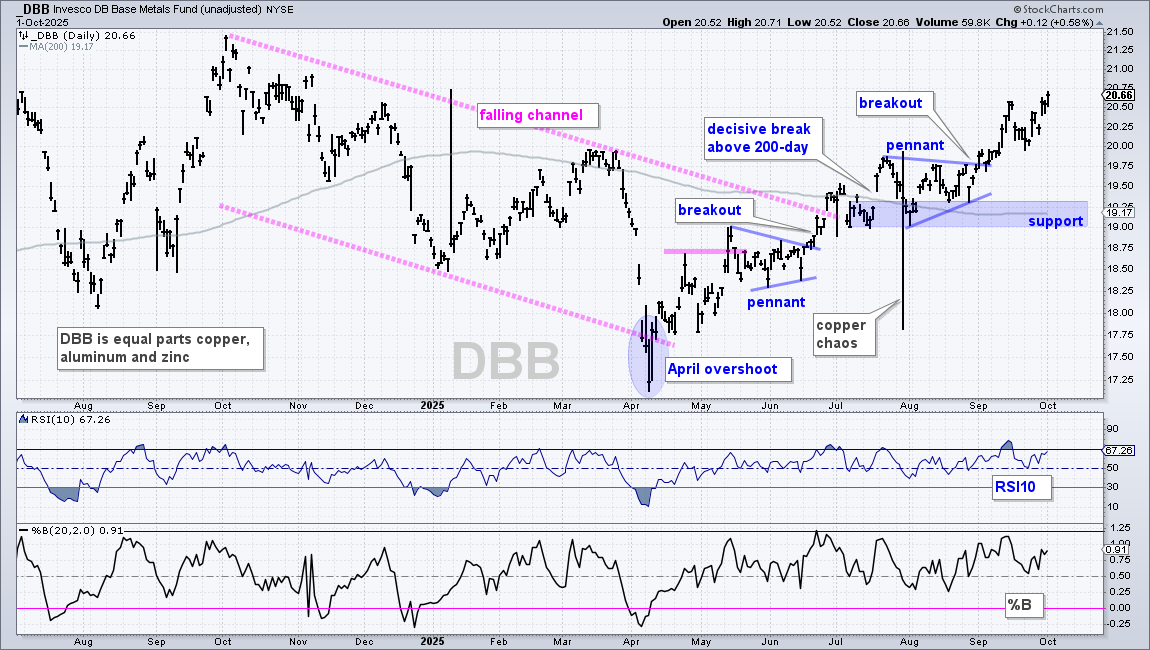
The DB Base Metals ETF (DBB) is also in a long-term uptrend with a new closing high for 2025 this week. Long-term, DBB broke the falling channel trendline in late June and the 200-day SMA in July. A pennant formed into August and the ETF broke the pennant line in late August. As with the other metals related ETFs, DBB remains in the trend-monitoring phase.
Uranium ETFs Extends on Breakouts
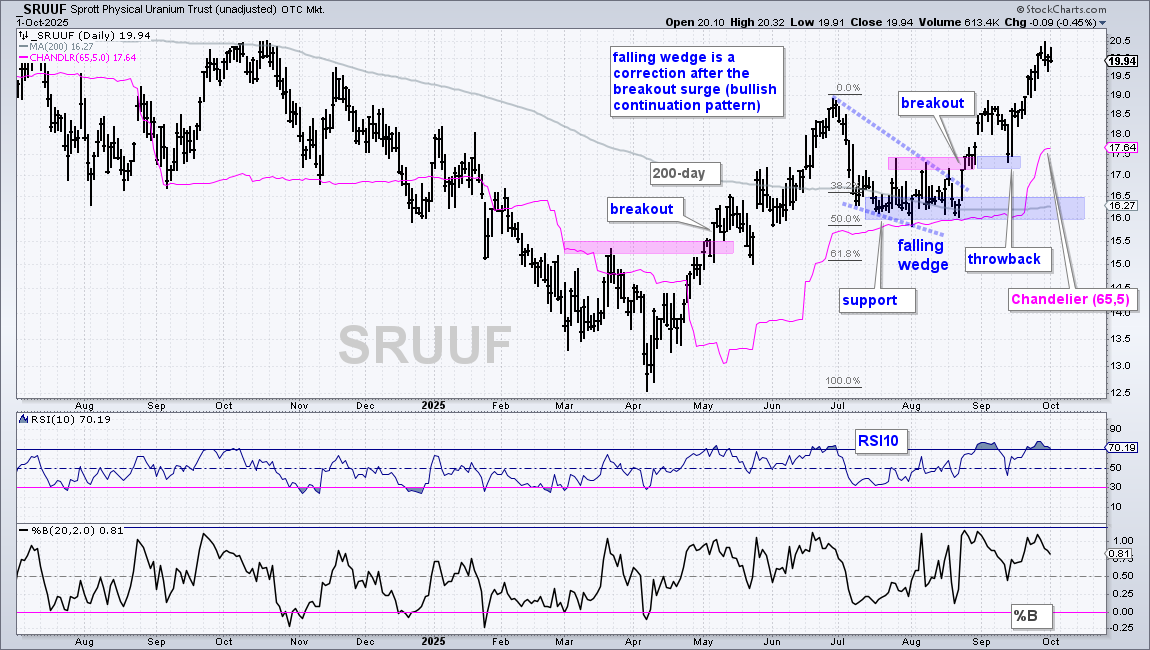
There is no change in the uranium-related ETFs. The Sprott Physical Uranium ETF (SRUUF) covers uranium as a commodity and the Uranium ETF (URA) represents uranium stocks. SRUUF was featured on August 28th as it broke out of the falling wedge. This was a classic setup: long-term uptrend, falling wedge correction, 50% retracement and strong support in the 16 area. The ETF broke out, tested the breakout zone with a throwback and surged to new highs for 2025. SRUUF is now in the trend-monitoring phase. For reference, the pink line shows the Chandelier Exit (65,5) at 17.64.
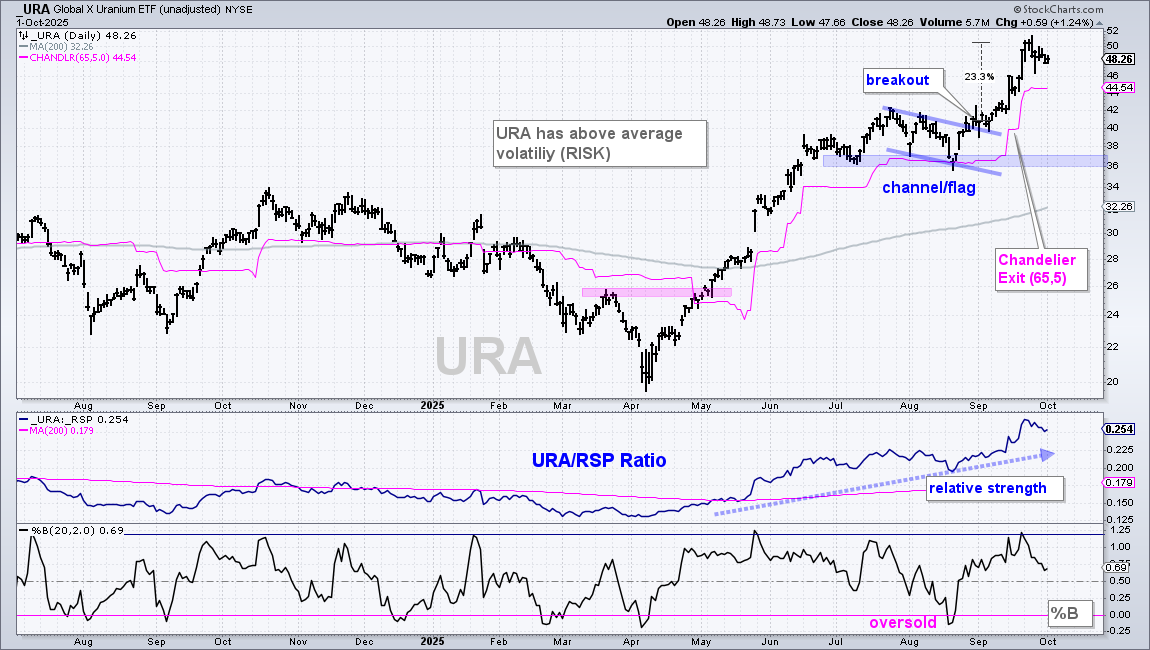
The next chart shows URA with a falling flag in August and a breakout in late August. URA hit 52-week highs in September and remains in a leading uptrend. The middle window shows the price-relative (URA/RSP ratio hitting new highs in late September, which means uranium stocks are outperforming the broader market. For reference, the pink line shows the Chandelier Exit (65,5) at 44.54.
US Oil Fund Falls back to Support
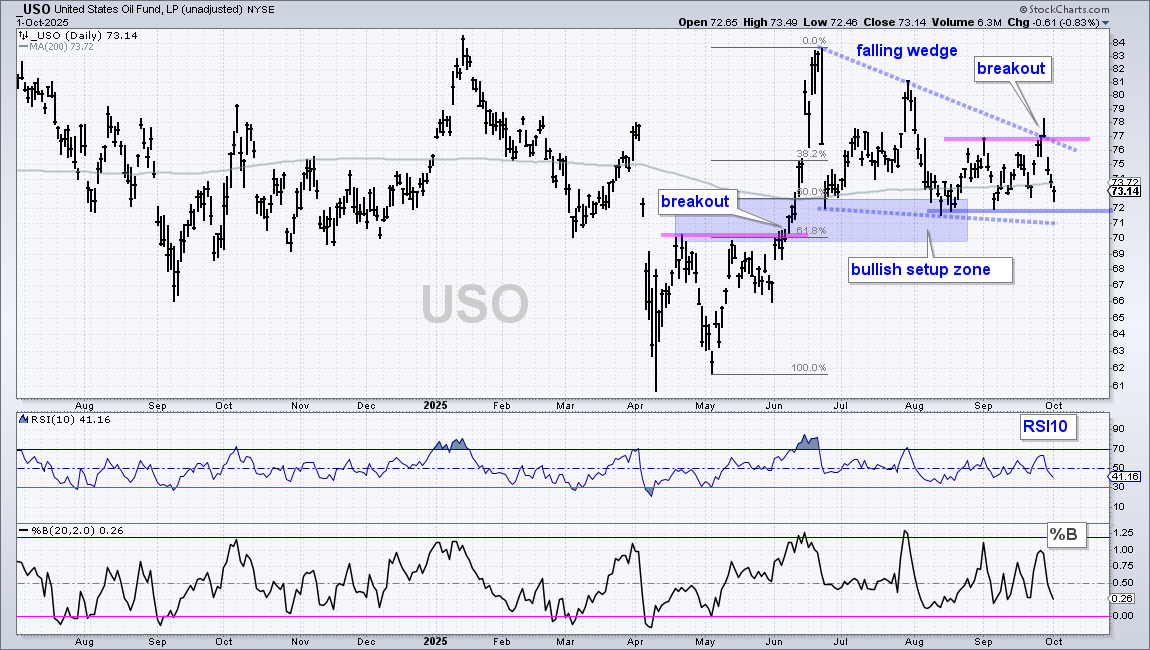
The US Oil Fund (USO) broke out with a surge above 77 last week, but gave it all back with a decline back to the 73 area. Even though this breakout did not hold, the overall setup remains. USO surged from early May to late June and corrected with a falling wedge that retraced 50-61.8 percent of the prior advance. USO is back in the bullish setup zone (blue shading). USO defended support in the 72-73 area with bounces in August and September. A close below 72 would break support and negate the falling wedge setup.
Note that I featured four energy-related ETFs last week[3] (XLE, OIH, XOP and FCG). This analysis from last Thursday still holds. I would also suggest trading these ETFs based on THEIR charts and THEIR signals, not the signals from USO or Light Sweet Crude ($WTIC).
Bitcoin ETF Breaks Triangle Line
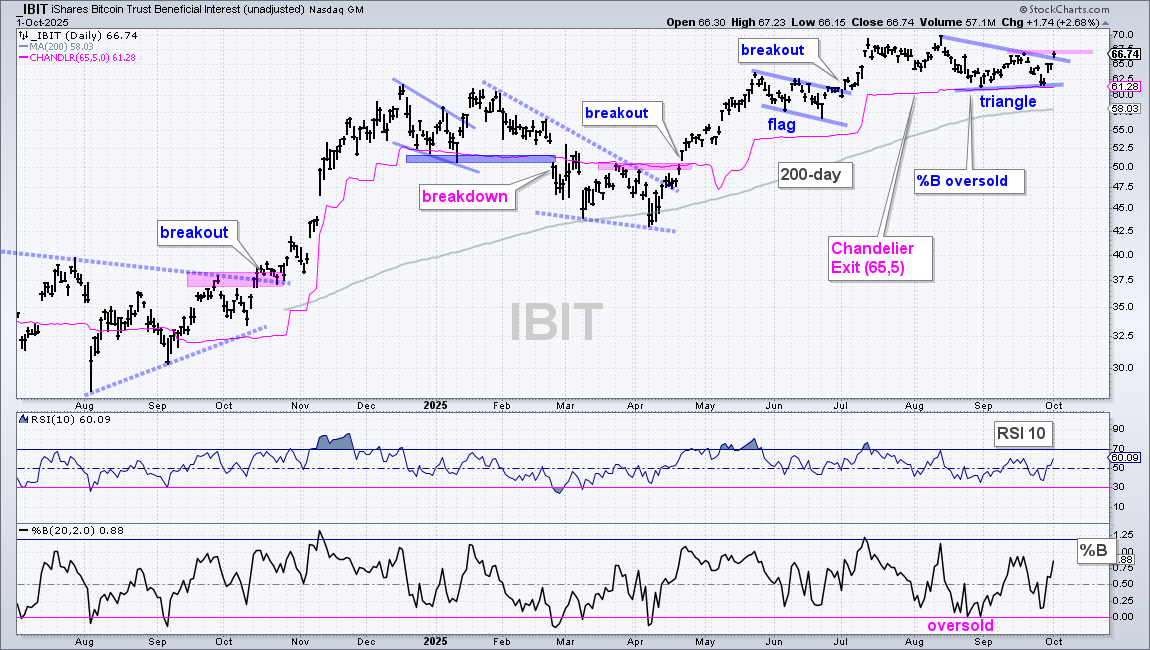
The Bitcoin ETF (IBIT) has been largely flat since June as it trades around the 62.5 area the last four months. Overall, the long-term trend is up with a new high in mid August and price well above the rising 200-day SMA. Most recently, IBIT consolidated with a triangle forming since mid August. I view this as a consolidation within an uptrend, which makes it a bullish continuation pattern. IBIT broke the upper line with a surge above 65 this week. Further strength above the mid September high would complete the breakout. The pink line marks the Chandelier Exit (65,5), which has held since the late April breakout. A close below 61.28 would trigger this exit and call for a re-evaluation.
DISCLAIMER: This content provided strictly for informational and educational purposes. It should not be interpreted as an offer to buy or sell any security, nor as a solicitation to engage in any investment activity. Nothing here constitutes a recommendation regarding any specific security, portfolio, transaction, or investment strategy.
At times, the author or affiliates may hold positions or interests in securities discussed. Any stocks or examples mentioned are not endorsements or suggestions to purchase. This material does not consider your individual financial goals or circumstances, and you should seek guidance from a qualified financial or investment adviser before making any trading or investment decisions.
Past performance does not guarantee future results.
Send feedback to support(at)trendinvestorpro.com or use the contact form. [4]