102 Days above 50-day – New Lows – Tech Power – Commodity Bulls – Oil Gets Interesting
- Arthur Hill, CMT

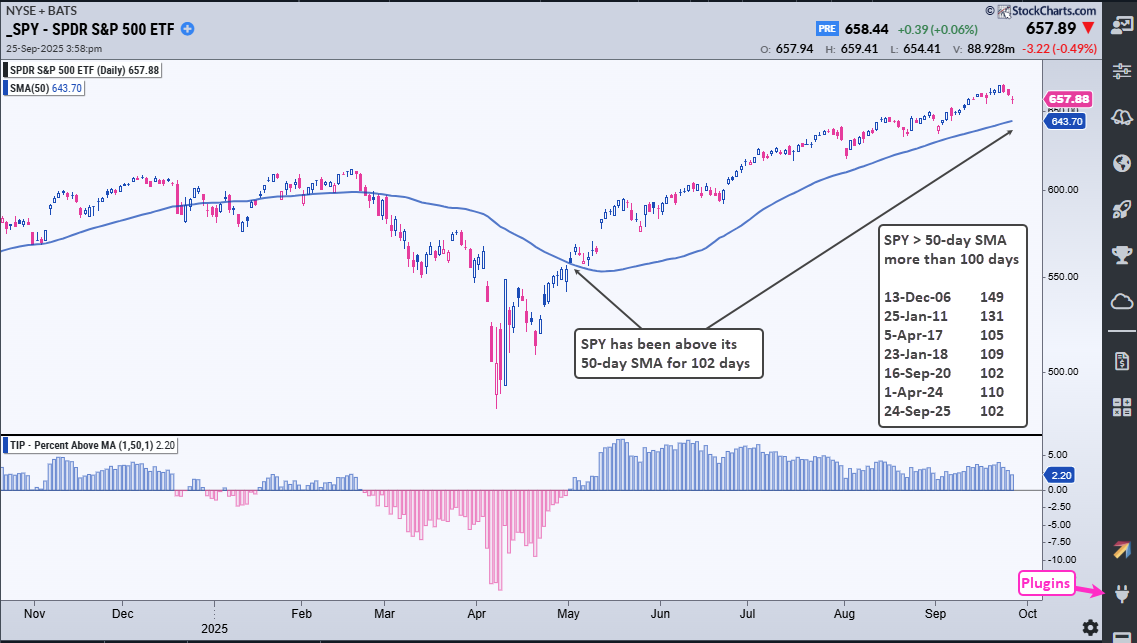
Welcome to the Friday Chart Fix! SPY reached a milestone this week as it held above its 50-day SMA for more than 100 days, which was the seventh such occurrence since 2000. Even though SPY is 2.2% above its 50-day, only half of its components are above their 50-day SMAs and new lows are expanding. However, a correction in SPY could remain elusive until tech stocks and the MAG7 buckle. Elsewhere, it is a bull market in commodities and even energy is starting turn up.
Recent Reports and Videos for Premium Members
- SPY, QQQ and XLK Hold the Line (Key Levels to Watch)
- Fastenal Turns Leader and GE Becomes Oversold
- A Bullish Setup for the 7-10Yr TBond ETF
- Bitcoin ETF Forms Bearish Continuation Pattern
- Click here to take a trial and gain full access. [1]
SPY above 50-day SMA for 102 Days
SPY crossed above its 50-day SMA on May 1st and has been above this moving average for 102 days. This is the seventh time since 2000 that SPY has held above its 50-day SMA for more than 100 days. The chart below shows the prior milestones with the date the number hit 100 and the total number of days above the 50-day SMA. This shows just how shallow the pullbacks were since May, and that it has been a long time since a decent pullback. The bottom window shows Percent above MA (1,50,1), which is the percentage difference between the close and the 50-day SMA. SPY is 2.20% above its 50-day.
Percent above MA (1,50,1) is one of 11 indicators in the TIP Indicator-Edge Plugin for StockCharts ACP. Click here to learn more. [2]
QQQ, MAGS, XLK and XLC Power the Market
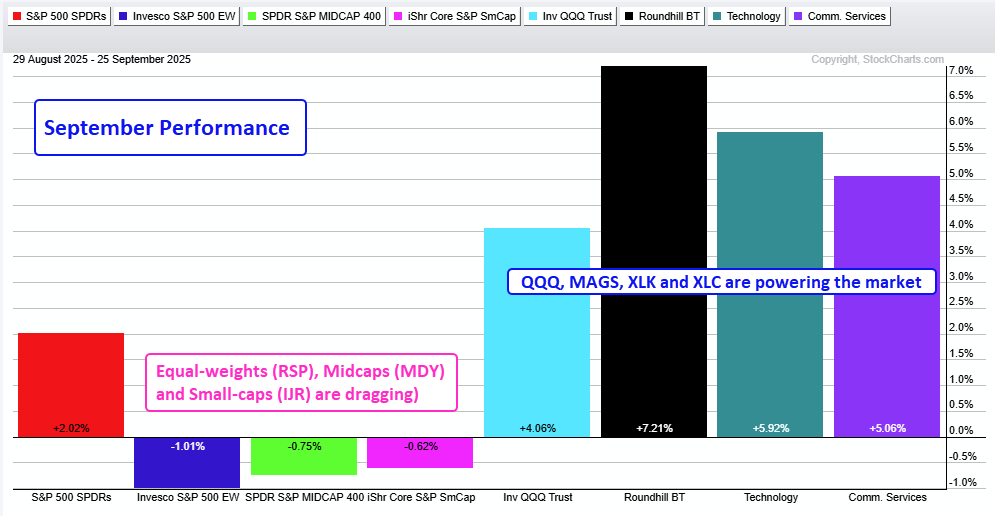
SPY and QQQ recorded new highs this week to affirm their uptrends. Thus far, SPY is up 2% in September and QQQ is up 4%. Life is good for large-caps, the MAG7 and the Technology sector. Tech stocks account for 34.5% of the S&P 500 and 61% of the Nasdaq 100. SPY and QQQ can continue as long as the MAG7 and tech sector remain strong. Elsewhere, note that the S&P 500 EW ETF (RSP) is down 1% so far this month. The S&P MidCap 400 SPDR (MDY) and S&P SmallCap 600 SPDR (IJR) are also down month to date. There is a bull market in one part of the market and a correction elsewhere.
Corrections within the S&P 500 and Nasdaq 100
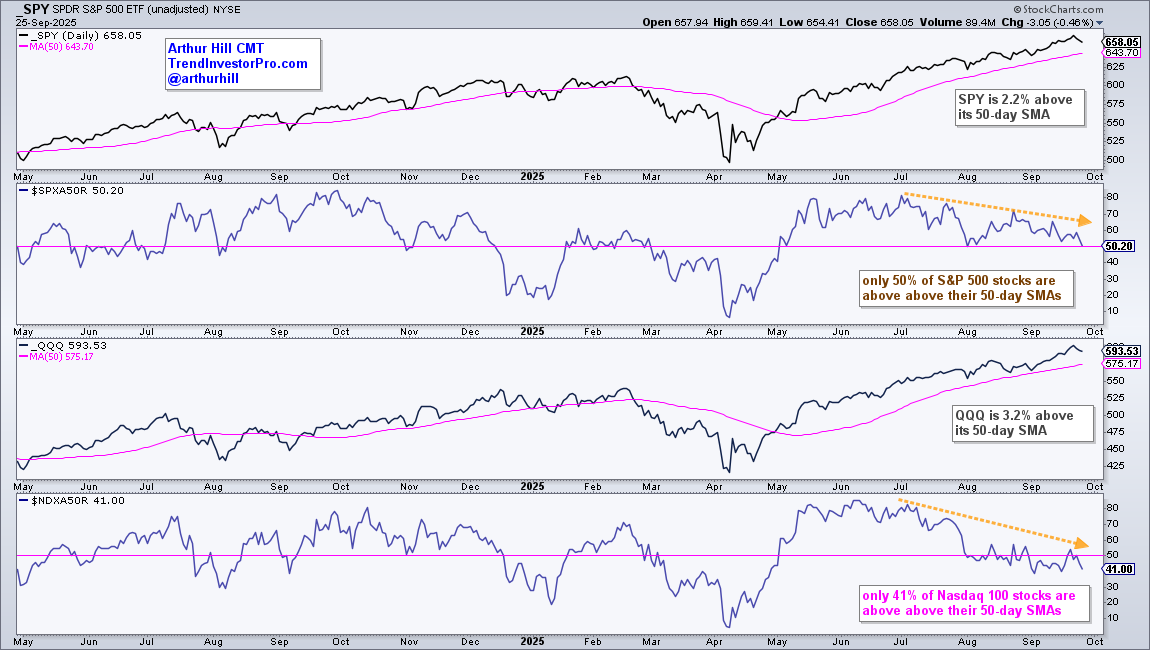
Individual stocks are correcting when we look under the surface. SPY is 2.2% above its 50-day SMA and QQQ is 3.2% above its 50-day SMA. On the chart below, we can also see that only 50% of S&P 500 stocks are above their 50-day SMAs. This is the lowest number since early August. Weakness within the Nasdaq 100 is more pronounced with only 41% of its components above their 50-day SMAs. These bearish divergences have yet to affect SPY and QQQ, but they “bear” watching.
What a Drag it is Being a Small-Cap
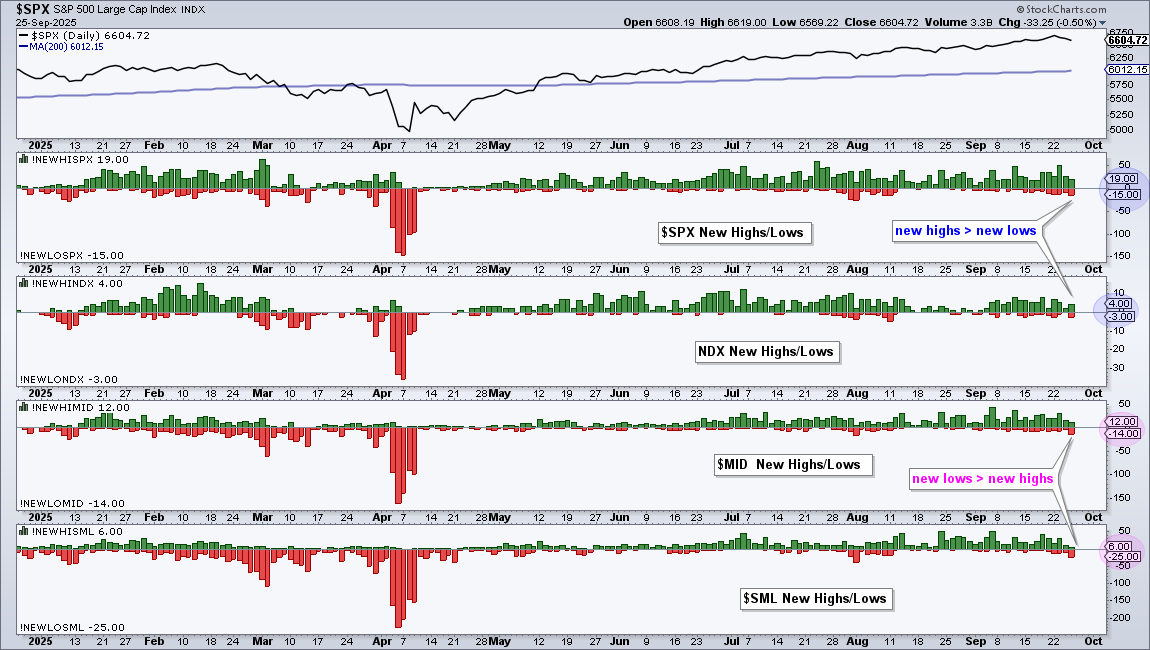
The stock market sneezed on Wednesday-Thursday with the S&P 500 falling .78% in two days. Small-caps took it harder as the S&P SmallCap 600 fell 1.74%, more than twice as much as the S&P 500. Small-caps remain fragile as a group because the number of new lows (25) exceeded the number of new highs (6) on Thursday. Stocks hitting new lows are in strong downtrends and the S&P SmallCap 600 has the most of the major indexes.
Bull Market for a Broad Commodity ETF
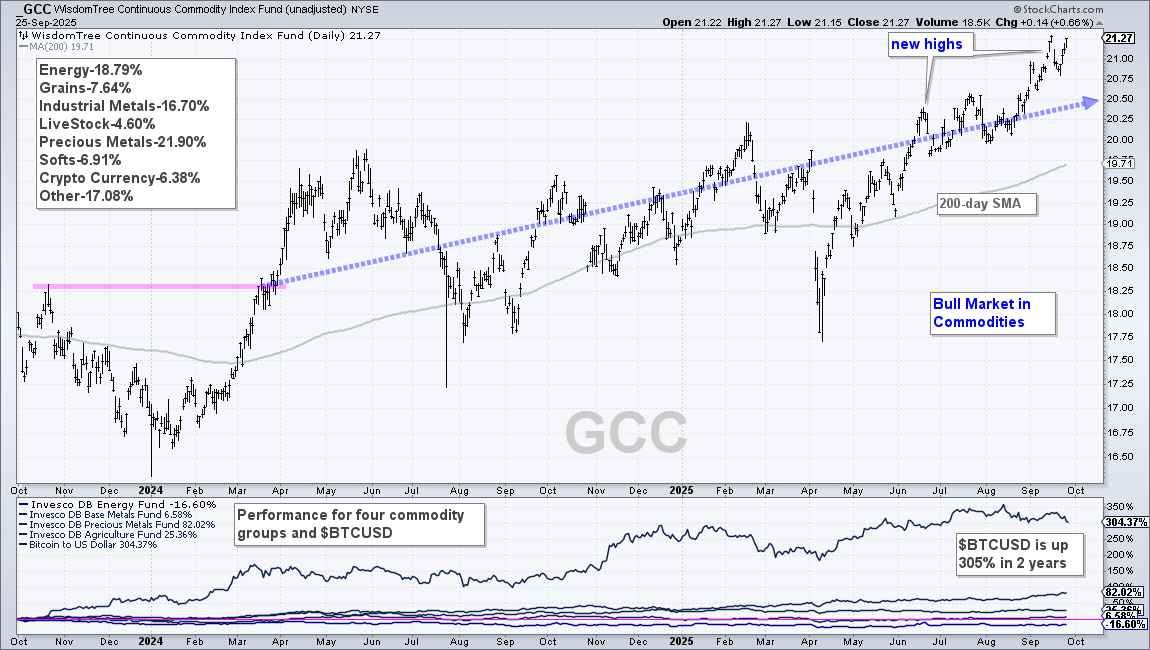
The Continuous Commodity ETF (GCC) is a broad-based commodity ETF with a sprinkling of crypto. Yes, crypto accounts for 6.38%. For reference, the chart below shows the component weightings in the upper left. GCC is in a strong uptrend with price well above the rising 200-day SMA and new highs here in September. There is a message here: commodities are in a bull market and should be part of our portfolio. The lower window shows 2-year performance for Bitcoin and four commodity groups. Bitcoin is leaving the others in the dust, but the DB Precious Metals ETF (DBP) is up a highly respectable 82%. TrendInvestorPro is following [1] the early September breakout in the Copper ETF (CPER).
Even the DB Commodity ETF Shows Promise
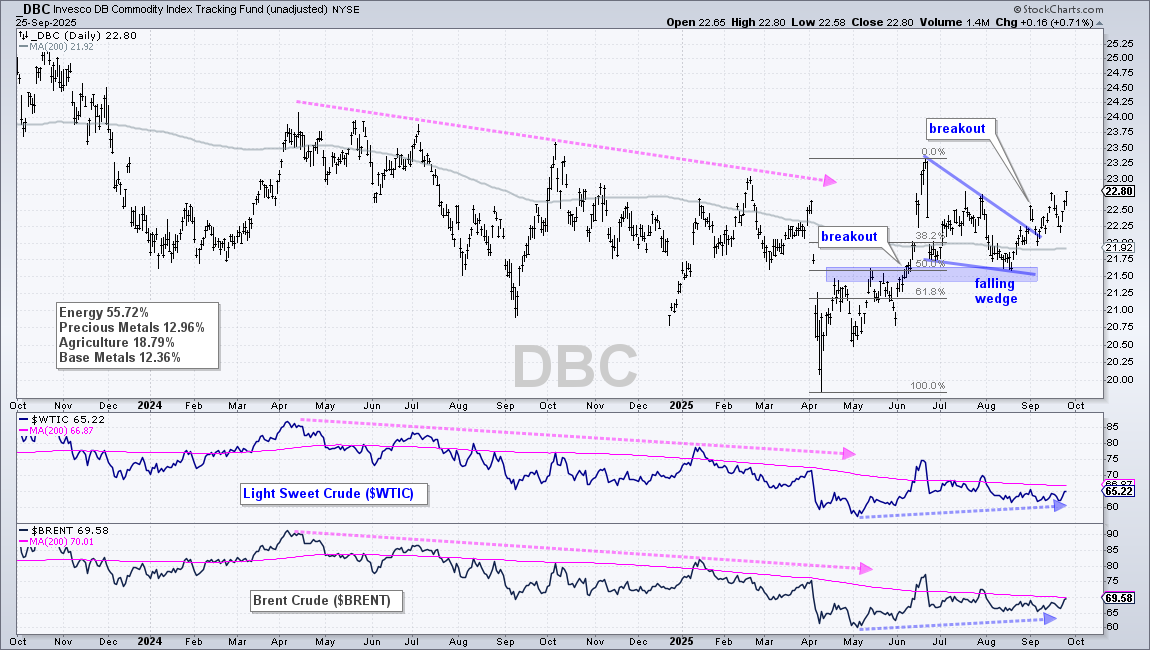
The DB Commodity ETF (DBC) is a different beast because it is heavily weighted towards energy-related commodities (oil, gasoline, natural gas). As the weighting on the chart shows, energy accounts for a whopping 55.72% of the ETF. The bottom window shows Light Sweet Crude ($WTIC) and Brent Crude ($BRENT) in downtrends since April 2024 (pink lines).
Despite downtrends in oil, I am seeing bullish price action on the DBC chart. Note that TrendInvestorPro covered oil and four energy-related ETFs in Thursday’s report/video [3]. DBC surged from early April to mid June with a breakout in the 21.50 area. It then fell back to the breakout zone with a falling wedge that retraced 50% of the prior surge. This is normal price action for a correction after a breakout surge (50% retracement, wedge, return to breakout zone). DBC surged in September and broke out of the falling wedge. This signals a continuation of the April-June surge and argues for higher prices.
Recent Reports and Videos for Premium Members
- SPY, QQQ and XLK Hold the Line (Key Levels to Watch)
- Fastenal Turns Leader and GE Becomes Oversold
- A Bullish Setup for the 7-10Yr TBond ETF
- Bitcoin ETF Forms Bearish Continuation Pattern
- Click here to take a trial and gain full access. [1]
