Posted By
Arthur Hill, CMT
On
In
Archive |
No Comments
Headlines
Finance SPDR Zigzags Higher
KBWB Leads within Finance
Industrials SPDR Winds Up
Aerospace & Defense Leads within XLI
Utilities SPDR Breaks Out
Infrastructure ETF Forms Bullish Pennant
Uranium ETFs Surge
Bitcoin Falls Sharply After Breakout
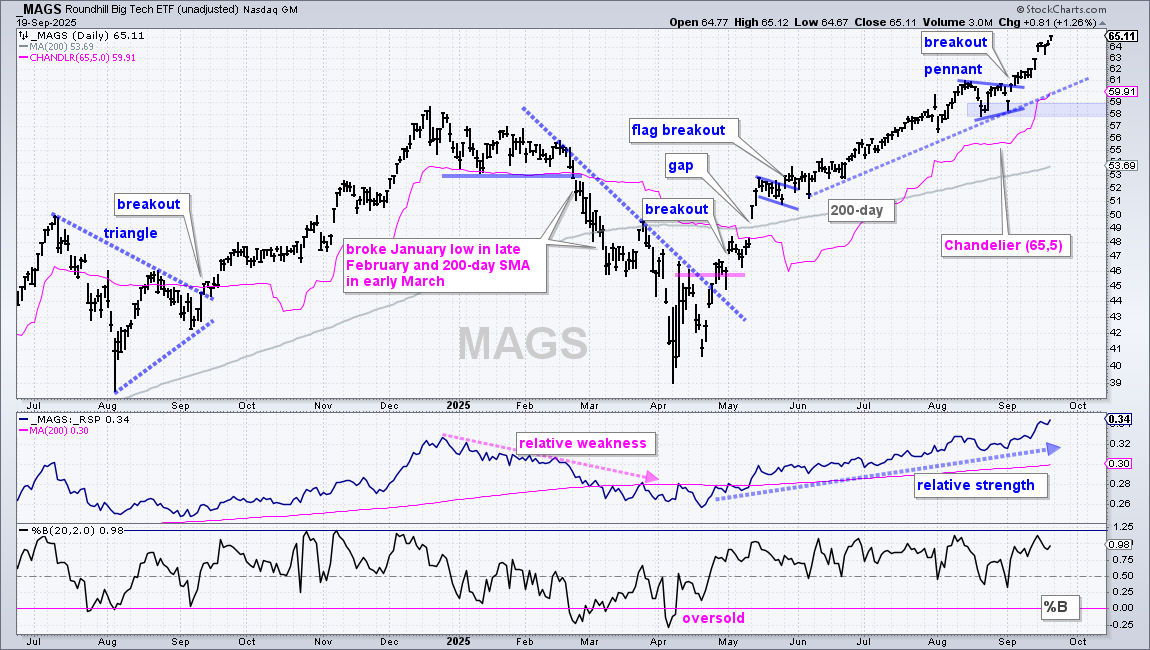
The weight of the evidence remains bullish for stocks, but this is not a bull market that lifts all boats. Strength is concentrated in three sectors: Technology, Consumer Discretionary and Communication Services. Outside of these sectors, I am also seeing leadership in precious metals, industrial metals, clean energy, aerospace-defense, big banks and telecom. Today’s report will show some trends and setups for ETFs outside of Technology. Yes, there is life outside of the Technology sector. We will also update the uranium-related ETFs and the Bitcoin ETF (IBIT).
Finance SPDR Zigzags Higher
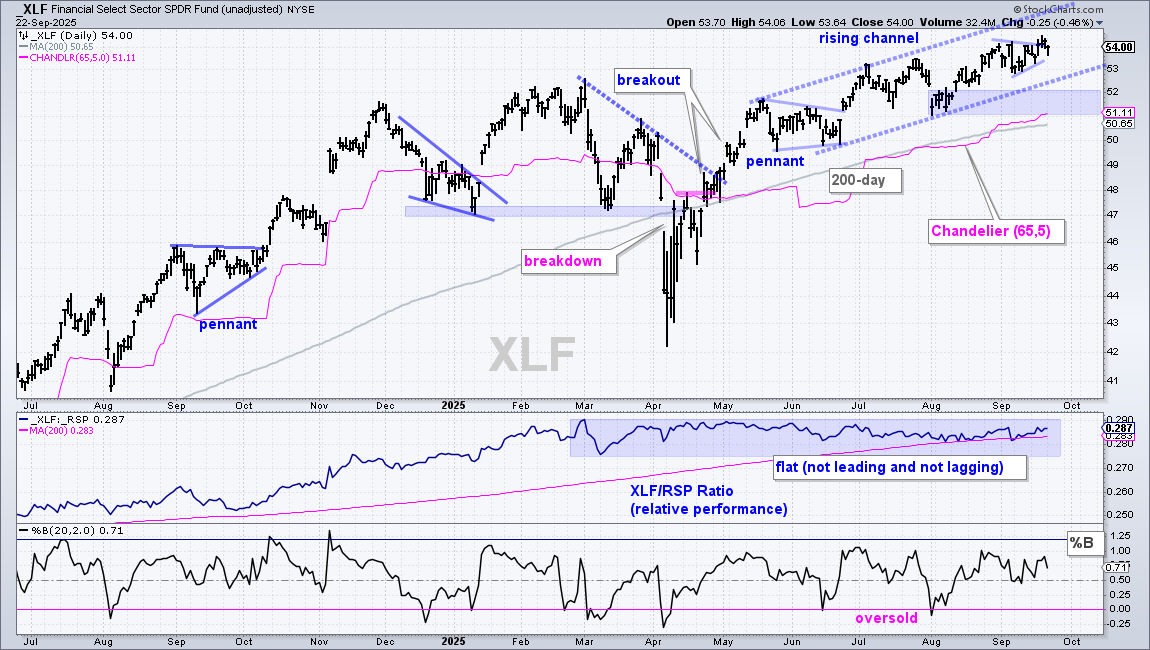
The Finance SPDR (XLF) is not outperforming or showing relative strength, but it is in a strong uptrend with 52-week highs in September. Anything hitting a 52-week high is in a strong uptrend. Note that Finance (13.64%) is the second largest sector in the S&P 500, but still a distant second to Technology (34.34%). On the price chart, XLF started an uptrend with breakouts in late April and early May. A rising channel defines the current advance since mid May with a series of higher highs and higher lows. Short-term, the only setup I see is a small pennant in early September and a breakout at 54 last week.
The pink line is the Chandelier Exit (65,5), which is 5 ATR(65) values below the 65-day high. The Average True Range (ATR) is a volatility indicator. Thus, the higher the volatility, the higher the ATR value. Chandelier Exits trail higher when prices rise and there are new 65-day highs. This line flattens when prices fall or move sideways (without recording a 65-day high). A close below the Chandelier Exit means there was a five ATR decline from the 65-day high, which is deemed significant. This is a long-term trend-following exit. See this ChartSchool article[1] for more details.
KBWB Leads within Finance
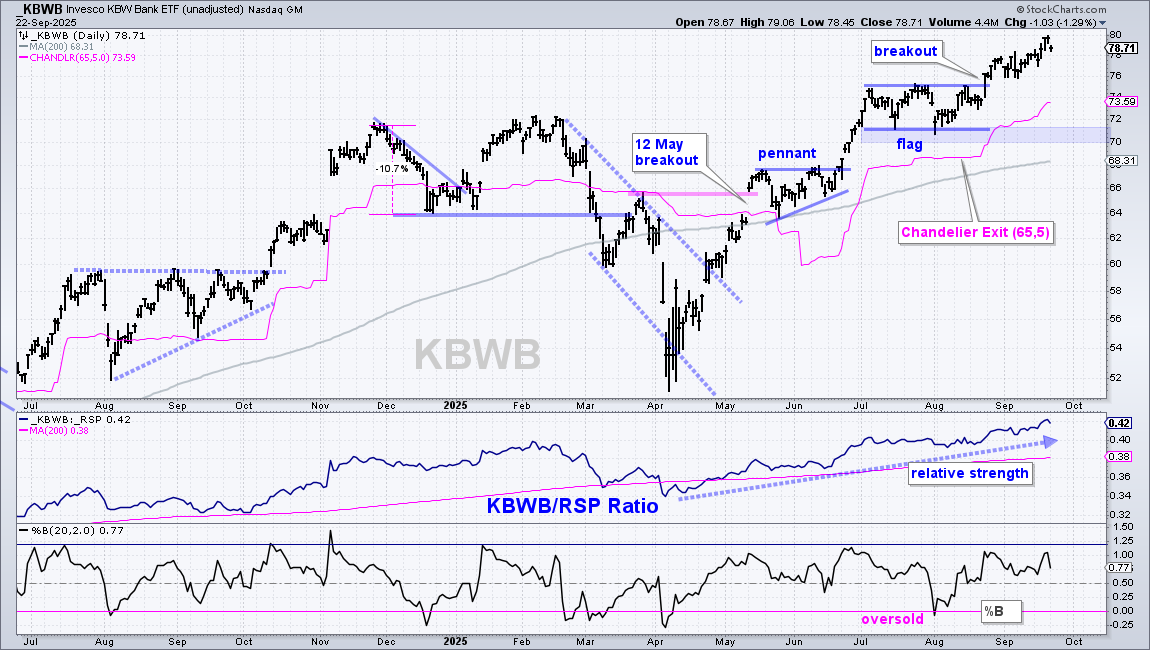
In contrast to XLF, the KBW Bank ETF (KBWB) is leading the market with a new high in the price-relative (KBWB/RSP ratio). The middle window on the chart below shows the price-relative turning up in April and moving higher the last five months (relative strength). On the price chart, KBWB surged in late June, formed a flag into August and broke out in late August. The stock followed through on this breakout with further gains into mid September.
Industrials SPDR Winds Up
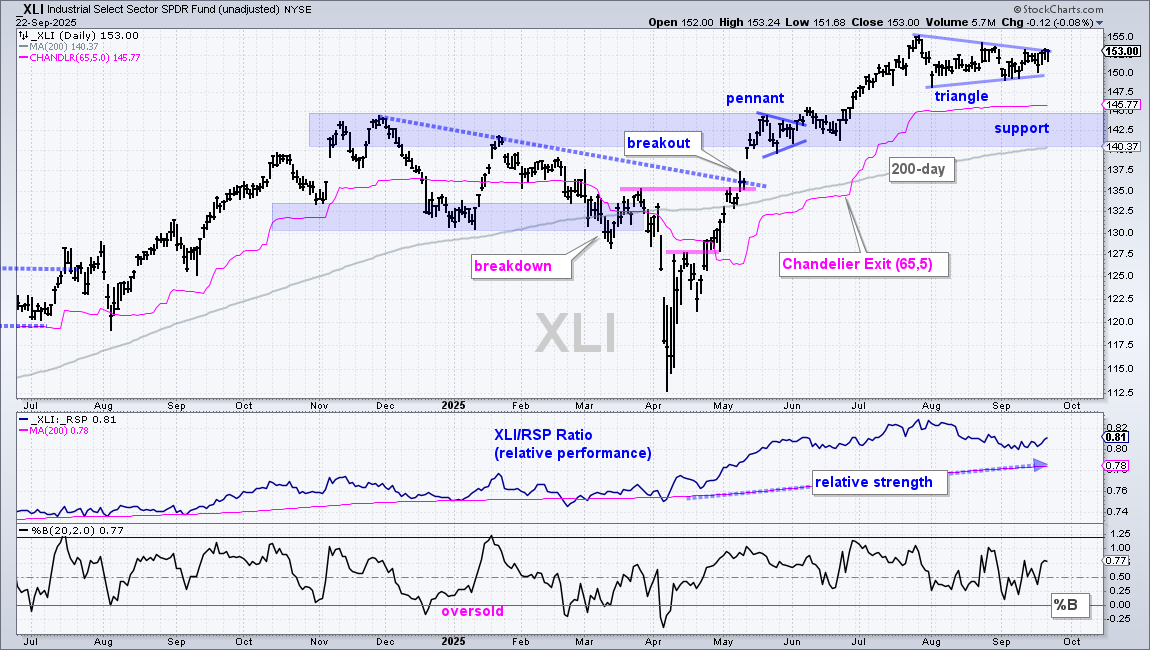
The next chart shows the Industrials SPDR (XLI) with a market leading advance from early April to late July. XLI broke out in mid May, formed a small pennant in late May, broke out in early June and surged in July. The ETF traded flag since late July as a triangle formed. This narrowing trading range is a consolidation within an uptrend, which is a bullish continuation pattern. XLI is on the verge of a breakout that would signal a continuation of the bigger uptrend. For reference, the pink line at 145.7 is the Chandelier Exit (65,5).
Aerospace & Defense Leads within XLI
The Aerospace & Defense ETF (ITA) is leading with a breakout in mid September and new highs last week. Note that Aerospace & Defense (26.52%) is the largest industry group within the Industrials sector. ITA surged from early August to July, formed a triangle into early September and broke out at 200. This breakout signals a continuation higher. The August-September lows mark a support zone in the 190-195 area (blue shading), the Chandelier Exit (65,5) is also in the 190 area.
Utilities SPDR Breaks Out
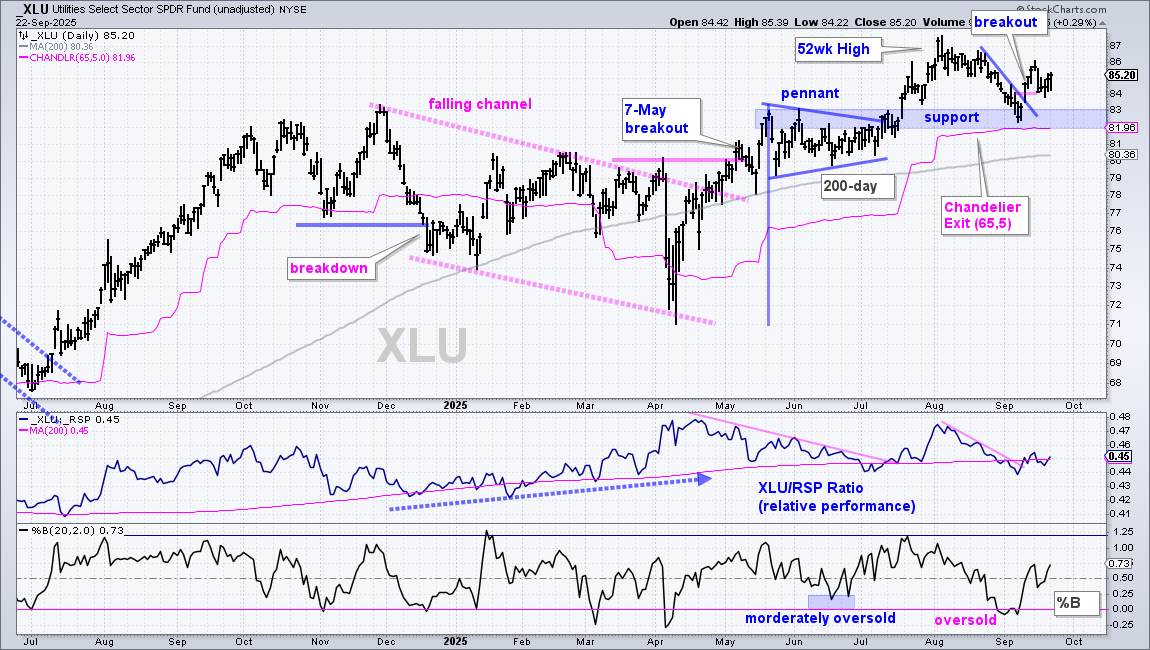
The Utilities SPDR (XLU) is in a strong uptrend, but not outperforming. On the price chart, XLU hit new highs in July and early August, and remains above the rising 200-day SMA. In the middle window, the price-relative (XLU/RSP ratio) is largely flat, which means XLU is performing in line (not outperforming, but not underperforming). XLU remains on my radar because of the clear uptrend. Most recently, the ETF fell back to the breakout zone and became oversold in late August and early September. This is a pullback within an uptrend, which is an opportunity. XLU broke out with a surge above 84 and view this as bullish (see report on September 11th[2]). The blue shading marks a support zone in the 82-83 area and the Chandelier Exit (65,5) is at 81.96.
Infrastructure ETF Forms Bullish Pennant
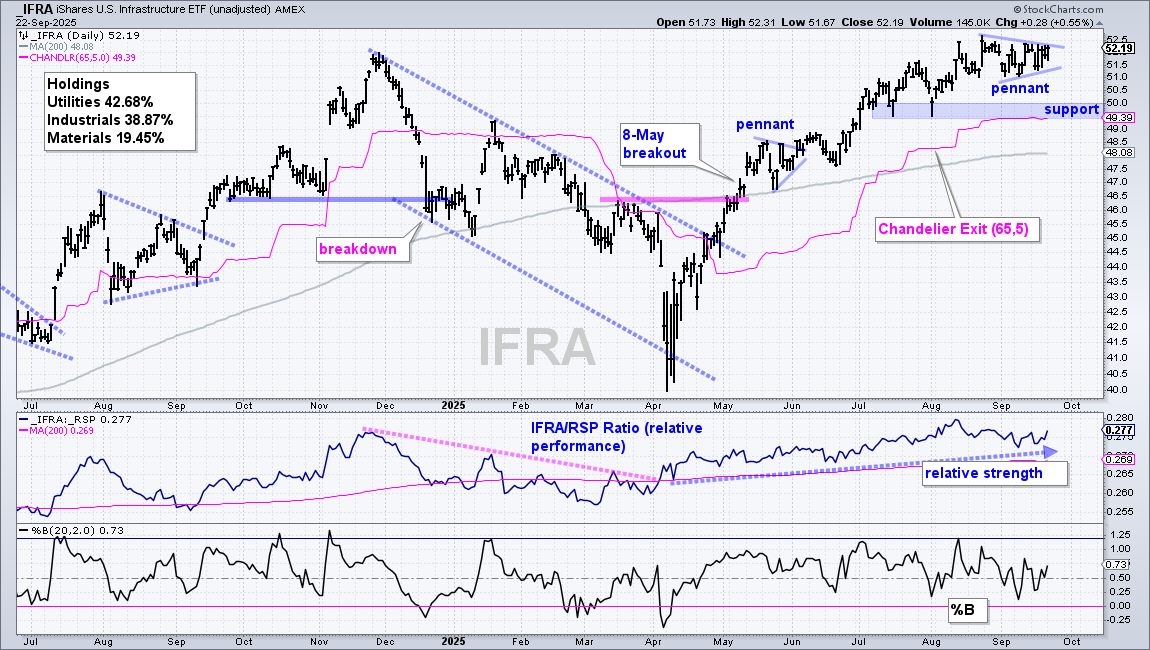
The next chart shows the Infrastructure ETF (IFRA) with a trend-reversing breakout on May 8th and a steady uptrend. The pullbacks since late May were short and shallow as buyers bought the small dips. Most recently, a pennant formed and this is a short-term bullish continuation pattern. A breakout at 52.5 would open the door to new highs. The July lows mark a support zone in the 49-50 area and the Chandelier Exit (65,5) is at 49.39. Note that the Infrastructure ETF (IFRA) is 42.68% Utilities, 29.87% Industrials and 19.45% Materials.
Uranium ETFs Surge
The Uranium ETF (URA) was featured on September 9th[3] as it broke out of a falling channel/flag. This was a classic setup: long-term uptrend, relative strength, oversold in mid August and bullish continuation pattern. URA broke out around 41 and is up over 20% since this breakout. This is perhaps a good time to lock in some profits and set a trailing stop for the remainder. The pink line shows the Chandelier Exit (65,5) at 44.18, for reference.
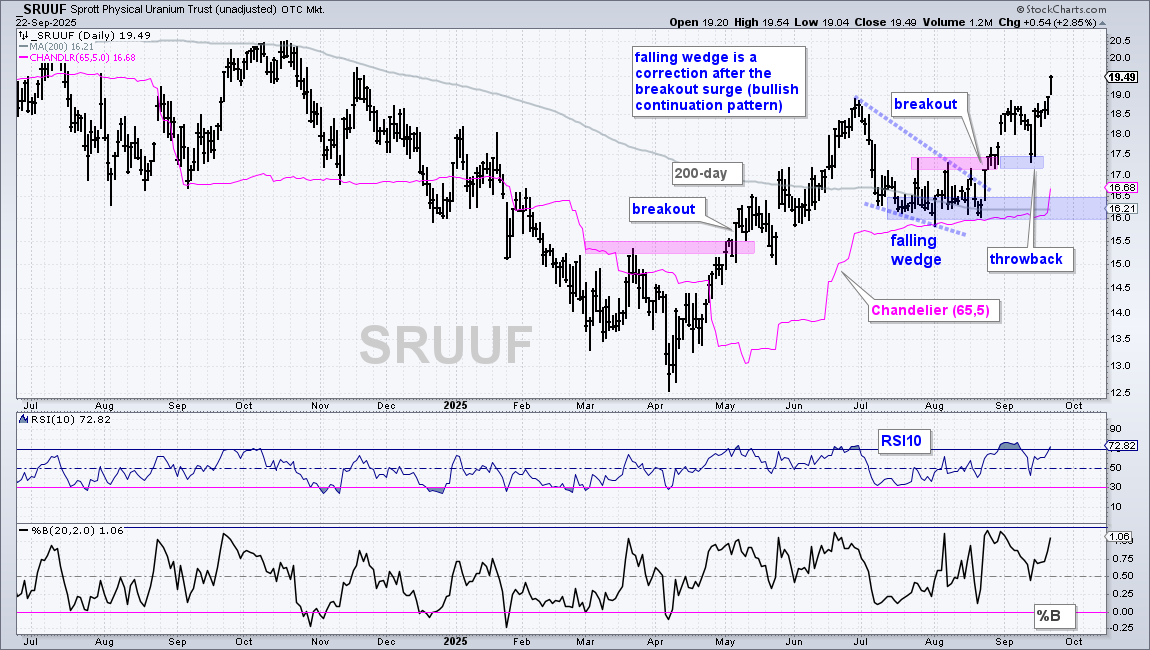
The next chart shows the Sprott Physical Uranium (SRUUF), which was first highlighted on August 28th[4] as it broke out of the falling wedge. I again featured SRUUF on September 13th[5] as it fell back to the breakout zone. Broken resistance turns first support and this throwback offered a second chance to partake in the breakout. The ETF surged over the last six days and exceeded its June high. I am leaving support in the 16-16.5 area (blue shading) and adding the Chandelier Exit (65,5) as a trend-following stop (currently 16.68).
Bitcoin Falls Sharply After Breakout
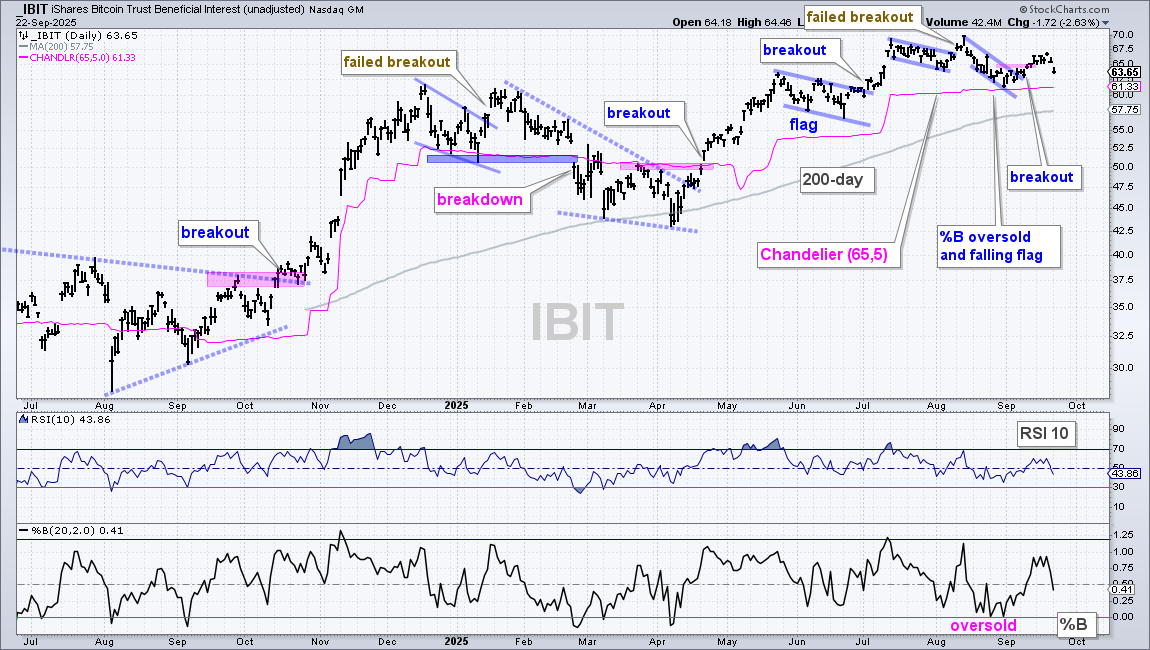
The Bitcoin ETF (IBIT) is struggling to hold its breakout as it fell around 5% the last two days. Long-term, the trend is up with a new high in mid August and price above the rising 200-day SMA. IBIT broke the falling flag line in early August and hit a new high, but did not hold this breakout as the ETF fell below the flag lows. Even though this failed breakout is short-term negative, it did not affect the long-term uptrend or trigger the Chandelier Exit (65,5). IBIT formed another falling flag into early September and broke out at 65 on the 11th.[3] This breakout is getting cold feet as the ETF fell 5% the last two days. However, this could be just a post-breakout throwback to shake out the weak hands. The flag lows hold the key (61). The pink line marks the Chandelier Exit (65,5) at 61.33 and a close below 61 would also negate the flag breakout.
DISCLAIMER: This content provided strictly for informational and educational purposes. It should not be interpreted as an offer to buy or sell any security, nor as a solicitation to engage in any investment activity. Nothing here constitutes a recommendation regarding any specific security, portfolio, transaction, or investment strategy.
At times, the author or affiliates may hold positions or interests in securities discussed. Any stocks or examples mentioned are not endorsements or suggestions to purchase. This material does not consider your individual financial goals or circumstances, and you should seek guidance from a qualified financial or investment adviser before making any trading or investment decisions.
Past performance does not guarantee future results.
Send feedback to support(at)trendinvestorpro.com or use the contact form. [6]