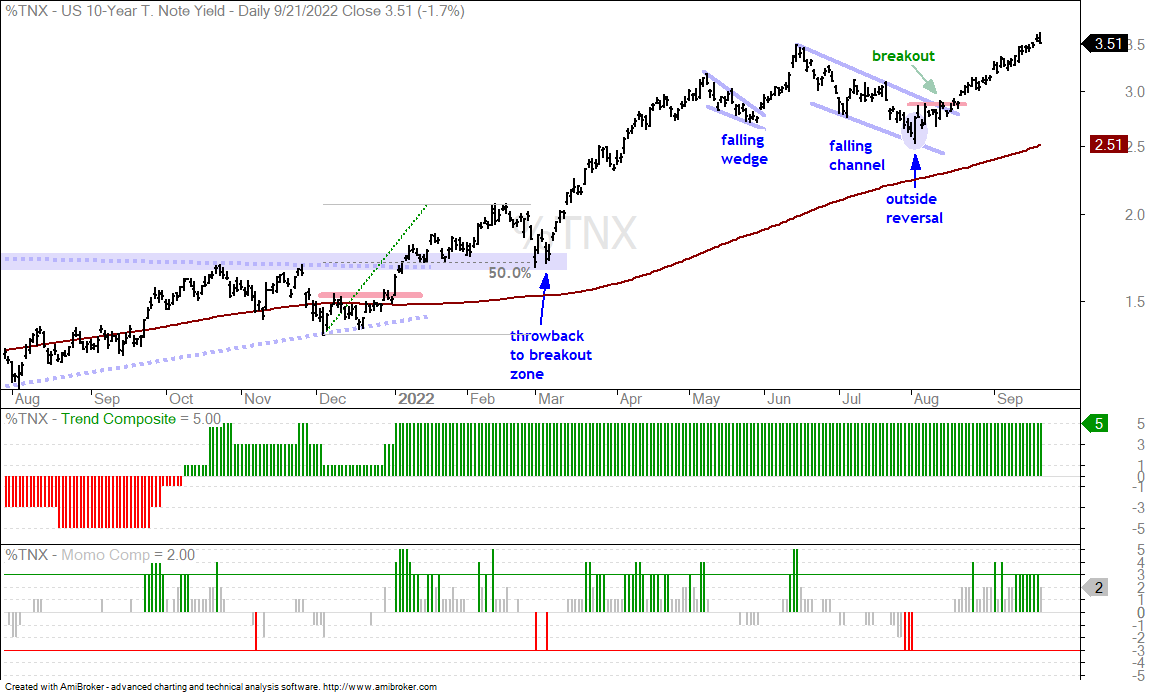
The Fed has come and gone, and the ugliness in the markets remains. Stocks fell sharply on Wednesday as SPY lost 1.79%. Bonds bounced with a sequence of sell-the-rumor (rate hike) and buy-the-news (actual hike). Sell short on the prospect of rate hikes and cover when the big hike occurs. The 20+ Yr Treasury Bond ETF (TLT) fell some 14% since early August and surged 1.68% on Wednesday. Even so, the long-term trend for TLT is down and the long-term trend for the 10-yr Treasury Yield is up. The chart below shows the 10yr hitting 3.5% and getting short-term extended.
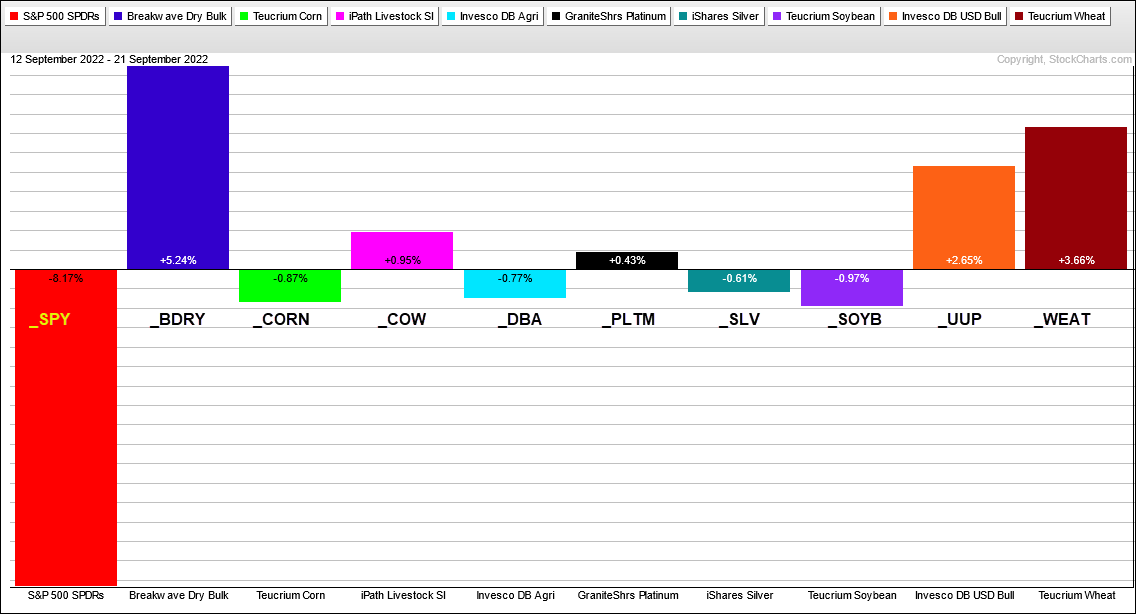
The stock market regime remains bearish and most stock-based ETFs are influenced by the bear market. SPY is down 8.17% in seven days and all US stock-based ETFs in the master list are down over this period. The same is true over the last two days with SPY down 2.87%. Correlations tend to rise when short-term and long-term trends align in the bear market and this is what we are seeing now with stocks. ETFs with gains over the last seven days include: BDRY, WEAT, UUP, COW, TLT and PLTM. SLV, CORN, SOYB and DBA are holding up relative well because they fell less than 1%.
Programming Note: I will post a strategy article later today. This will cover the Composite Breadth Model signals, a comparison to the 5/200 cross and a strategy to add some beta to the signals.
About the ETF Trends, Patterns and Setups Report
This report contains discretionary chart analysis based on my interpretation of the price charts. This is different from the fully systematic approach in the Trend Composite strategy series. In this ETF Trends, Patterns and Setups report, I am looking for leading uptrends and tradable setups within these uptrends. While I use indicators to help define the trend and identify oversold conditions within uptrends, the assessments are mostly based on price action and the price chart (higher highs, higher lows, patterns in play). Sometimes the chart assessment can be at odds with the indicators.
This Week's Commentary Schedule
Tuesday – 13 September: Market-ETF Report and Signal-Rank Table Update
Wednesday – 14 September Market-ETF Video and Market Regime Update
Thursday – 15 September: Market-ETF Report and Signal-Rank Table Update
Saturday – 17 September: ETF Signal and Rank Table
You can learn more about my chart strategy in this article[1] covering the different timeframes, chart settings, StochClose, RSI and StochRSI.
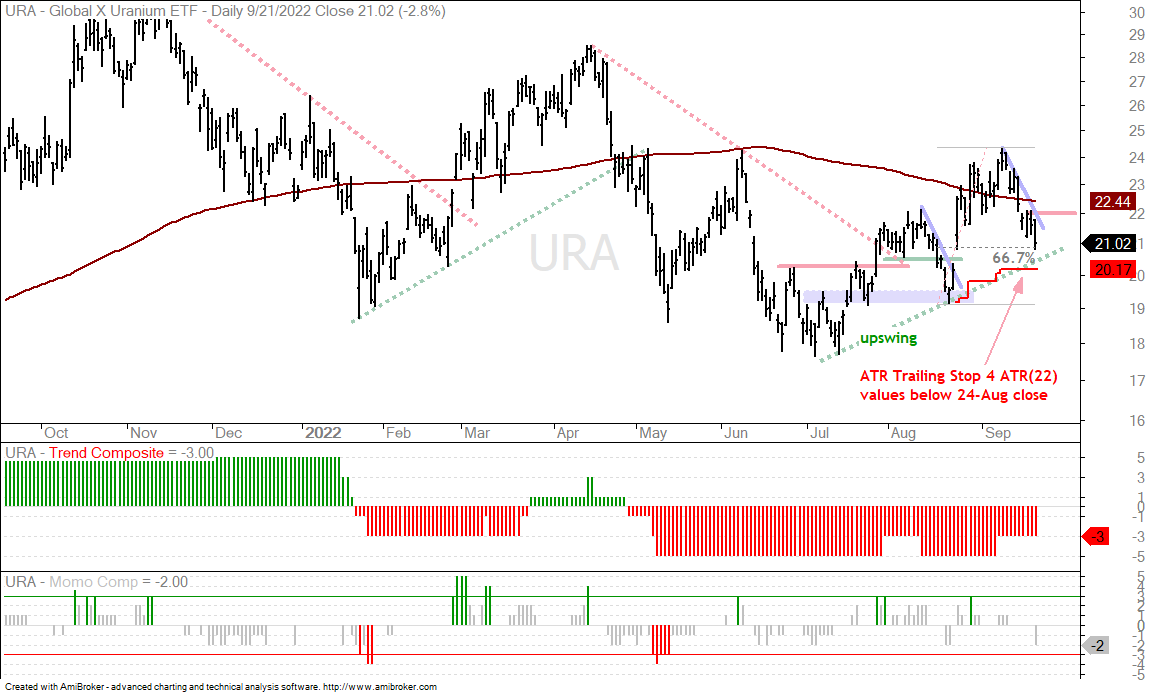
A Pullback within an Upswing for Uranium ETF (URA)
The Uranium ETF (URA) was not immune to broad market weakness over the last 7 days as it fell back to the 21 area. Overall, the swing is still up since July and the the ETF remains with a series of higher highs and higher lows the last two months. With an 11.90% decline the last eight days and a 67% retracement of the prior advance, the ETF is short-term oversold and trading in a short-term reversal zone. A breakout at 22 would reverse this downswing and keep the bigger upswing alive (green dashed line). The red line marks the ATR Trailing Stop at 20.17 and a close below this level would call for a re-evaluation of this two month upswing.
The Momentum Composite aggregates signals in five momentum-type indicators to identify short-term overbought and oversold conditions. This indicator is part of the TIP Indicator Edge Plugin for StockCharts ACP[2]
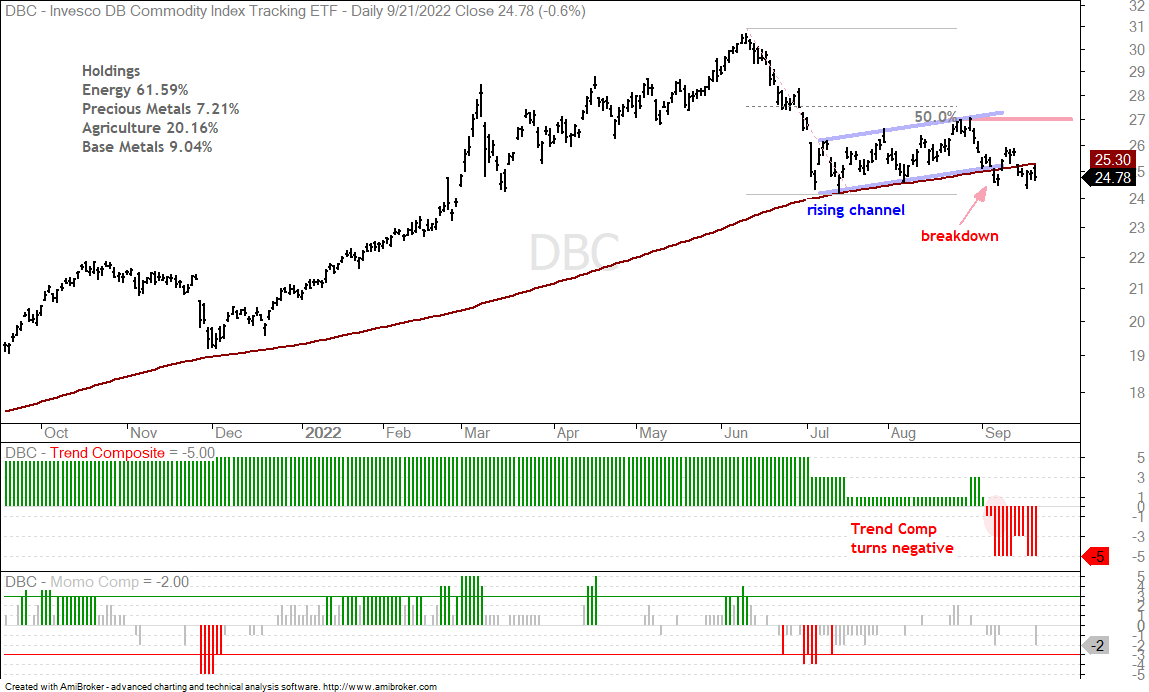
DB Commodity ETF Breaks Down (DBC, DBE)
The going remains tough for the DB Commodity ETF (DBC) as it broke channel support in early September and the Trend Composite turned negative. DBC is dominated by energy and the DB Energy ETF (DBE) is dominated by the oil complex (West Texas Intermediate, Brent and Gasoline). DBC fell sharply from mid June to mid July and then retraced half with a rising channel. The retracement amount and the pattern are typical for corrective bounces after sharp declines. The channel break reverses the upswing and signals a continuation of the June-July decline.
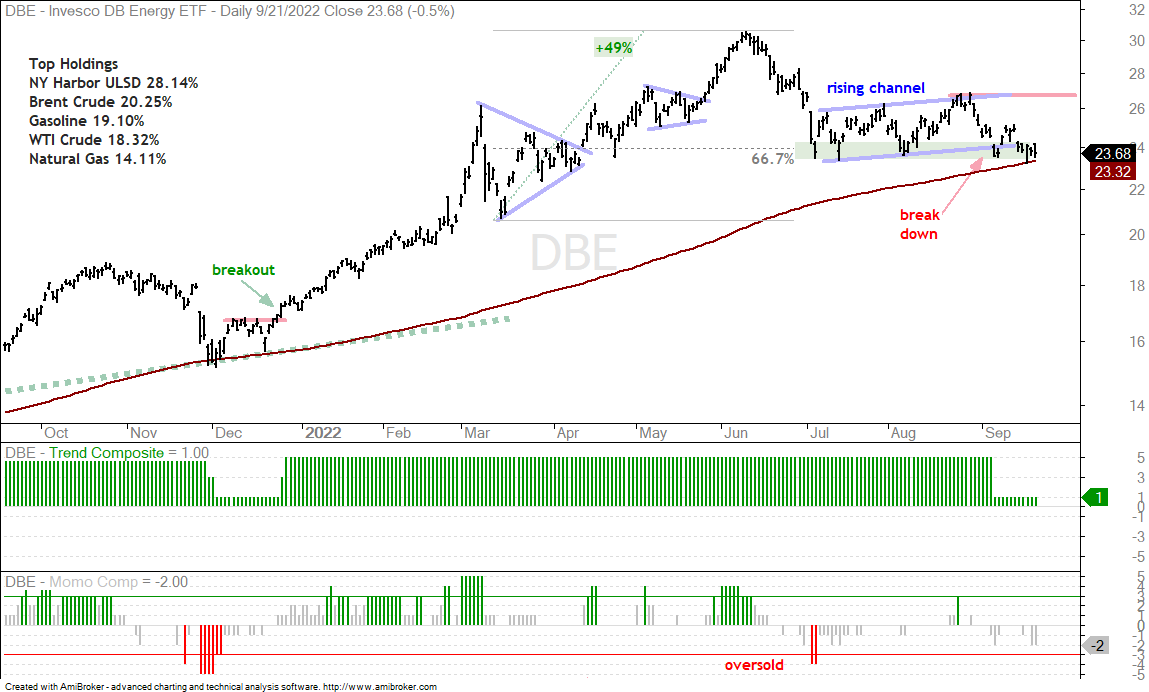
The next chart shows the DB Energy ETF (DBE) with similar characteristics: sharp decline into July and channel break in early September. Even though the Trend Composite is still positive, oil and gasoline are in downtrends since mid June and these two account for some 85% of the ETF.
You can learn more about exit strategies in this post[3], which includes a video and charting options for everyone.
Palladium ETF Grinds Higher (PALL)
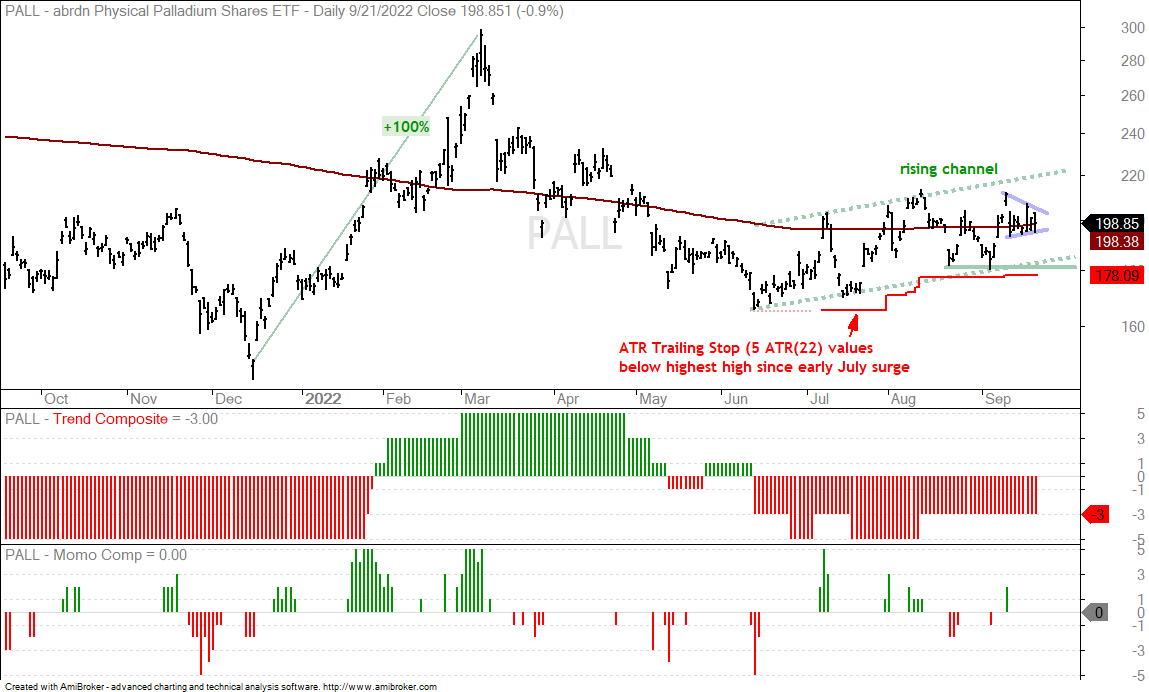
The Palladium ETF (PALL) is one of the better performing commodity ETFs since mid June. Oil, copper and gold are down over the last three months, but the Palladium ETF (PALL) is up around 14% since June 21st. The chart shows an upswing since mid June with the green dashed lines marking the higher highs and higher lows. The red line marks the ATR Trailing Stop and this coincides with the August-September lows. A close below 178 would break the channel and call for a re-evaluation. Most recently, PALL surged in early September and then formed a small pennant (blue lines). A pennant breakout would be short-term bullish.
The Trend Composite aggregates signals in five trend indicators: Bollinger Bands (125,1), Keltner Channels (125,2), 5-day Rate-of-Change of 125-day SMA, StochClose (125,5) and CCI-Close (125). The Trend Composite and ten other indicators are part of the TIP Indicator Edge Plugin for StockCharts ACP[2]
Silver ETF Breaks Out of Pennant (SLV)
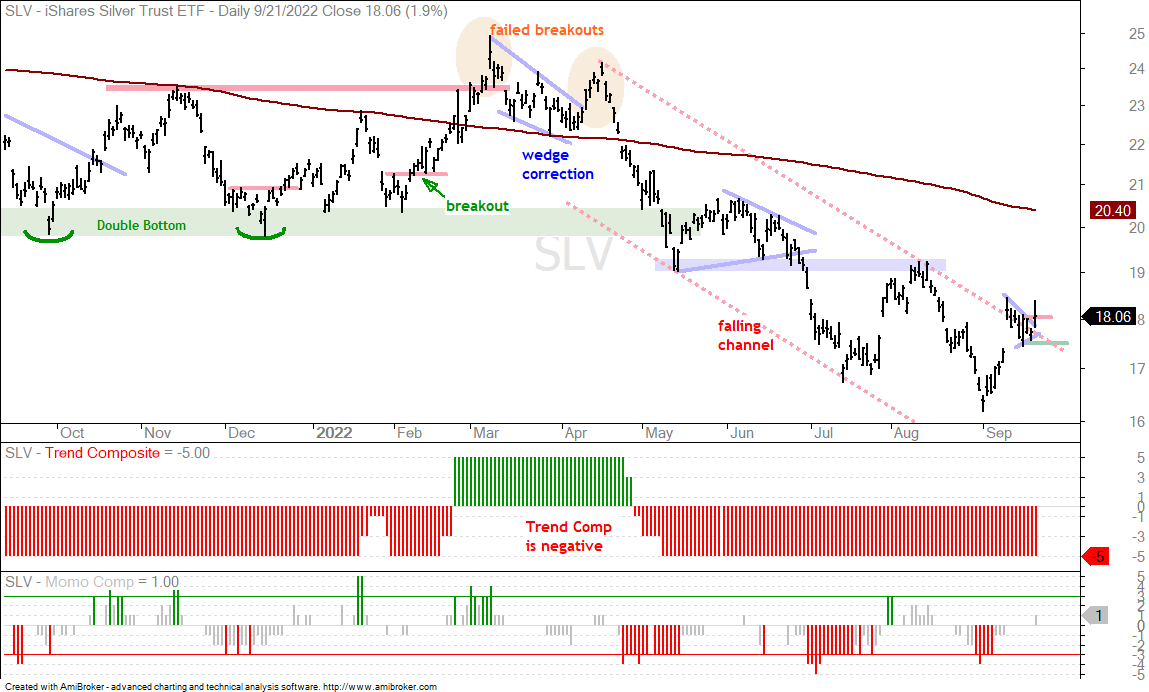
The Silver ETF (SLV) is in a long-term downtrend, but the ETF held up better than gold in September and broke out of a small pennant on Wednesday. The chart shows the red dashed lines defining the downswing and SLV is breaking above the upper line. This is not a HARD resistance level though. SLV caught my eye because it surged and consolidated with a pennant, which is a short-term bullish continuation pattern. SLV is in the process of breaking out and I am marking re-evaluation support at 17.50 (green line).
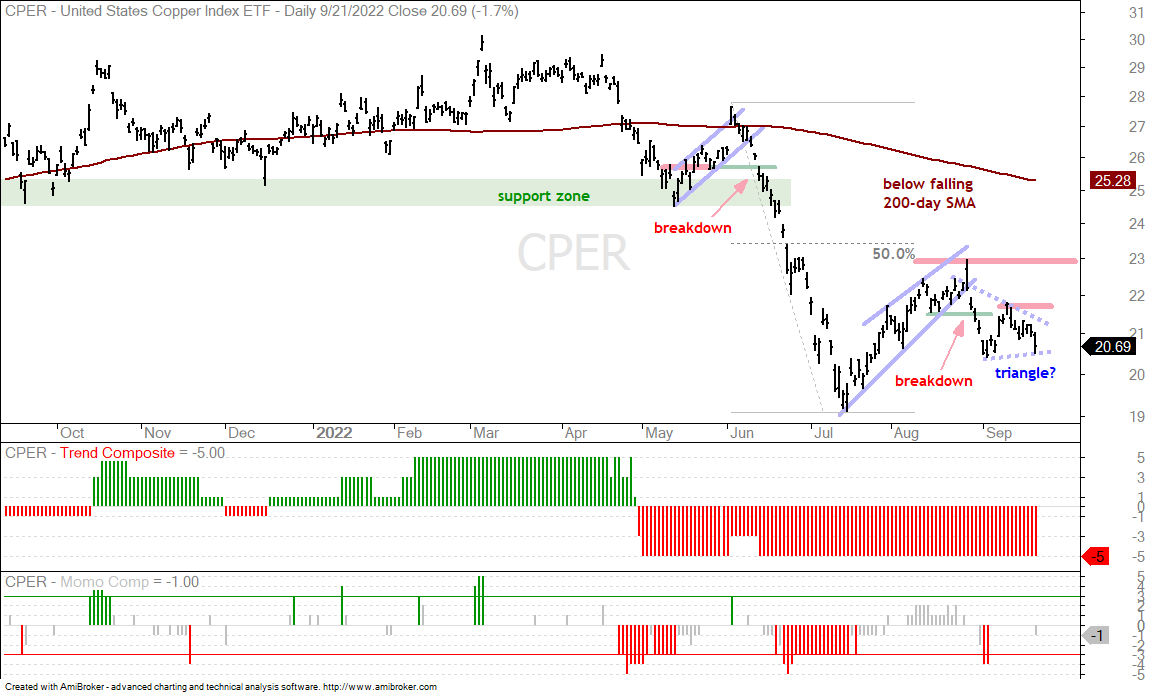
Copper ETF Establishes Resistance (CPER)
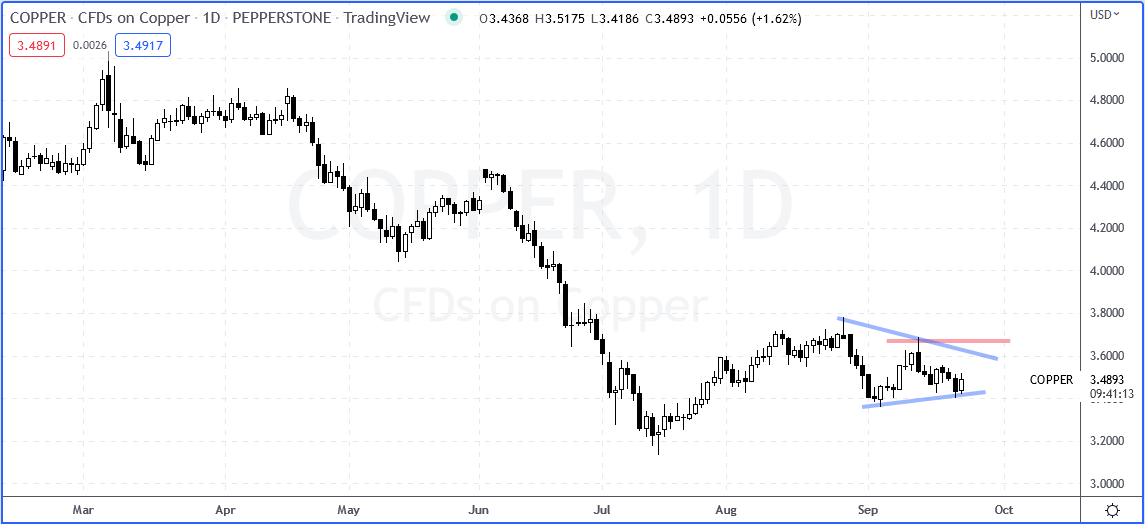
Before looking at the Copper ETF (CPER), I will first shows Spot Copper (COPPER1!). Copper caught my attention because it advanced from mid July to late August and a possible bullish consolidation (triangle) is forming. In addition, copper has so far held above the early September low and is showing some short-term relative strength. An advance from current levels and a break above the mid September high would be bullish.
The next chart shows the Copper ETF (CPER) breaking down in late August and holding this breakdown. The ETF bounced after the breakdown and then fell back towards the early September low. As with spot copper, CPER has yet to break the early September low and a triangle consolidation could be forming (blue dashed lines). This triangle represents a rest after the July-August advance and a break above the mid September high would be short-term bullish.
Why all of the sudden copper? Well, copper futures are around 1.4% higher in early trading on Thursday and there is chatter on the coming copper shortage[4]. Yes, what you read can affect your analysis. Note that copper is currently in bear mode and the onus is on the bulls to prove the bears wrong. This means a break above the mid September higher is needed to get the bull ball rolling.
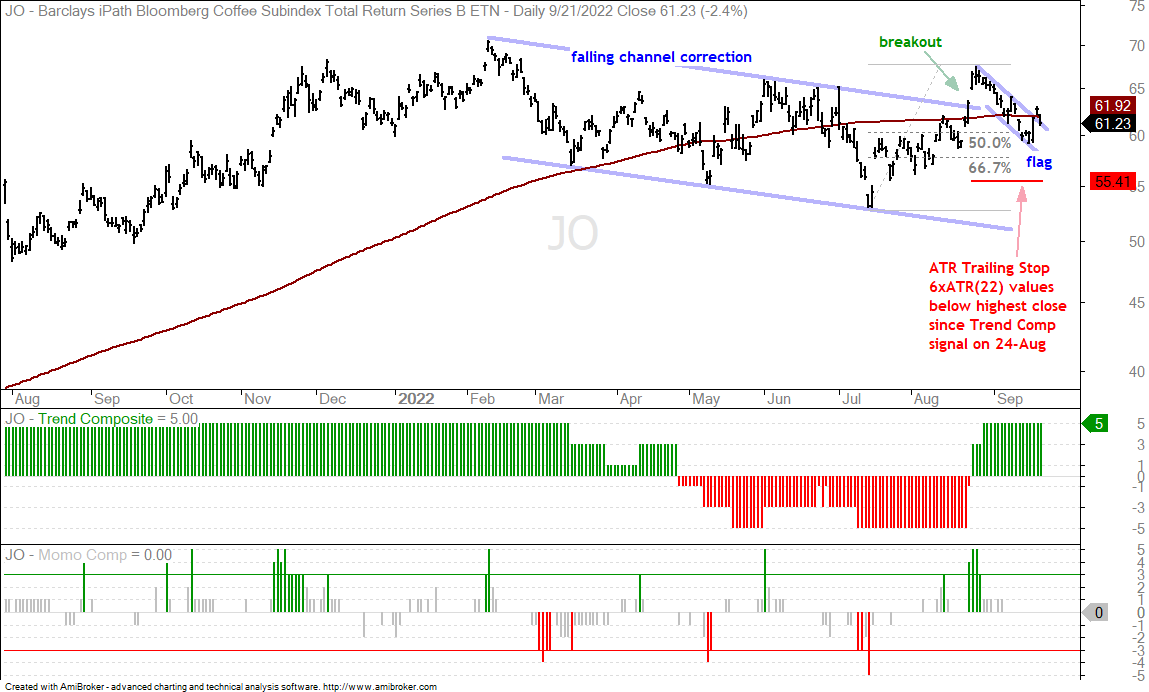
Coffee ETF Breaks Out of Bull Flag (JO)
The Coffee ETF (JO) is making short-term waves with a flag breakout on Tuesday. The chart below shows JO with a channel breakout in late August and a bullish Trend Composite signal. The red line shows the ATR Trailing Stop for reference. Short-term, the ETF fell back into the channel with a pullback that retraced 50-67% of the prior advance. Both the retracement amount and pattern are typical for corrections. JO broke the flag line with a surge on Tuesday and then fell back a little on Wednesday. This is still a commodity with a monthly annualized standard deviation of 32.67% (above average risk). Other standard deviations are: SPY 24.10%, QQQ 29.18%, URA 58.44% and IBB 29%.
You can learn more about the ATR Trailing Stop and exit strategies in this post[3], which includes a video and charting options for everyone.