After becoming very oversold on Tuesday, stocks bounced on Wednesday with the major index ETFs gaining around 2%. Today’s report will put these bounces into context. We will show the difference between bullish setups in harmony with the bigger force and bullish setups not in harmony with the bigger force. There are dozens of bullish setups out there, but the force is not with most of them. I am more inclined to focus on bullish setup with the force behind them. We will also cover uranium, palladium and gold.
About the ETF Trends, Patterns and Setups Report
This report contains discretionary chart analysis based on my interpretation of the price charts. This is different from the fully systematic approach in the Trend Composite strategy series. In this ETF Trends, Patterns and Setups report, I am looking for leading uptrends and tradable setups within these uptrends. While I use indicators to help define the trend and identify oversold conditions within uptrends, the assessments are mostly based on price action and the price chart (higher highs, higher lows, patterns in play). Sometimes the chart assessment can be at odds with the indicators.
This Week's Commentary Schedule
Tuesday – 16 August: Market-ETF Report and Signal-Rank Table Update
Wednesday – 17 August Market-ETF Video and Market Regime Update
Thursday – 18 August: Market-ETF Report and Signal-Rank Table Update
Saturday – 20 August: ETF Signal and Rank Table
You can learn more about my chart strategy in this article[1] covering the different timeframes, chart settings, StochClose, RSI and StochRSI.
Major index ETFs Get an Oversold Bounce
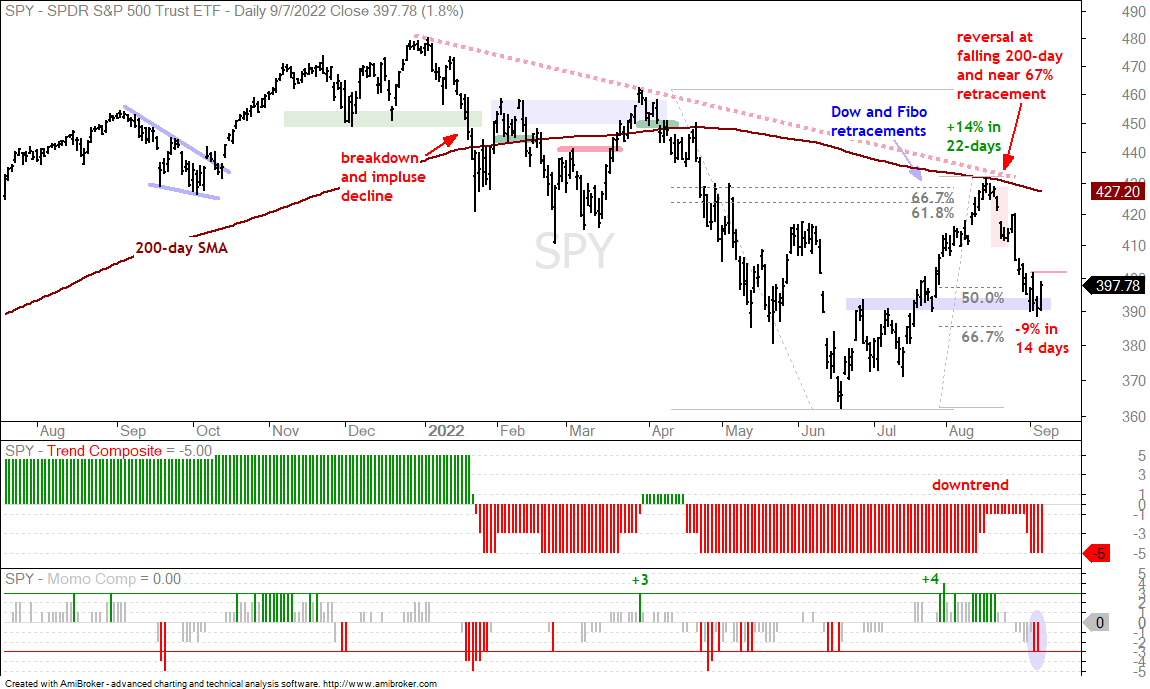
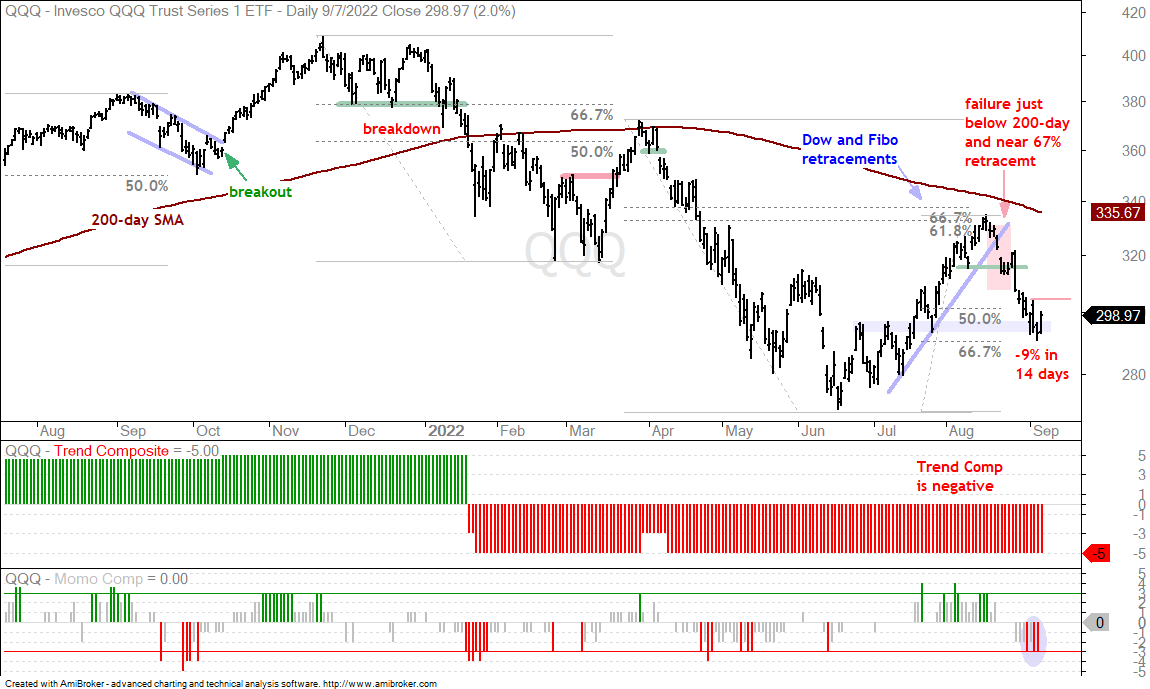
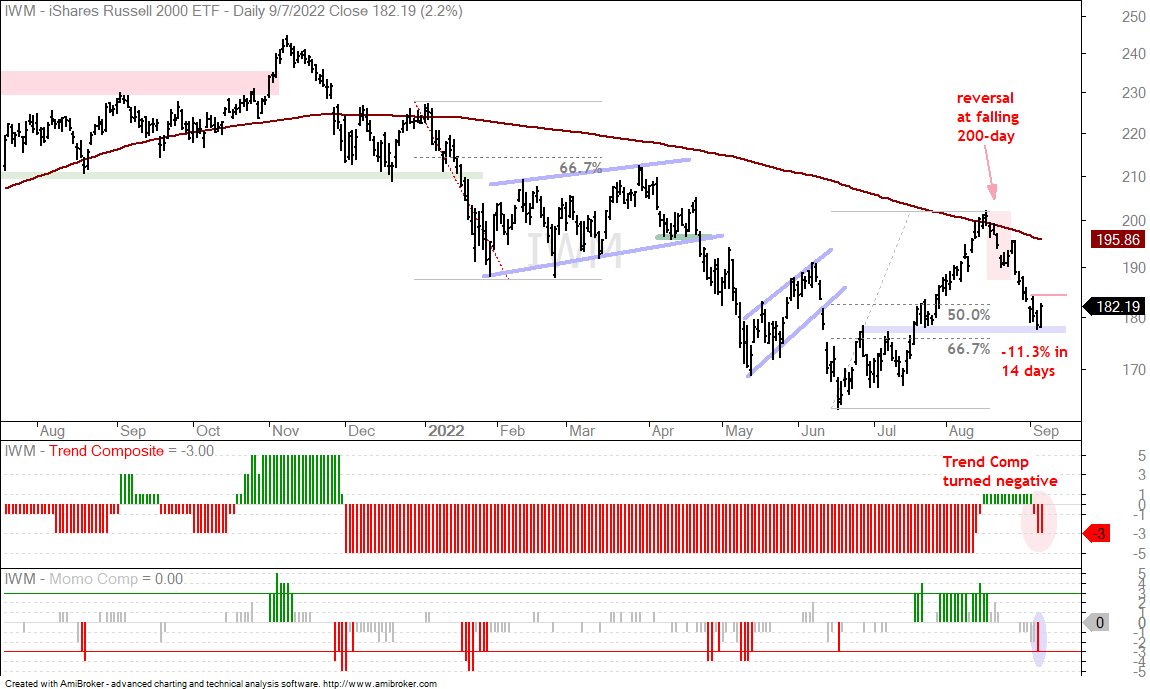
The major index ETFs got an oversold bounce on Wednesday with SPY gaining 1.8%, QQQ rising 2% and IWM advancing 2.2%. These are solid one-day gains, but still within the context of long-term downtrends and within a bear market. All three were quite oversold on Tuesday after SPY and QQQ fell 9% in 14 days, and IWM dropped 11.28%. The Momentum Composites for all three were also oversold as they reached -3 (see blue ovals in bottom windows)
At this point, we just have a one day oversold bounce within a short-term downtrend, which is three weeks old. This is actually the second up day in the last four. Perhaps a short-term trend change is in the making and a break above Friday’s high (red line) would forge the first higher high (short-term). Even though a higher high would technically reverse the short-term downtrend, I would not consider this a robust signal because the bigger trends are down.
The Momentum Composite aggregates signals in five momentum-type indicators to identify short-term overbought and oversold conditions. This indicator is part of the TIP Indicator Edge Plugin for StockCharts ACP[2]
Two Types of Short-Term Bullish Setups
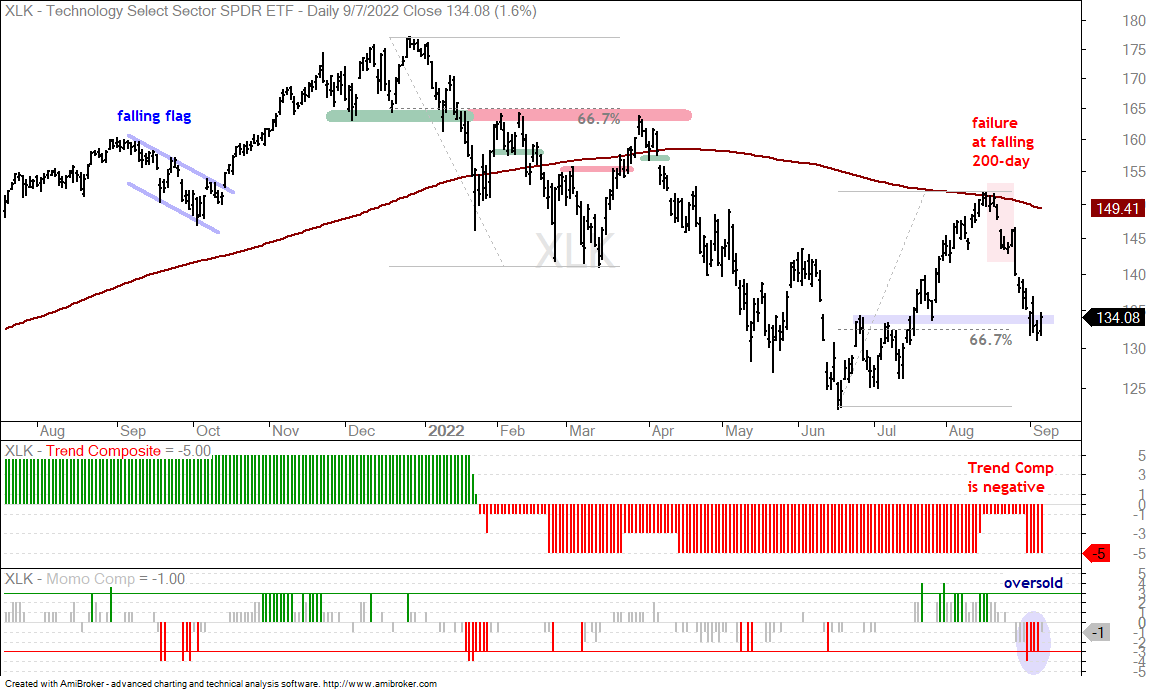
A bullish setup usually involves an oversold condition, a short-term bullish pattern and/or a support-reversal zone. There are two types of oversold conditions. First, there are oversold conditions within a bigger uptrend and a bull market environment. This is the ideal oversold condition. Second, there are oversold conditions within a bigger downtrend and in a bear market environment. Oversold conditions on Tuesday occurred within a bigger downtrend and in a bear market. This condition is less than ideal. The chart below shows the Technology SPDR (XLK) with the Momentum Composite becoming oversold four of the last five days. However, the long-term trend is down and we are in a bear market. These are the dominant forces at work.
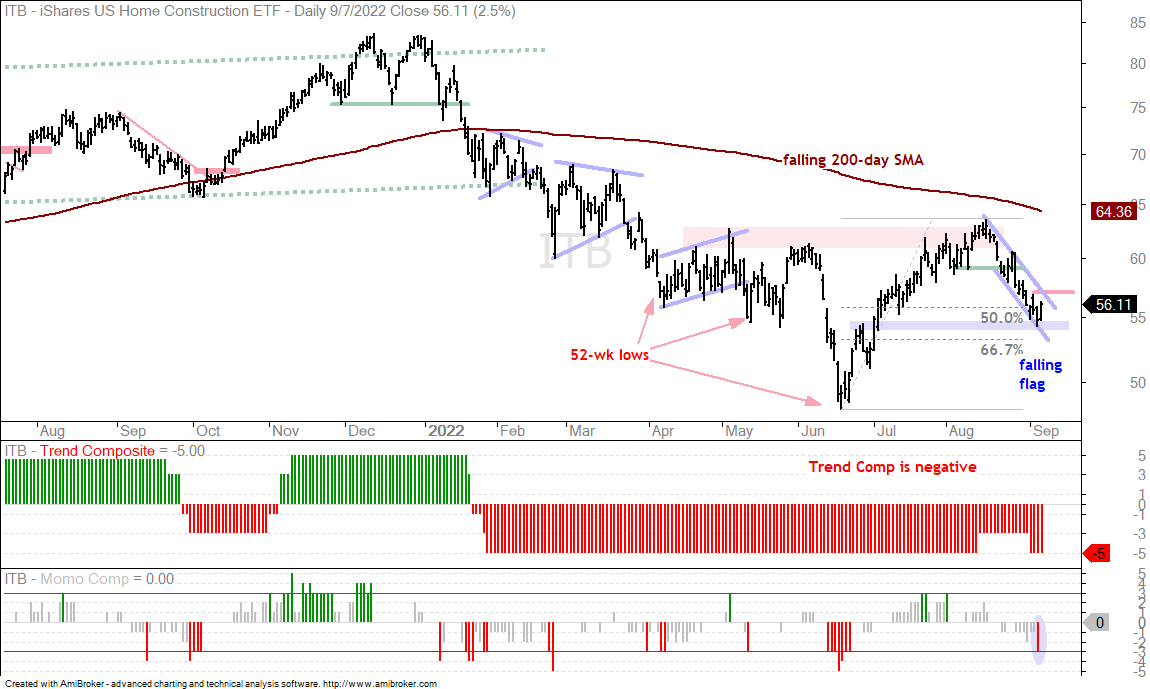
The same goes for short-term bullish patterns, such as falling flags and wedges. A falling flag or falling wedge is a short-term correction that forms after a sharp advance. It is important, however, that this sharp advance occur within a bigger uptrend and within a bull market environment. A lot of ETFs formed falling flags and wedges with their declines over the last three weeks, but these same ETFs are below their falling 200-day SMAs, their Trend Composites are negative and they recorded 52-week lows in June or July. The chart below shows the Home Construction ETF (ITB) hitting a new low in June and failing below the falling 200-day in mid August. A falling flag could be forming, but this pullback is rather deep and the bigger downtrend is the dominant force.
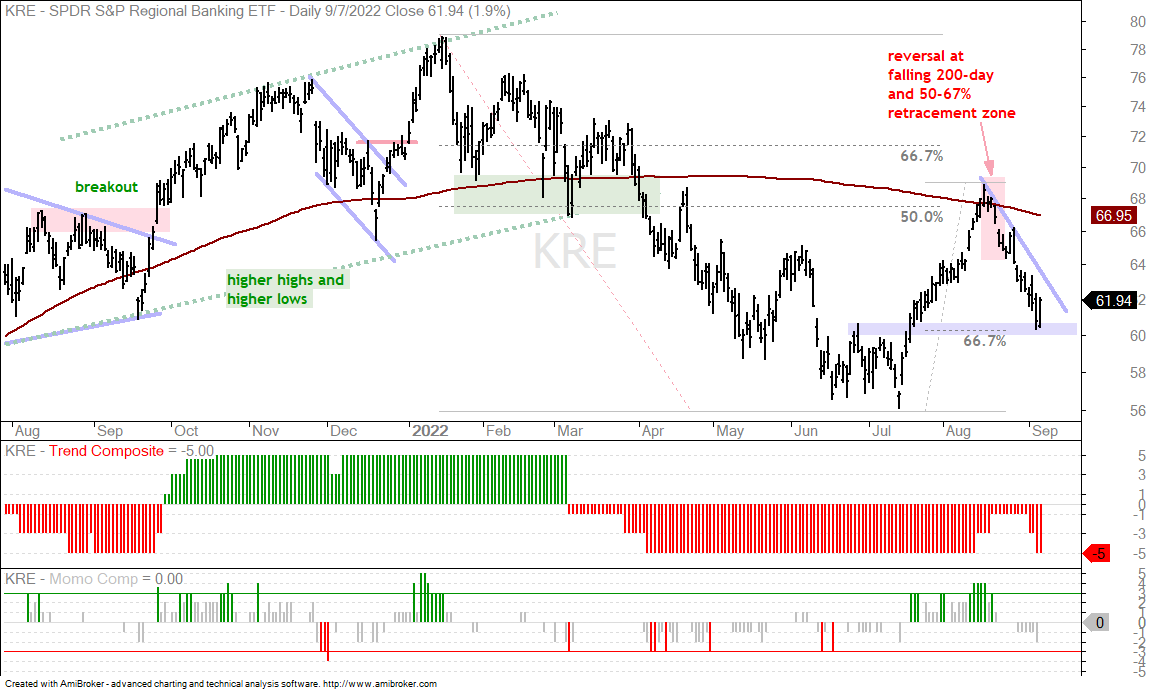
The same goes for support-reversal zones. A support zone firms when price returns to a prior resistance zone, which turns into first support. A 50 to 67 percent retracement of the prior advance marks a potential reversal zone. Together, broken resistance and the 50 to 67 percent retracements mark the support-reversal zone. Again, we are seeing lots of ETFs trading in support-reversal zones. However, these same ETFs are in long-term downtrends and we are in a bear market. The chart below shows the Regional Bank ETF (KRE) falling over 10% from its August high and hitting a support-reversal zone around 60. As far as the long-term force at work, the ETF hit a new low in July, failed at the falling 200-day and the Trend Composite remains negative.
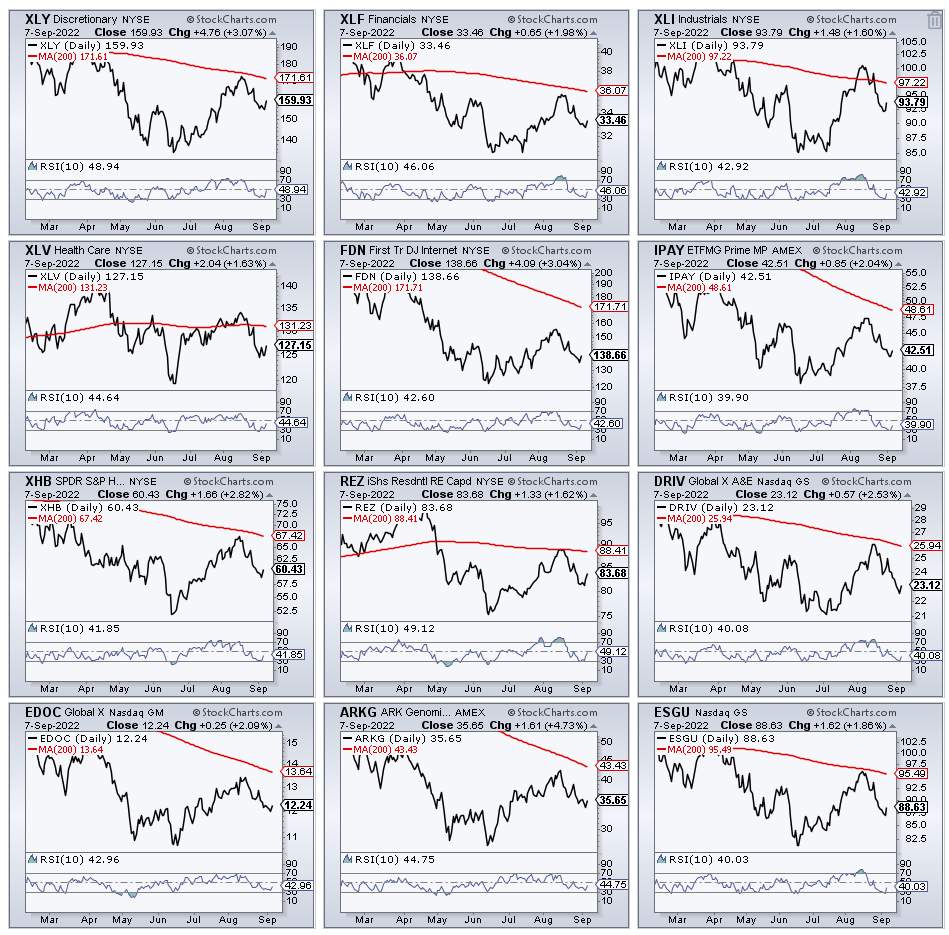
There are well over a dozen ETFs with charts similar to SPY, QQQ, IWM, XLK, ITB and KRE. These ETFs hit 52-week lows in June or July, surged into mid August, failed near their falling 200-day SMAs and fell the last three weeks. Their Trend Composite are also negative. These ETFs have short-term bullish setups, but the force is not with them. The force refers to the long-term trend (down) and the market regime (bearish). These ETFs include XLY, XLF, XLI, XLV, FDN, IPAY, XHB, REZ, DRIV, EDOC, ARKG and ESGU
You can learn more about exit strategies in this post[3], which includes a video and charting options for everyone.
Bull Flags and Wedges in Clean Energy (TAN, ICLN, ACES)
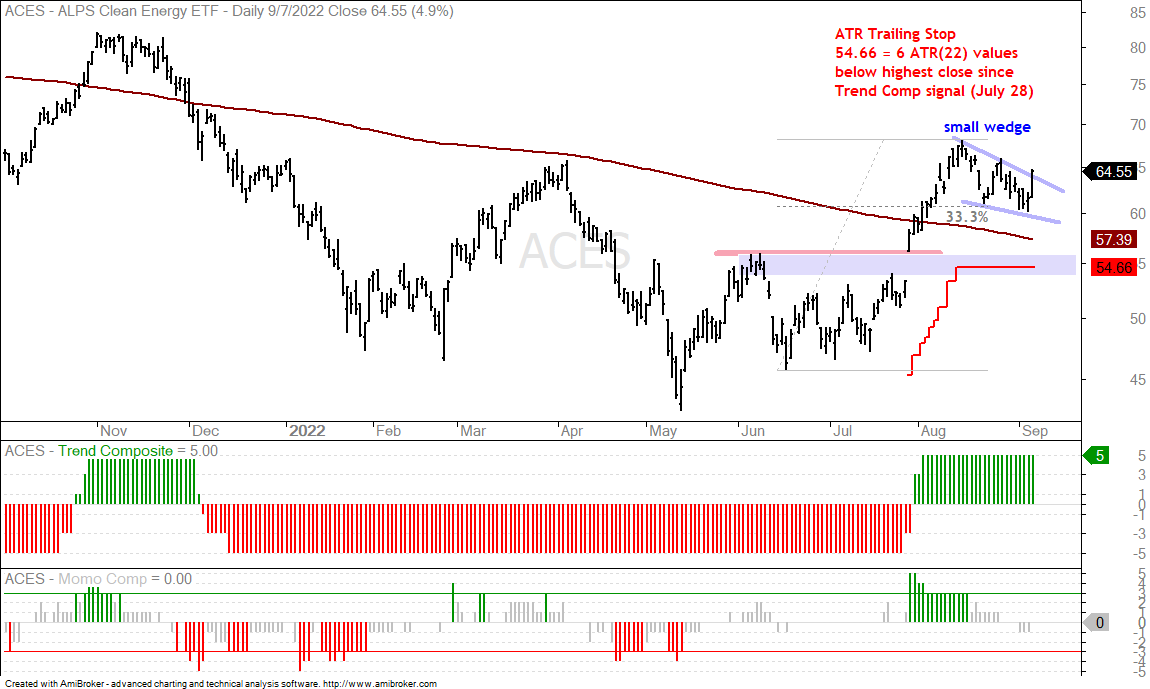
The bullish setups in the clean energy ETFs are different from the bullish setups in the ETFs shown above. First and foremost, these clean energy ETFs are in uptrends and they exceeded their March highs. They are still stock-based ETFs and we are still in a bear market, but these are the leaders and they are in uptrends until proven otherwise. We can also see short-term relative strength because their pullbacks over the last three weeks were much shallower than the pullbacks seen in the ETFs above. All three fell back with the broader market, but they retraced less than half of their prior advances.
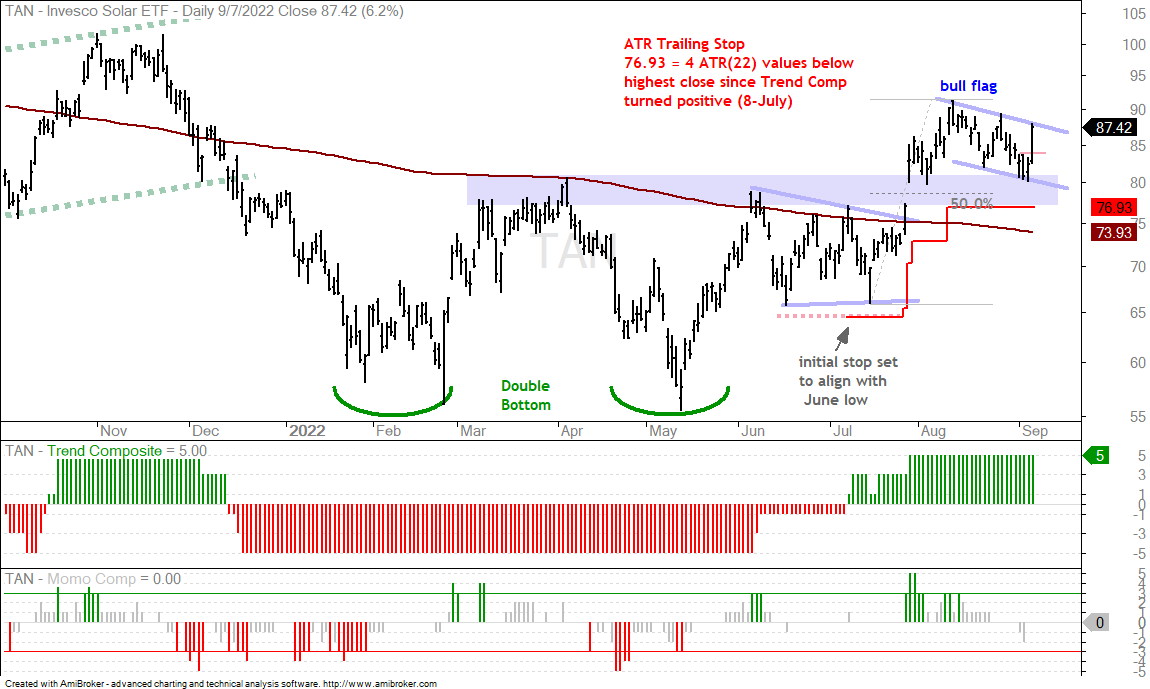
The first chart shows the Solar Energy ETF (TAN) with the Trend Composite turning bullish on July 8th and the ATR Trailing Stop (4xATR(22)) starting on the date of this signal. TAN exceeded its March high with the surge into August and then formed a falling flag into early September. The flag decline is much shallower than those shown above and TAN retraced less than half of the prior advance. The flag is a bullish continuation pattern and a breakout would argue for further gains.
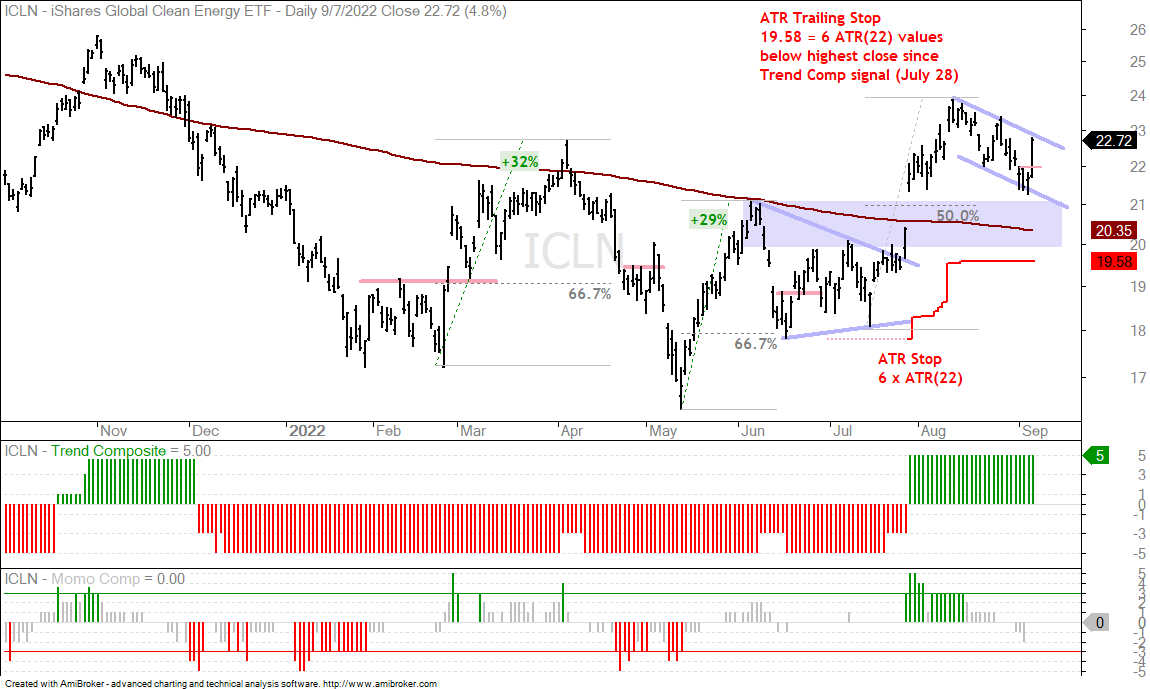
The next chart shows the Global Clean Energy ETF (ICLN) with a similar setup. The red line within the flag marks short-term resistance based on the seven day downswing, which ended on Tuesday. This is the swing within the flag and the short-term breakout increases the odds of a flag breakout.
The Trend Composite aggregates signals in five trend indicators: Bollinger Bands (125,1), Keltner Channels (125,2), 5-day Rate-of-Change of 125-day SMA, StochClose (125,5) and CCI-Close (125). The Trend Composite and ten other indicators are part of the TIP Indicator Edge Plugin for StockCharts ACP[2]
XLU Breaks out of Falling Flag
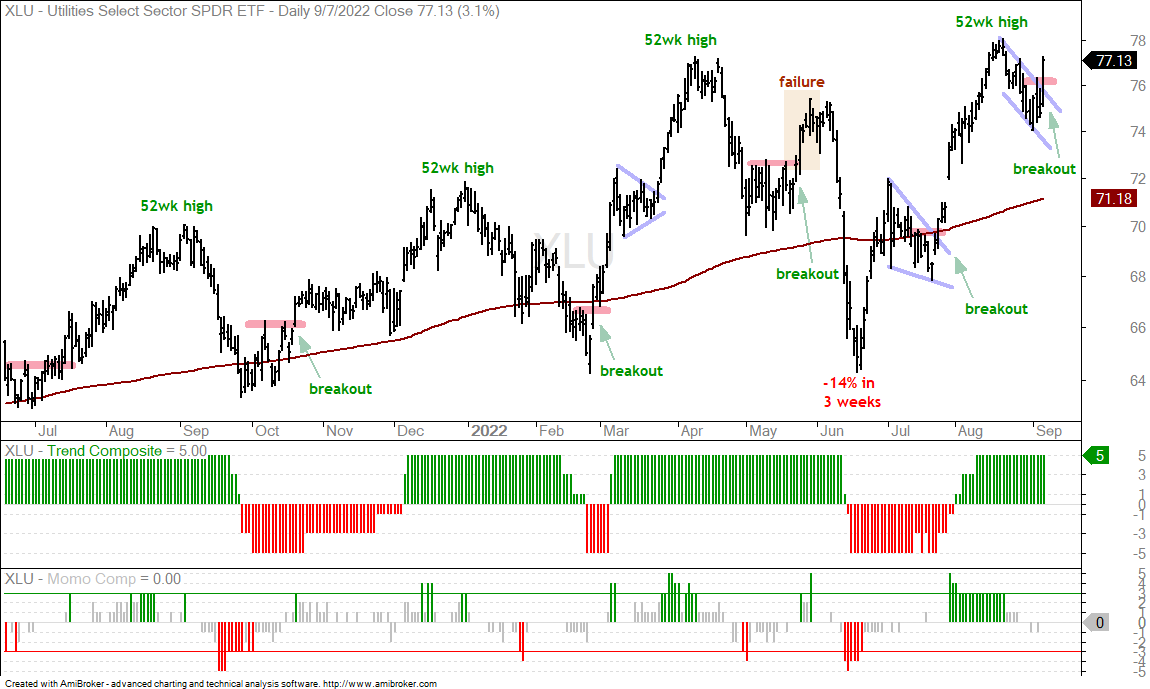
The Utilities SPDR (XLU) is also one of the strongest ETFs in the market right now. Overall, the ETF sports a choppy uptrend over the past year with some pretty deep dips in late September (2021), February and June. These dips broke the 200-day SMA and turned the Trend Composite bearish, but XLU moved to new highs after each deep dip. The trend indicators are whipsawing and of little help. A chart reading shows that the overall trend is up with XLU breaking out of a bull flag with a 3.1% surge on Friday. This breakout is bullish as long as 74 holds. The green arrows mark prior breakouts and the yellow shading shows a failed breakout in May. Also note that XLU was not immune to the June swoon as it fell 14% in three weeks.
DB Energy ETF Plunges along with Oil (DBE)
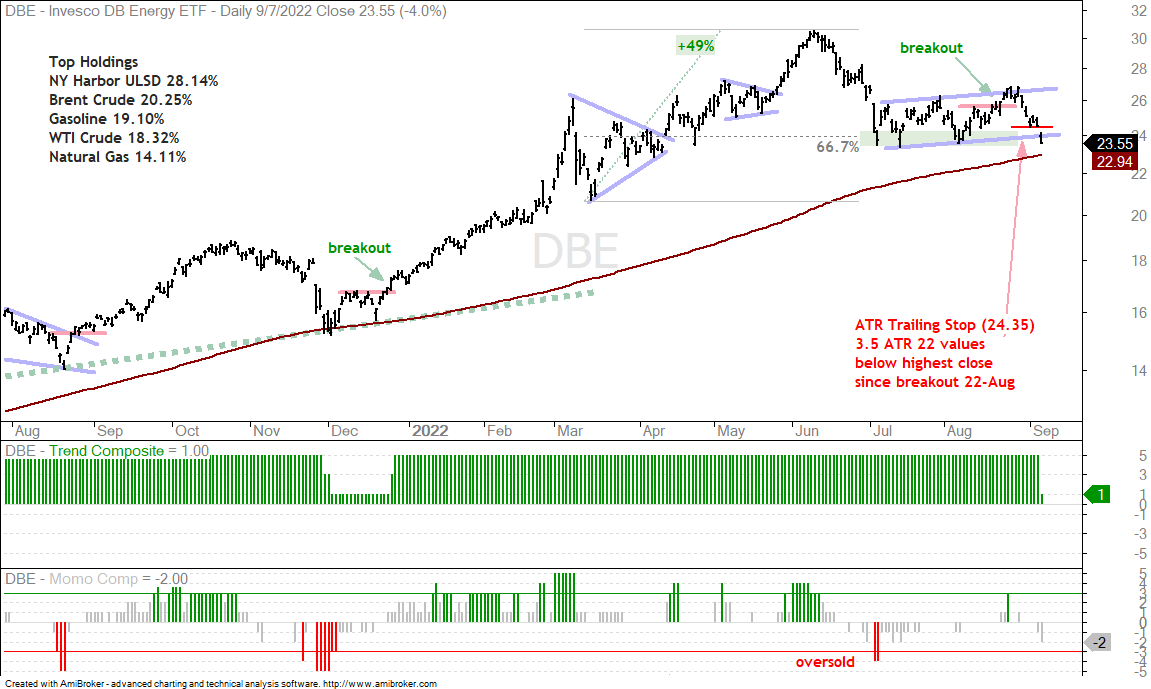
Oil fell over 5% on Wednesday and this pushed the DB Energy ETF (DBE) below the August lows. This move also triggered the ATR Trailing Stop. Overall, DBE fell sharply from mid June to early July, consolidated with a rising channel and broke channel support with a sharp decline the last six days. This is similar to the pattern at work in the DB Commodity ETF (DBC), which was featured on Tuesday[4]. Even though DBE is above the rising 200-day and the Trend Composite is positive, this channel break and lower low are negative.
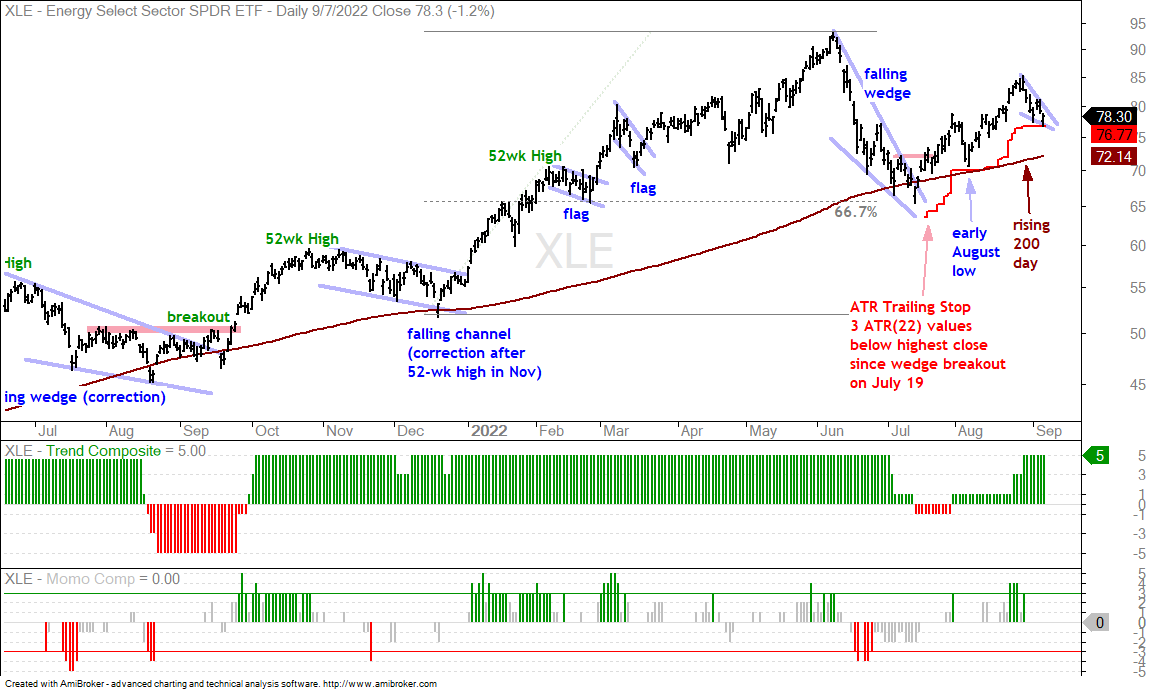
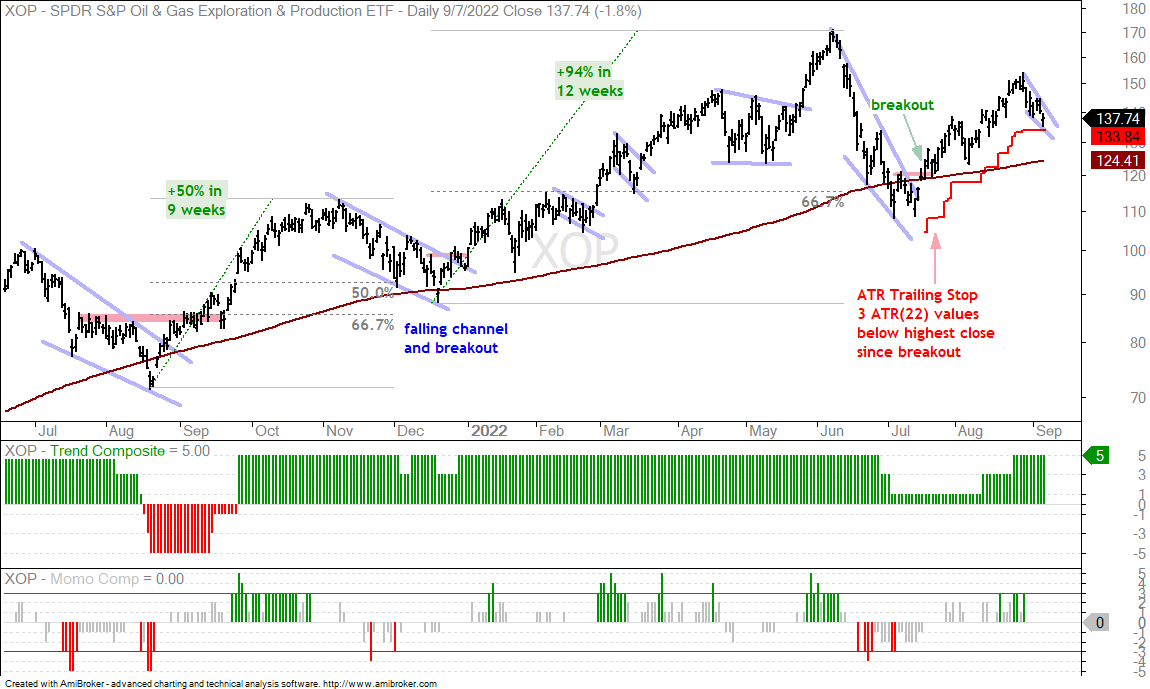
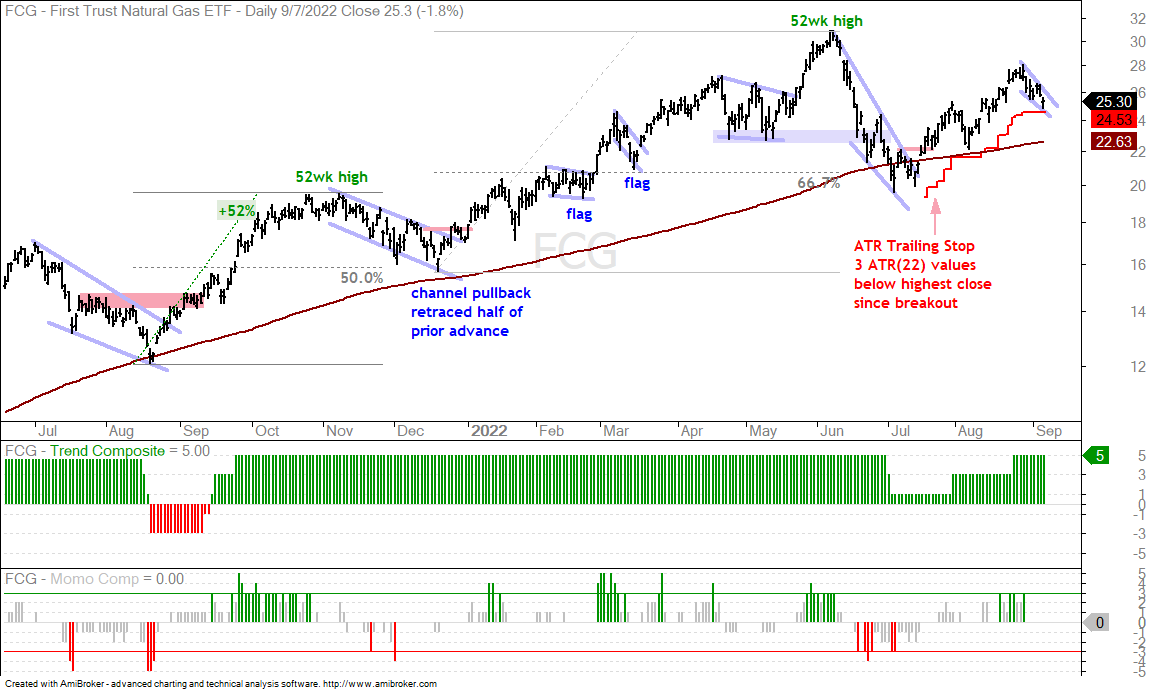
Energy ETFs Form Small Wedge Corrections (XLE, XOP, FCG)
The energy-related ETFs are holding up relatively well considering the plunge in oil and weakness in stocks the last three weeks. The Energy SPDR (XLE), Oil & Gas Exploration & Production ETF (XOP) and Natural Gas ETF (FCG) fell the last seven days and formed small falling wedges. They are just above their ATR Trailing Stops (3 x ATR(22)) and this is the moment of truth. The small wedges are viewed as pullbacks within the bigger uptrends and breakouts would be bullish.
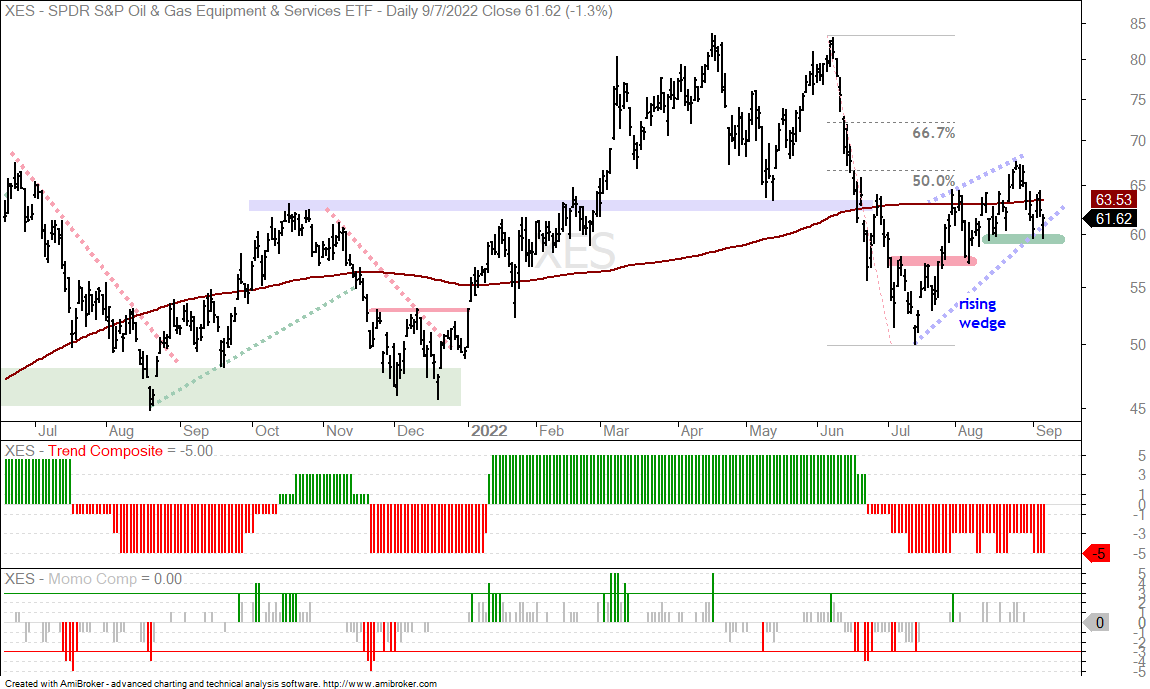
Monitoring the Wedge in the Oil&Gas Equip&Services ETF (XES)
The Oil & Gas Equipment & Services ETF (XES) is also at its moment of truth. The trend since mid July is up, but a rising wedge is taking shape and the bounce retraced around 50% of the prior decline. Both the pattern and retracement amount are typical for counter-trend bounces. The bulls have the edge as long as the wedge rises. A break below the mid August lows would reverse this short-term uptrend and signal a continuation of the June-July decline.
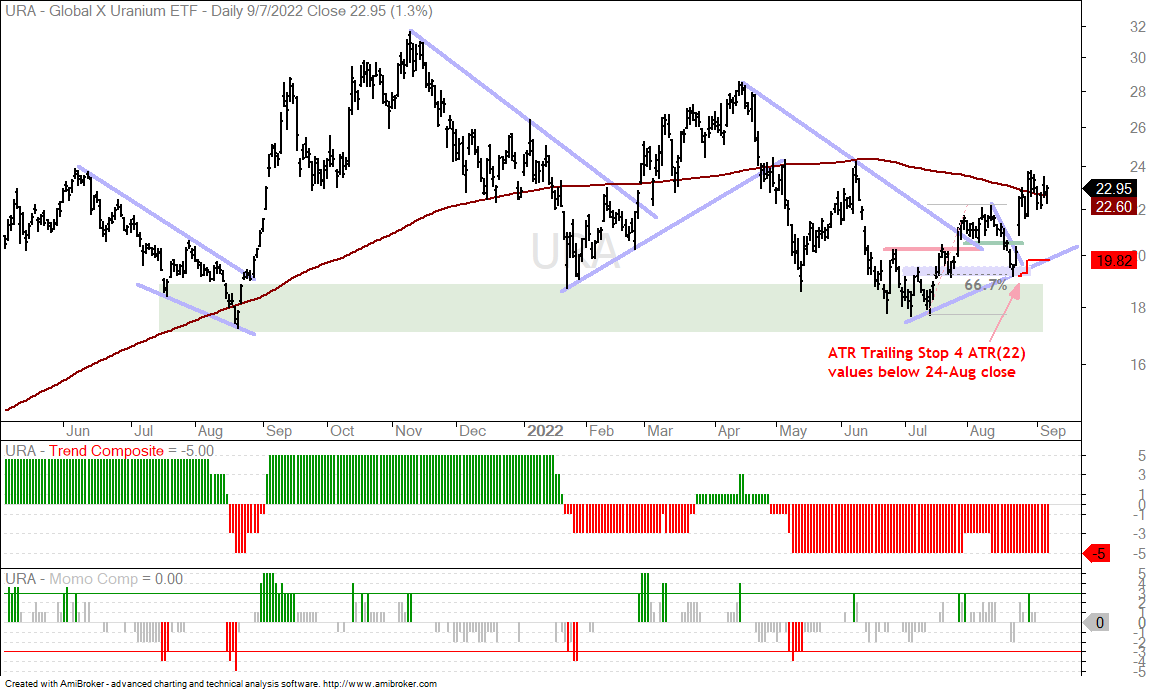
Uranium ETF Consolidates at 200-day (URA)
The Uranium ETF (URA) is one of the best performing ETFs over the last three weeks (since mid August). URA broke its mid August highs with a surge in late August and then consolidated around the 200-day SMA. The swing since July is up with a higher low in August and higher high in early September. URA seems to be about the swings and I will stay bullish on this one as long as the upswing holds. The red line marks the ATR Trailing Stop at 19.82 for reference.
You can learn more about the ATR Trailing Stop and exit strategies in this post[3], which includes a video and charting options for everyone.
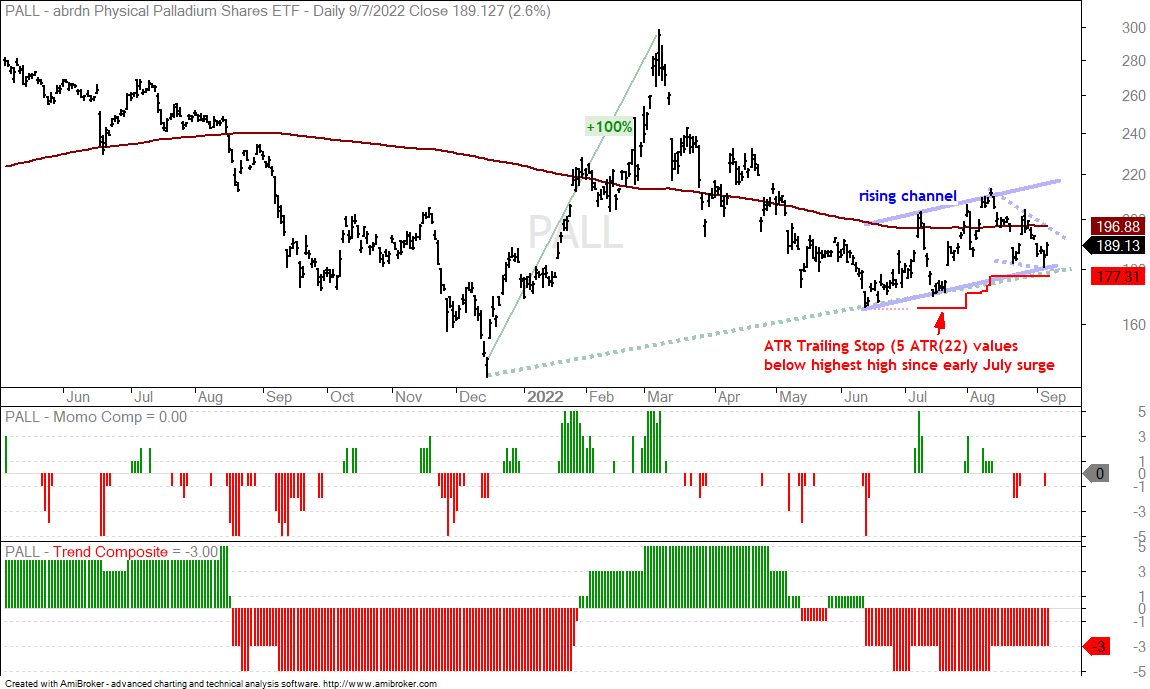
Palladium ETF Holds its Uptrend (PALL)
The Palladium ETF (PALL) is also holding up better than other metals because it did not break to new lows the last few weeks. PALL has been working, and I do mean working, its way higher since the mid June low. The metal was not immune to broad market weakness as it fell the last three weeks and reached a moment of truth. The smaller falling wedge within this channel represents the short-term downtrend and a break above 200 would be short-term bullish. Further weakness below 177 would trigger the ATR Trailing Stop and break support from the rising channel. This would be bearish and signal a continuation of the March-June decline.
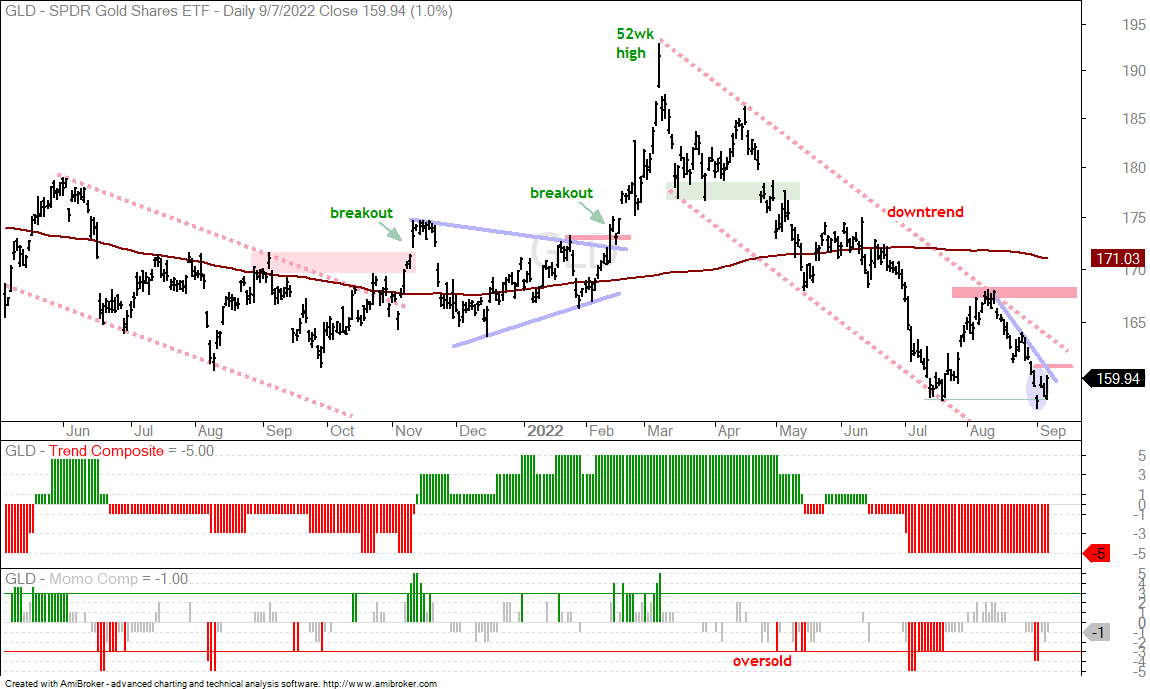
Gold SPDR Firms at July Low (GLD)
The Gold SPDR (GLD) remains at an interesting juncture as it tests the July lows. Keep in mind that the long-term trend is down and GLD did not hold up that well over the last three weeks. Nevertheless, GLD is making some short-term noise as it attempts to firm and reverse near the July low. First, the ETF broke the July low and then immediately rebounded (blue shading). Second, GLD fell sharply on Tuesday and then surged on Wednesday. A break above 161 would reverse the short-term downswing.