Agribusiness ETF Defends Breakout with Strong Upturn after Throwback
- Arthur Hill, CMT
Welcome to the Chart Fix!
Chartists missing a breakout can watch for a “throwback”, which offers a second chance to partake in the breakout. A throwback occurs when price breaks out, extends higher and then pulls back to the breakout zone, which turns first support. Price then turns back up and resumes its breakout. Today’s report will show a successful throwback and strong upturn in the Agribusiness ETF (MOO).
Recent Reports and Videos at TrendInvestorPro
- Gold Hits Setup Zone – Copper Leads – Blockchain Breakout
- Oil-Energy Lead – Utes Hit Bullish Zone – Small-caps Correct
- Breadth Deteriorates, but Models Still Bullish – Yields Surge
- Tech-AI Lead in Rolling Rotation – Breakouts Hold for QQQ, XLK…
- Click here to take a trial and gain full access. [3]
MOO Ends Correction and Resumes Long-term Uptrend
The first chart shows daily bars over the last 13 months. I use this chart to establish the long-term trend and identify bigger patterns at work. MOO surged from November to February, corrected into June and broke out with a surge in early July. This breakout is long-term bullish because it signals an end to the correction and a resumption of the 25% advance. New highs are expected in the coming weeks/months.
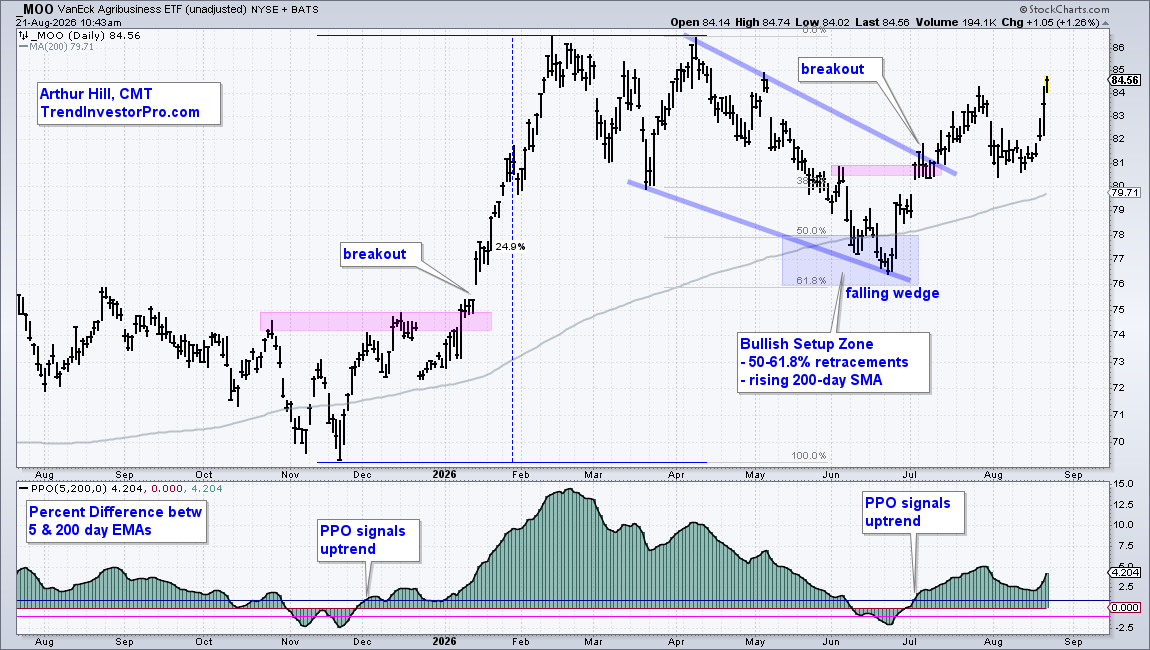
The indicator window shows the PPO(5,200,0) to identify the long-term trend. Keep in mind that all moving average based indicators lag and are prone to whipsaws. An uptrend signals with a move above 1% and a downtrend with a move below -1%. The PPO moved above +1% in early July to signal a long-term uptrend. This confirms the price breakout on the price chart.
TrendInvestorPro focuses on tradable pullbacks within bigger uptrends. We use retracements, the 200-day SMA, broken resistance levels and other tools to identify Bullish Setup Zones, which are areas to watch for firming and a reversal. Recent setups included the BlockChain Tech ETF and the Physical Uranium ETF.
Click here to take a trial and gain full access. [3]
A Successful Throwback and Strong Upturn
The next chart shows candlesticks over the last seven months. Here we will focus on the throwback and Bullish Setup Zone. MOO surged 10% into late July and then fell back to the breakout zone with a decline to the 80.5-81 area. This is the throwback that offers a second chance to partake in the breakout.
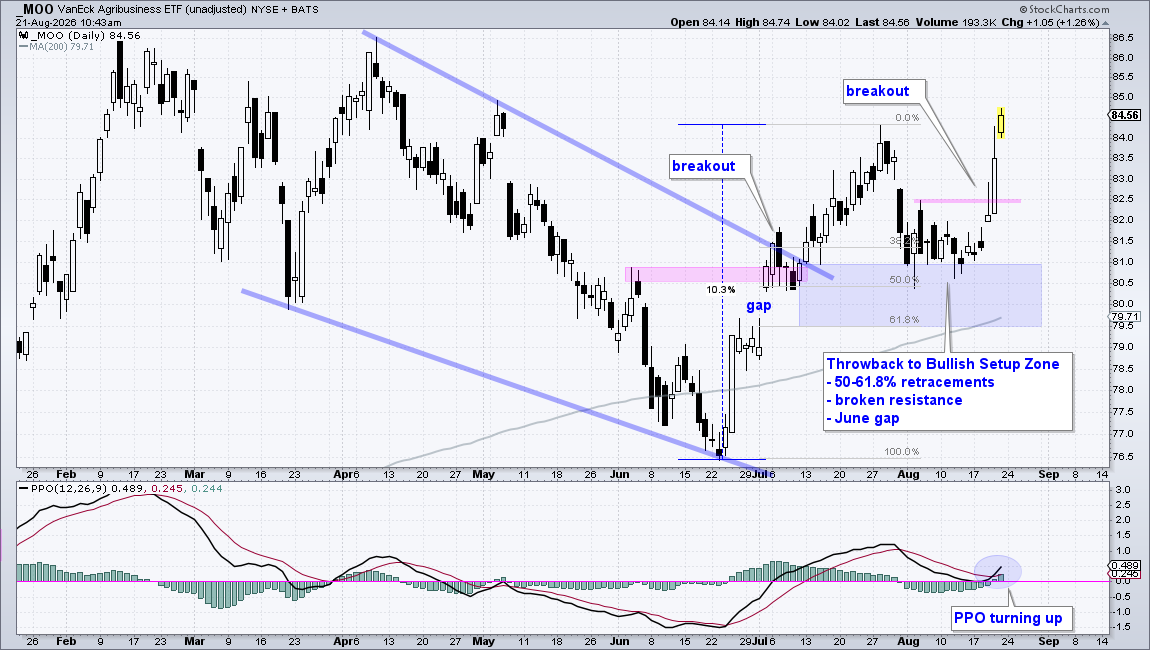
In addition to broken resistance, there are several technical studies pointing to support in the 79.5 to 81 area (blue shading). Here we have the 50-61.8% retracements, the July 2nd gap and the rising 200-day SMA.
MOO hit the top of this zone, firmed for two weeks and turned back up this week. With the strong breakout at 82.5, both the short-term and long-term trends are in sync (up). A close below 80 would call for a re-evaluation.
There are several AI-related ETFs with breakouts in early August and throwbacks this week. TrendInvestorPro will monitor the throwback zones for signs of firming and an upturn. Click here to take a trial and gain full access. [3]