Stocks within the Technology sector and the Nasdaq 100 are coming to life as ETFs related to these two break out and breadth improves. The percentage of Nasdaq 100 stocks above their 200-day SMA hit its highest level of the year and the equal-weight Nasdaq 100 surged to a 52-week high.
Recent Reports and Videos at TrendInvestorPro
Gold Hits Setup Zone – Copper Leads – Blockchain Breakout
Oil-Energy Lead – Utes Hit Bullish Zone – Small-caps Correct
Breadth Deteriorates, but Models Still Bullish – Yields Surge
Tech-AI Lead in Rolling Rotation – Breakouts Hold for QQQ, XLK…
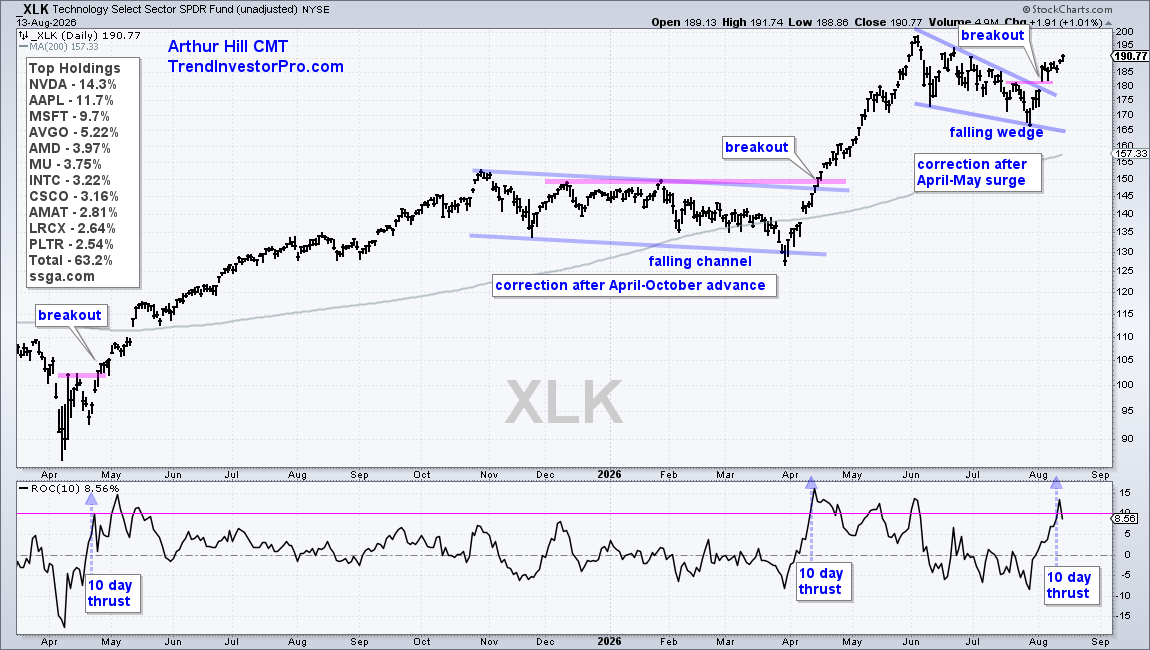
The first chart shows the Technology SPDR (XLK) with the 200-day SMA and the 10-day Rate-of-Change in the indicator window (ROC(10)). XLK bottomed in April 2025 and advanced into October 2025. It then corrected with a long falling channel and broke out with a surge in April 2026.
History does not repeat itself, but it sure rhymes as XLK traced out another advance, correct and breakout sequence. XLK surged from late March to late May and then corrected with a falling wedge. XLK was overextended in May and corrected with a falling wedge in June-July. The early August breakout signals an end to this correction and a resumption of the bigger uptrend.
A price thrust occurs when ROC(10) exceeds 10%, which means the 10-day percentage change is more than 10%. After a decline, a price thrust reflects a strong directional move that signals a reversal. It is like a rocket lifting off. The blue arrows show thrusts in April 2025, April 2026 and August 2026. Thus, the recent wedge breakout is validated with a price thrust.
QQQ Breaks Out as Participation Broadens
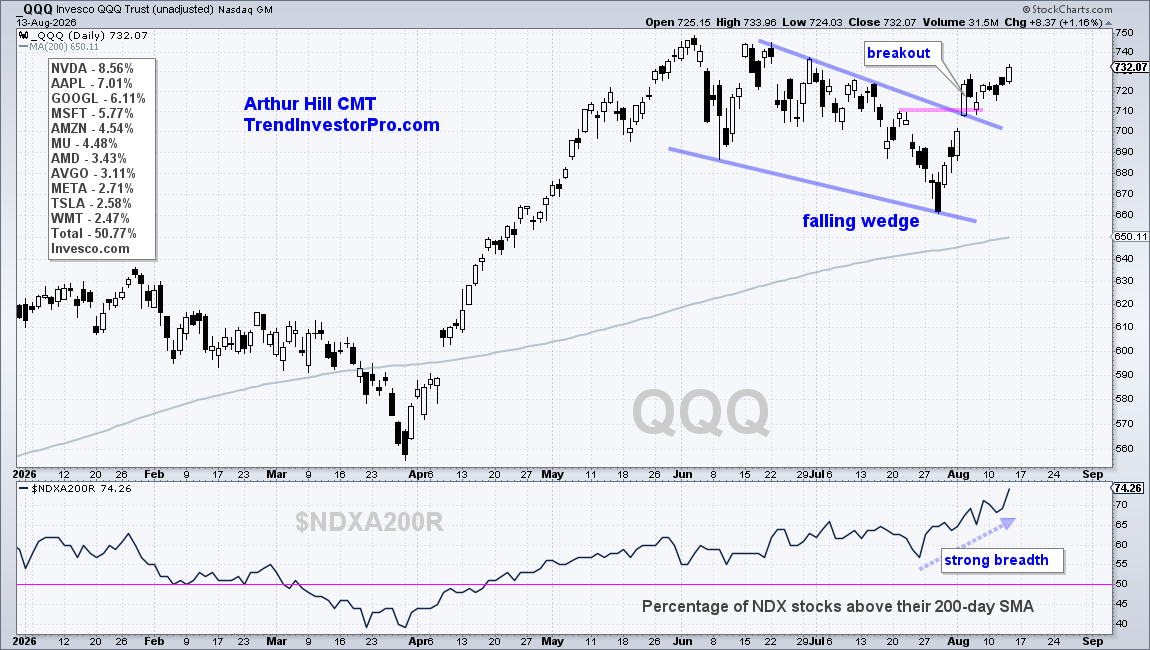
The next chart shows QQQ and NDX %Above 200-day SMA ($NDXA200R) in the indicator window. On the price chart, QQQ also formed a falling wedge correction into July and broke out in early August.
Not only did QQQ break out, but breadth within the Nasdaq 100 improved dramatically. The percentage of stocks above their 200-day SMAs moved from 57% on July 24th to 74% on August 13th. This indicator is at its highest level of the year (2026). This improvement reflects broad strength within the Nasdaq 100 (software, cybersecurity, semis, cloud, biotech).
TrendInvestorPro focuses on tradable setups and pullbacks within uptrends. These include triangles, wedges, channels, oversold conditions and price breakouts. Click here to take a trial and gain full access.[3]
Equal-weight QQQ Takes the Lead
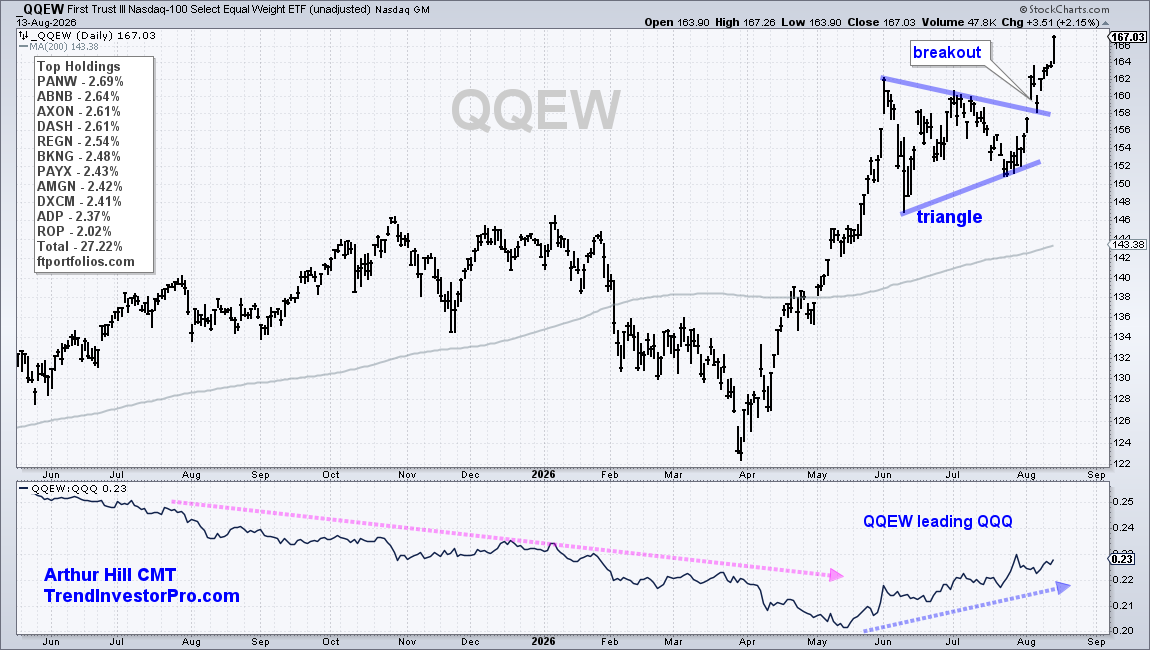
The Nasdaq 100 Equal-Weight ETF (QQEW) confirms broad strength within the Nasdaq 100. QQQ is weighted by market-cap with the top ten stocks accounting for around 50%. QQEW is more evenly distributed with the top ten stocks accounting for around 27%.
On the price chart, QQQ surged, formed a triangle consolidation and broke out with a surge in early August. QQEW hit a new high on August 4th and extended on this breakout with another new high this week. QQQ remains below its June high, which means the equal-weight version is leading.
Chartists can confirm recently leadership using the price-relative (QQEW:QQQ ratio). This ratio fell into May 2025 and then turned up the last few months. The ratio falls when QQEW lags QQQ and rises when QQEW outperforms QQQ.