Large-caps Hold Up Better than Smalls – Trend Signals for SPY – A Setup in Based Metals
- Arthur Hill, CMT
Welcome to the Chart Fix!
The markets were thrown for a loop in March as geopolitical tensions surged and the macro situation deteriorated. Energy prices shot up and interest rates rose as inflationary pressures increased. Despite these events, the S&P 500 is still fairly close to its recent highs. At what point does this pullback turn into a long-term downtrend? Today’s report will answer that question and a featured commodity-based alternative to stocks.
- SPY Holds Up Best as Small-caps Get Hit
- Long-term Moving Average Cross Remains Bullish
- Base Metals ETF Extends on Breakout
Recent Reports and Videos for Premium Members
- Testing the Zweig Breadth Thrust with an Exit Strategy
- Oil and Agriculture Lead as Uranium Sets Up
- Breadth Deteriorates, but Short of Bear Market Signal
- Safety is Relative (Healthcare, Utilities, Infrastructure)
- Trend Trio150 Signals for Dow 30 Stocks and SPDRs [1]
- Click here to take a trial and gain full access. [2]
SPY Holds Up Best as Small-caps Get Hit
Despite the turmoil of the last two weeks, the S&P 500 SPDR (SPY) was down 4.23% from its late January high (closing prices based on Thursday’s close). QQQ was 5.68% below its late January high and IWM was down 8.3% from its January 21st closing high. Small-caps bore the brunt of recent selling pressure, while SPY held up the best. At less than 5%, the current decline in SPY is a pullback within a long-term uptrend.
The chart below shows all three above their rising 200-day SMAs. For reference. Notice that these three ETFs fell similar amounts from late October to late November. See the pink percentage changes on the chart.
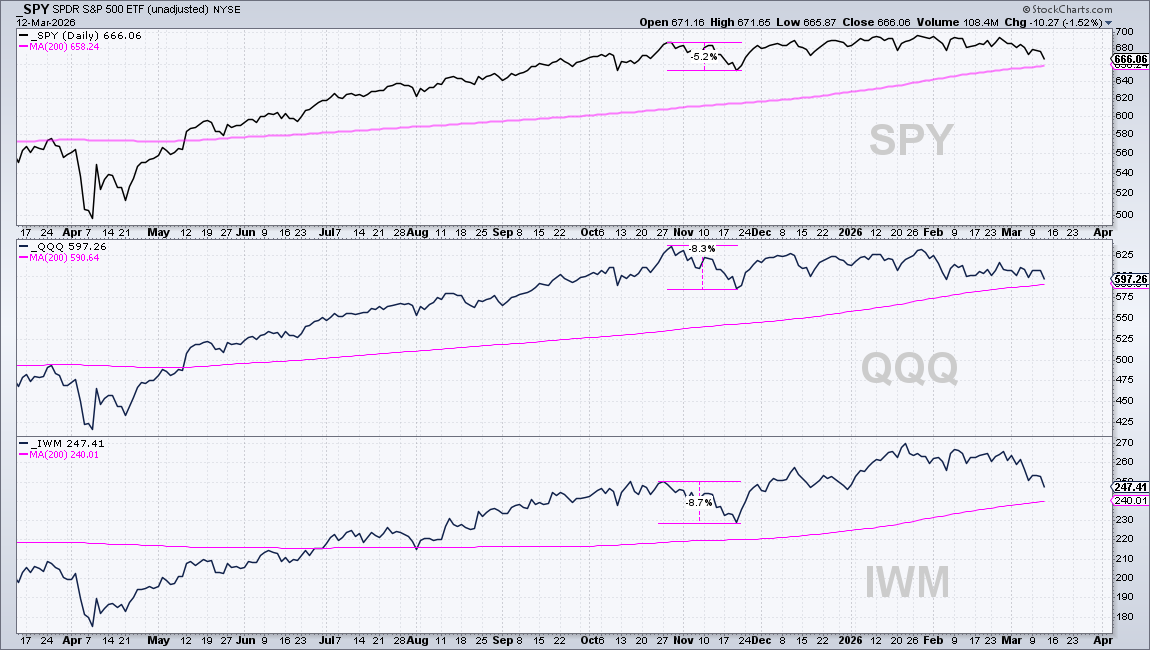
All 10% declines begin as 5% declines and all 20% declines begin as 10% declines. However, not all 5% declines lead to declines of 10 or 20 percent. At this stage, the weight of the evidence remains bullish for the S&P 500 and the recent decline is a pullback within an uptrend as long as this evidence remains bullish. Now let’s determine what it would take to turn bearish on the S&P 500 (SPY).
Long-term Moving Average Cross Remains Bullish
The 200-day SMA is perhaps the most widely used long-term moving average and the S&P 500 is the most important benchmark for US stocks. The S&P 500 SPDR (SPY) is in a long-term uptrend when above its 200-day SMA and in a long-term downtrend when below. In general, negative outcomes are more likely when SPY is below its 200-day SMA and positive outcomes are more likely when SPY is above.
A little smoothing can go a long way. I am smoothing the close with a five day simple moving average. Thus, an uptrend signals when the 5-day SMA crosses above the 200-day SMA and a downtrend signals when the 5-day crosses below the 200-day. Smoothing the close with a 5-day SMA reduces whipsaws and maintains timeliness. The chart below shows SPY with signals over the last four years.
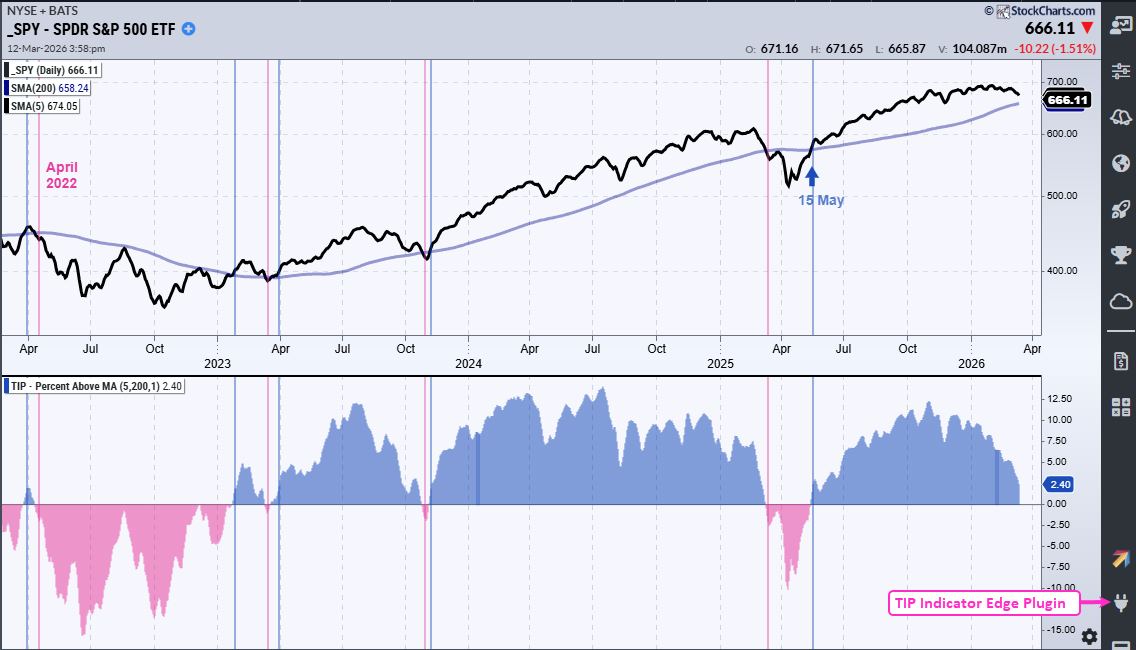
The indicator window shows the TIP Percent above MA (5,200,1) indicator, which shows the percentage difference between the 5 and 200 day SMAs. It is positive when the 5-day is above the 200-day (blue) an negative when the 5-day SMA is below (pink). Currently, the 5-day SMA is 2.4% above the 200-day SMA and SPY remains in a long-term uptrend. The trouble starts when/if this indicator turns negative.
Percent above MA is one of eleven indicators in the TIP Indicator-Edge Plugin for StockCharts ACP. [3]
Base Metals ETF Extends on Breakout
Even though SPY remains in an uptrend, I realize that the macro environment and geopolitical headwinds have created a high level of uncertainty in the markets, especially for stocks. Interest rates are rising, energy prices are rising and there is turmoil in the Middle East. This is why it is import to look outside of the stocks market for true diversification. Last week I highlighted the breakout in the DB Agriculture ETF (DBA). This week, I am featuring the DB Base Metals ETF (DBB), which is positive since the war with Iran broke out (9 trading days ago).
The chart below shows DBB in a long-term uptrend with a big breakout in September. DBB advanced into late January with a new high and spike above 25. Note that I am choosing to ignore this spike. Overall, I see a strong advance (+19.4%) and a consolidation (blue shading). Consolidations take their trading bias from the direction of the prior move, which was up. Thus, a consolidation breakout would signal a continuation higher.
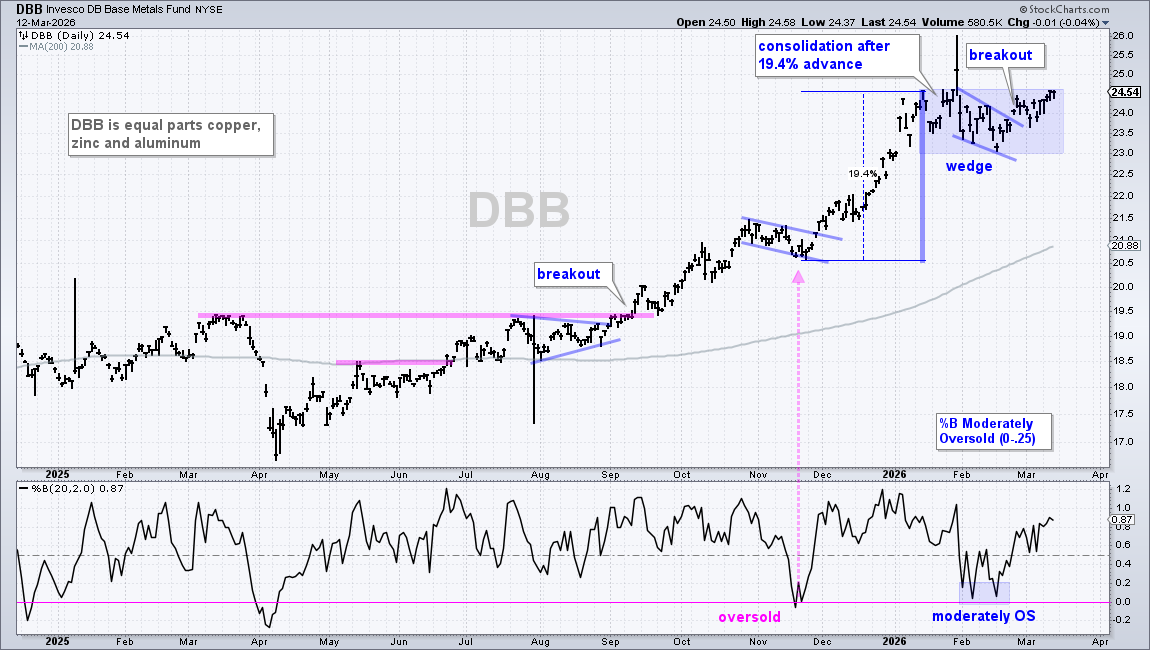
There are two short-term setups within the consolidation. First, a small wedge formed in February and DBB broke the wedge line in late February. This breakout increases the chances for a bigger consolidation breakout. Second, %B became moderately oversold with two dips into the 0-.25 area (blue shading). %B is oversold when it dips below zero, as in late November (pink arrow-line). However, sometimes shallow pullbacks do not trigger oversold setups. %B got close to zero, but not below. This is a moderately oversold condition.
Recent Reports and Videos for Premium Members
- Testing the Zweig Breadth Thrust with an Exit Strategy
- Oil and Agriculture Lead as Uranium Sets Up
- Breadth Deteriorates, but Short of Bear Market Signal
- Safety is Relative (Healthcare, Utilities, Infrastructure)
- Trend Trio150 Signals for Dow 30 Stocks and SPDRs [1]
- Click here to take a trial and gain full access. [2]