Using the PPO to Define Trend and Aroon to Identity Breakouts After Corrections
- Arthur Hill, CMT
Welcome to the Chart Fix!
My bread and butter trading strategy is to look for consolidations within long-term uptrends, and during bull markets. We are clearly in a bull market with SPY, QQQ and IWM hitting new highs. Today’s report will feature a simple strategy that uses the PPO to identify the long-term uptrend and Aroon to identify short-term breakouts after corrections.
- Bull Market with SPY at New High
- Using the PPO to Identify the Long-term Uptrend
- Breakout Signals with the Aroon Indicator
Recent Reports and Videos at TrendInvestorPro
- Small-caps Lead, Space Sets Up, Telecom Breakout
- Stock Setups: First Solar, Quanta and Arista Networks
- Copper and Base Metals Set Up Bullish
- Breadth Supports the Bull Market (%Above 200-day)
- Click here to take a trial and gain full access. [1]
Aroon and SPY
Developed by Tushar Chande, the Aroon indicator uses price and time to quantify trend strength and direction. Aroon Up (25) reflects the number of periods since a 25-day high, while Aroon Down (25) reflects the periods since a 25-day low. Aroon Up (25) hits 100 when the high marks a 25-day high, while Aroon Down (25) hits 100 when the low marks a 25-day low.
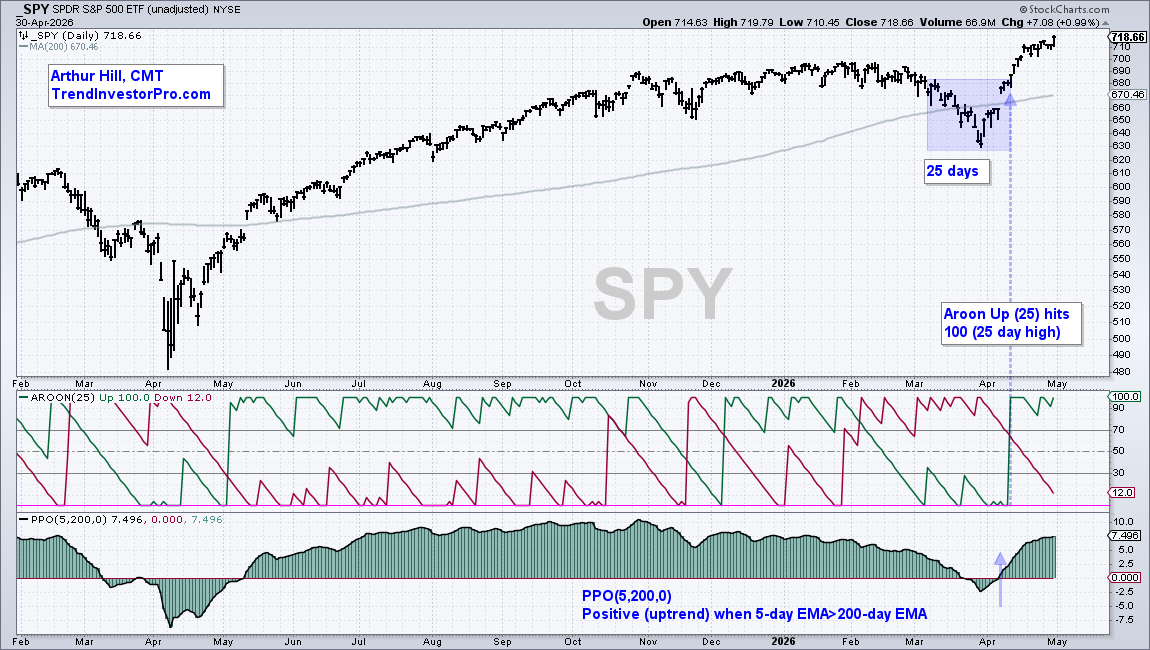
Overall, an upward bias is present when Aroon UP is above 50 and greater than Aroon Down. An Aroon Up (25) move to 100 signals a 25-day high, and implies a breakout. Chartists can use these signals confirm or time consolidation breakouts on the price chart. Keep in mind that 25 days is a relatively short time period, which means this is best suited for price patterns that extend 4 to 12 weeks.
Bullish Setup and Signal in TAN
My bread and butter trading strategy is to look for consolidations within and long-term uptrends, and during a bull market. We are in a bull market because SPY has a positive PPO(5,200,0), which means the 5-day EMA is above the 200-day EMA. SPY, QQQ and IWM also hit new highs this month, which also signals a bull market.
The next chart shows the Solar Energy ETF (TAN) meeting the trend requirement and triggering a bullish Aroon signal. First, TAN is in an uptrend since the PPO(5,200,0) turned positive on July 2nd. Just before this uptrend signal, Aroon Up (25) surged above 100 on July 1st. This breakout coincided with the long-term trend change.
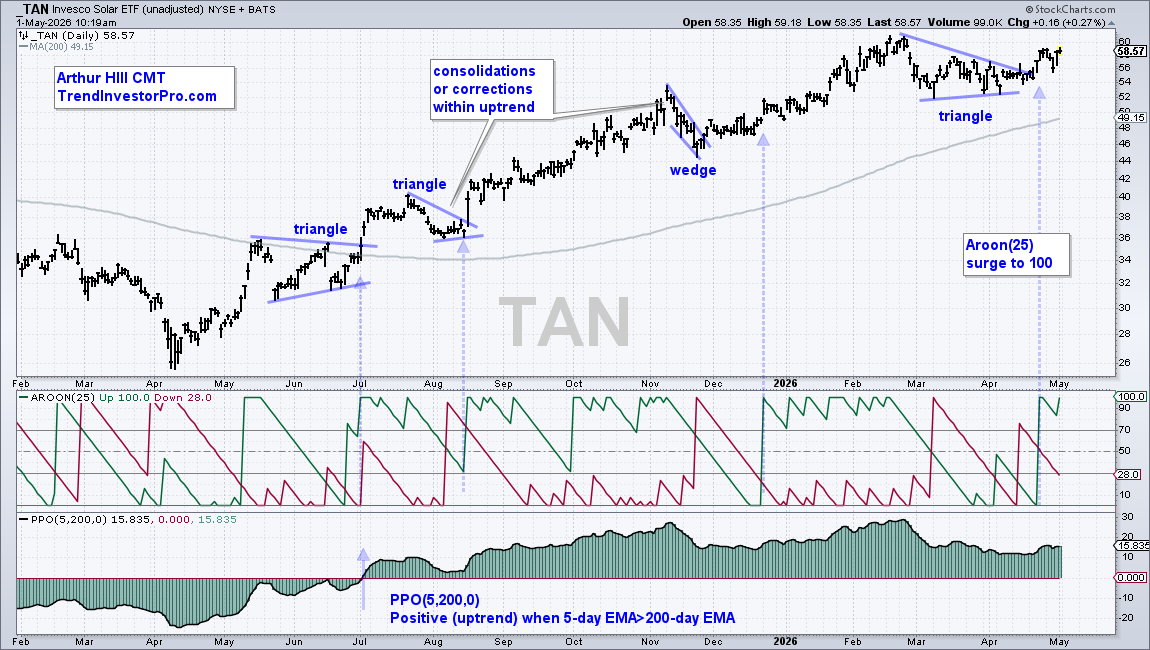
TAN continued higher with bullish consolidations forming in July-August (triangle), November (wedge) and March-April (triangle). In a long-term uptrend, consolidations are considered bullish continuation patterns that represent a rest along the way. The subsequent breakout signals an end to the consolidation and a resumption of the long-term uptrend.
The blue dashed arrow line shows when Aroon Up (25) surges from below 50 to 100. The move below 50 means there was a consolidation or pullback, while the surge to 100 signals a 25-day high or a breakout.
Most recently TAN consolidated with a triangle in March-April and broke out with a surge on April 22nd and 23rd. Also notice that Aroon (25) surged to 100 on April 22nd, which confirms the breakout. In general, I stick with these signals until the long-term trend turns down or a bear market signals.
This report continues for subscribers. We feature two ETFs with bullish Aroon signals this week and three that are setting up, including a commodity ETF. We also explain some of the signal nuances and include a video for deeper understanding. Click here to take a trial and get full access. [1]
Recent Reports and Videos at TrendInvestorPro
- Small-caps Lead, Space Sets Up, Telecom Breakout
- Stock Setups: First Solar, Quanta and Arista Networks
- Copper and Base Metals Set Up Bullish
- Breadth Supports the Bull Market (%Above 200-day)
- Click here to take a trial and gain full access. [1]