Headlines
- Cadence Tests Breakout Zone
- Burlington Breaks Out to End Correction
- A Setup within a SETUP for Freeport McMoRan
- New Highs in Sight as Tesla Breaks Pennant Line
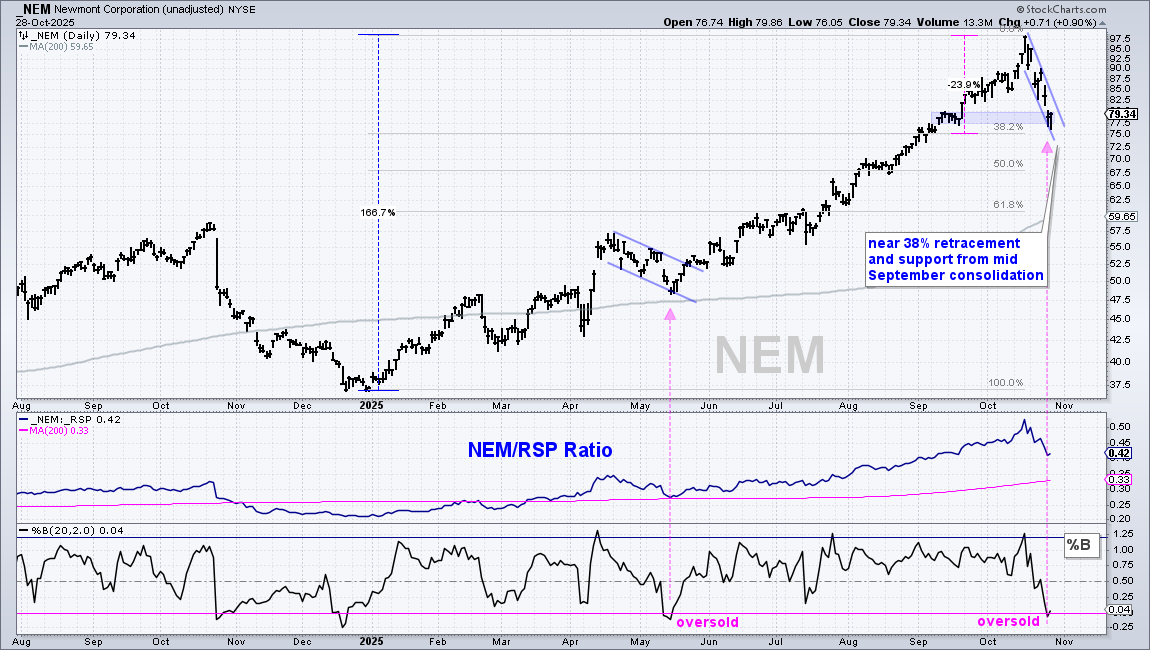
- Newmont Hits Retracement and Becomes Oversold
I will update the Market Regime page later today.
Previous Reports Covering Stock Trends, Setups and Breakouts
October 22nd: [1] CRWD, PANW, SARO, VEEV, ITB, XHB and HD
October 15th: [2]ADM COST TT EMR NTAP and IOT
October 8th [3]: AVGO, CRWD, WMT, AMGN, INCY, COR and CAH
October 1st [4]: COIN, MSFT, CSCO, AMD, HEI and ROK
September 24th: [5] ADSK, DGX, DRS, MELI, AEE, CNP, ETR and EVRG
The market environment remains bullish with tech and AI related stocks leading the charge. Today’s report features a stock that fits in both the semiconductor and software groups (Cadence CDNS). We will also cover Tesla, which is part of the Mag7 ETF, another market leader. Attention then turns to an off-price retailer with a breakout (Burlington Stores BURL). Gold corrected hard the last eight days and this produced an oversold setup for Newmont (NEM). We close with a copper-gold miner that this lagging the group, but could play catch up with a bullish pattern (Freeport McMoRan FCX). Note that volatility could be above average the rest of the week. Here is the line for the next two days. Wednesday
- Wednesday 29 Oct – Fed Policy Statement (2PM)
- Wednesday 29 Oct – MSFT, GOOGL & META (after close)
- Thursday 30 Oct – Trump Xi Meeting (AM in Gyeongju, Korea)
- Thursday 30 Oct – AAPL & AMZN (after close)
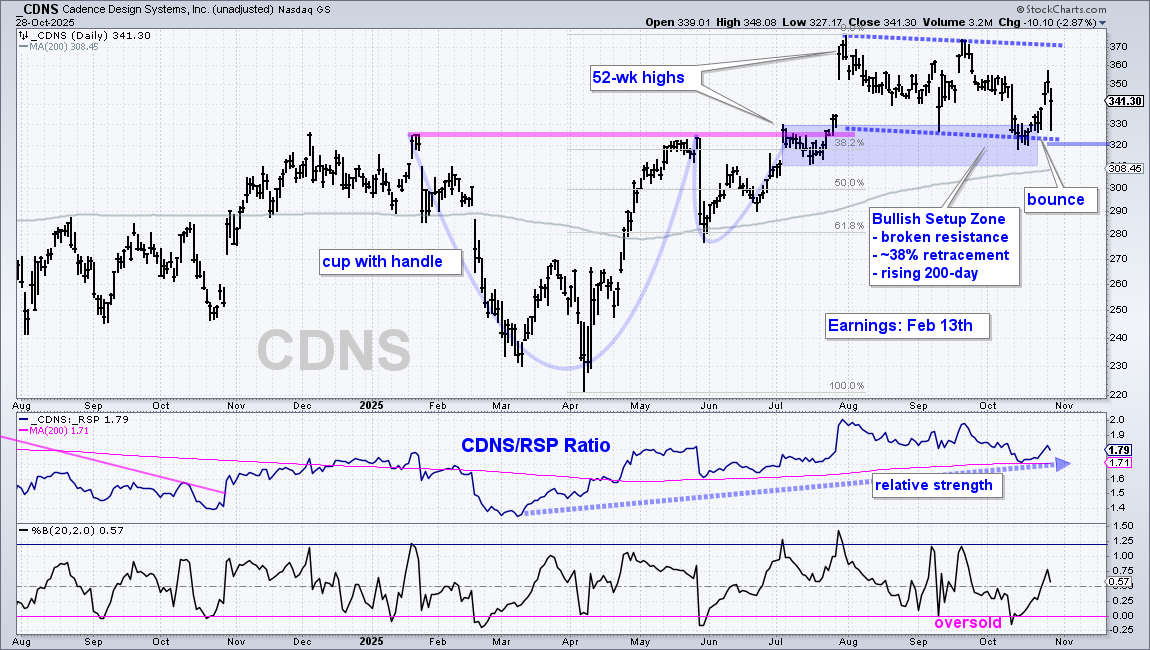
Cadence Tests Breakout Zone
Cadence (CDNS) provides software, hardware and services to design and verify advanced electronic systems and semiconductors. It is part of the Semiconductor ETF (SMH) and Software ETF (IGV).
The long-term trend is up as the stock broke cup-with-handle resistance in July and remains above the rising 200-day SMA (gray line). After the breakout surge, the stock fell back to a Bullish Setup Zone in the 310-330 area (blue shading). Here we have the 38% retracement line, the rising 200-day SMA and broken resistance, which turns into support. I view the decline back to 320 as a correction after the April-July advance. Moreover, the Bullish Setup Zone is an area to watch for support and a bullish reversal. CDNS reported earnings on Monday after the close and fell back on Tuesday. Last week’s bounce off the 320 is mostly intact. This is the upturn within the bigger bullish pattern (correction from August to October). A close below 320 would erase this bounce and call for a re-evaluation.
New Highs in Sight as Tesla Breaks Pennant Line
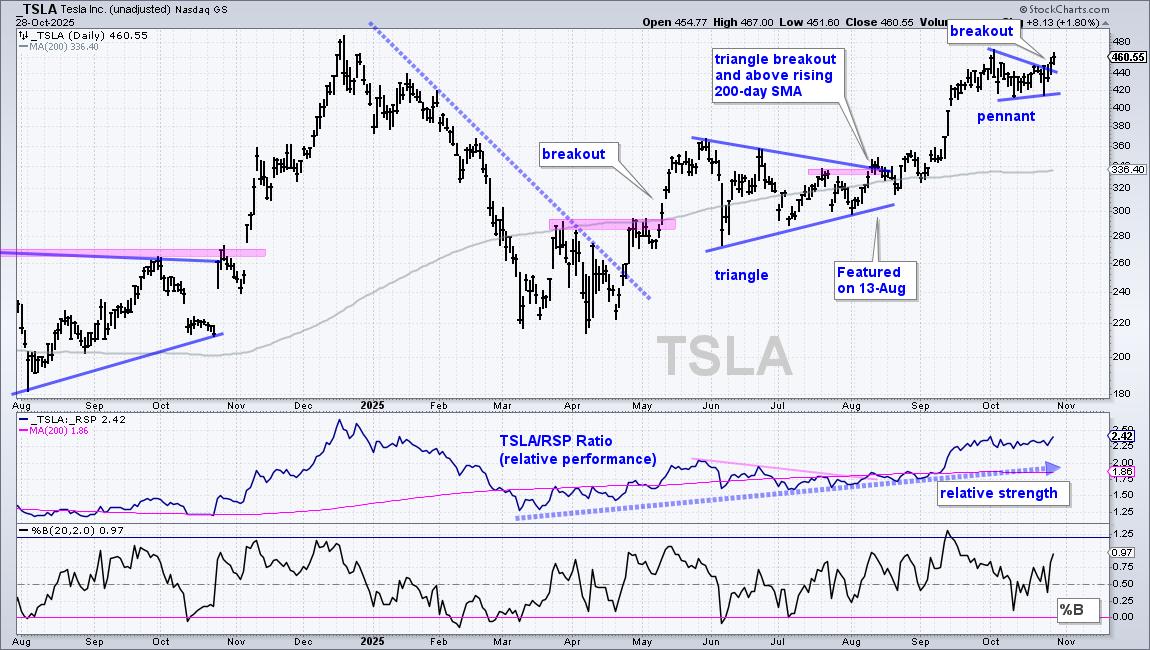
Tesla (TSLA) was featured on August 13t [6]h as it consolidated around the rising 200-day SMA and broke out of a triangle. The stock surged with the market in September and then consolidated with a pennant in October. Pennants are short-term continuation patterns that take their trading bias from the prior move, which was up. This week’s pennant breakout signals a continuation of the September advance and opens the door to a possible 52-week high (above the December 2024 high). Keep in mind the pennants are short-term patterns and short-term price action is subject to noise (volatility). A break below the pennant lows would negate the pattern, but would not affect the long-term uptrend. As long as the long-term trend is up, a pullback would be considered a correction within that uptrend.
Plan your Trade, Trade your Plan and Diversify
There are two ways to approach these short-term setups.
First, trade them as swing trades. A falling flag or wedge breakout is bullish and this signal remains valid until a break below the re-evaluation level, which is usually the low just before the breakout. For short-term trading, I usually set a profit target and close one third to one half of the position when this target is reached. A trailing stop is then placed to ensure that the entire trade does not result in a loss.
Second, use short-term setups to participate in the bigger uptrend. Bullish setups stem from short-term oversold conditions, falling wedges/flags or pullbacks. Instead of a re-evaluation level, the exit signal is based on a long-term trend change and a trend-following exit. Signals include a cross below the 200-day SMA, a major support break, a Chandelier Exit or a Keltner Channel break. This means the potential loss will be larger, but there is also a possibility to take part in an extended uptrend.
Thus, plan before making the trade, and then trade according to that plan. Also consider position sizing and diversification to spread the risk.
Burlington Breaks Out to End Correction
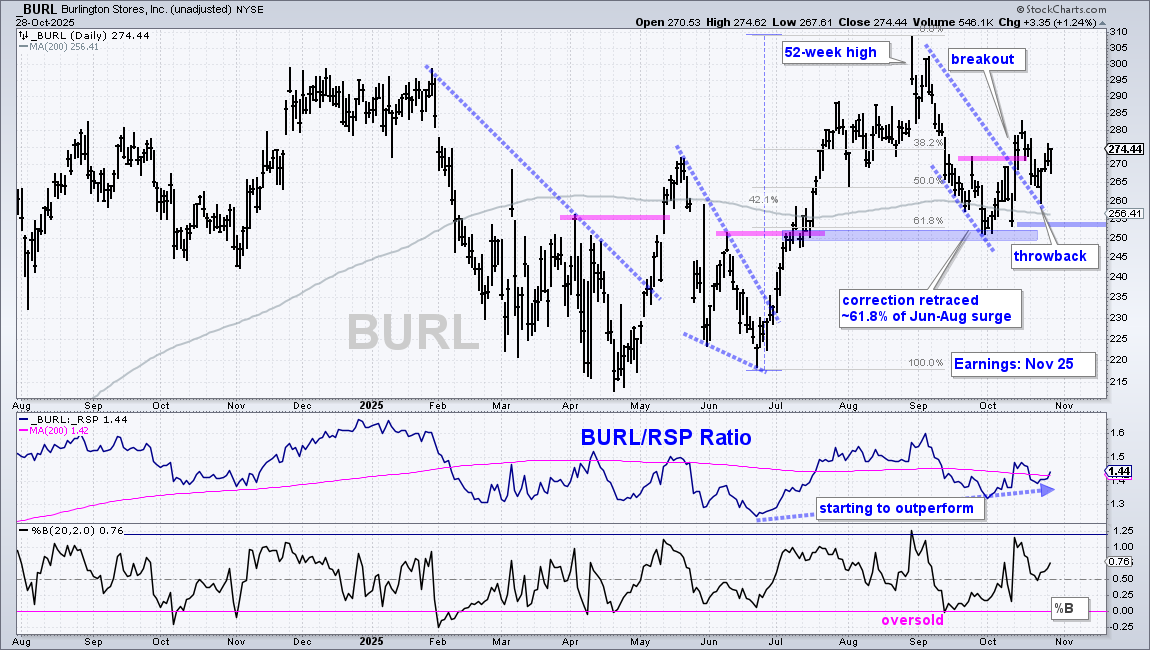
Burlington Stores (BURL) is an off-price apparel and home products retailer, similar to TJX and ROST. The latter two hit new highs in October. BURL is poised to play catch up because it recently broke short-term resistance to reverse the September slide.
BURL surged from late June to late August and recorded a 52-week high. This means there is some sort of uptrend. The stock then fell sharply in Setember, but managed to firm near the 200-day SMA and 61.8% retracement in early October. There is also support from broken resistance in this area. Overall, I view the September decline as a correction and the 250-260 area is a Bullish Setup Zone. BURL broke out with a surge in mid October. This signals an end to the correction and a resumption of the prior advance. There was a short throwback after the breakout, but BURL rebounded the last four days and the breakout remains in play. A close below 253 would call for a re-evaluation.
A Setup within a SETUP for Freeport McMoRan
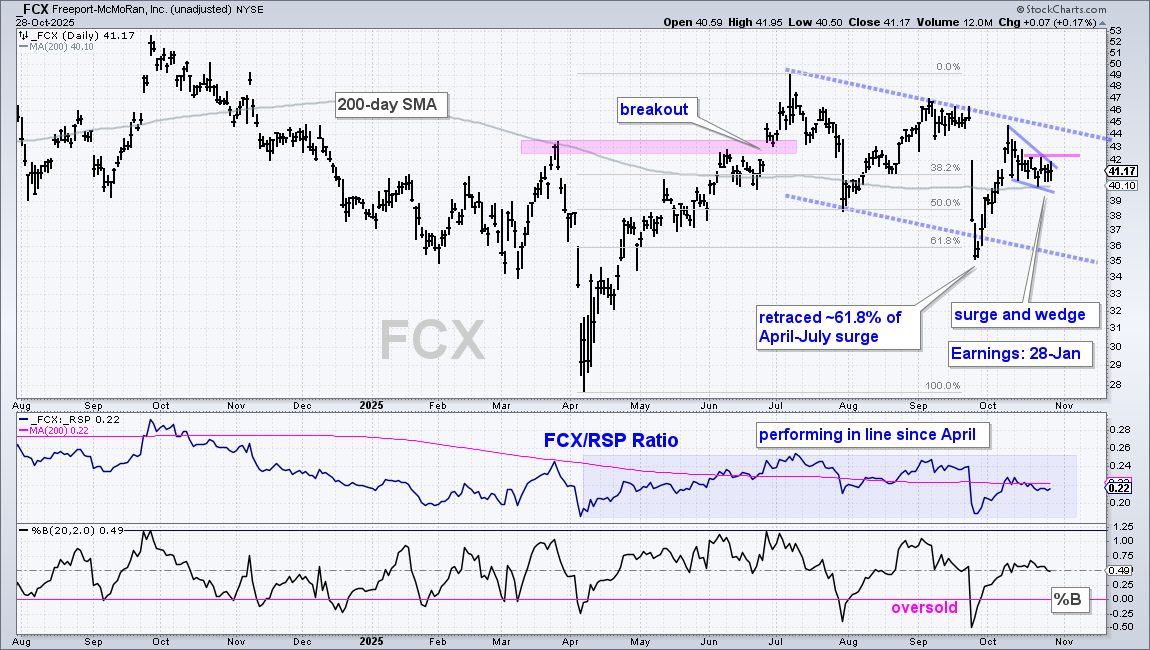
Freeport McMoran (FCX) mines metals, including copper and gold. The stock plunged 17% on September 26th on news of a fatal accident at its Indonesian copper and gold mine. Production for this mine is expected to be 35% lower in 2026, but this decline could be offset by higher copper and gold prices.
The price chart is constructive with a correction within a correction setup emerging. First, the stock surged from early April to early July and then corrected with a decline that retraced around 61.8% (September low). I view the July-October decline as a big correction after the June breakout. A breakout at 45 would be long-term bullish. Short-term, the stock recovered after the September plunge with a surge from 35 to 45. FCX then corrected with a falling wedge into October and I view this as a short-term bullish continuation pattern. It is also a correction after the recovery surge. A breakout at 42.5 would signal a continuation higher and increase the chances for a bigger breakout at 45. A close below 39 would call for a re-evaluation.
Newmont Hits Retracement and Becomes Oversold
Newmont (NEM) mines precious metals. Needless to say, price performance is strongly correlated to gold. NEM led the market with a 150+ percent advance from late December 2024 to mid October 2025. The stock then fell some 24% as gold and silver fell sharply the last eight days. Long-term, the trend is still up with price well above the rising 200-day SMA. Short-term, the trend is down with a sharp 8-day decline. This decline, however, is still viewed as a correction within the bigger uptrend. In addition, NEM is trading near the 38% retracement and support from the mid September consolidation (blue shading). %B is also oversold with its second move below zero this year (pink arrow line). NEM is poised for at least a bounce.
Note that NEM, the Gold Miners ETF (GDX), Silver Miners ETF (SIL) and Silver ETF (SLV) are in the same boat: oversold within long-term uptrends. They are poised to bounce from here, but keep in mind that volatility (risk) is high, very high. Plan that trade and trade that plan! The Fed makes its policy statement this afternoon and this could also move the market. I will cover GLD, SLV, GDX, SIL and the other alternative ETFs on Thursday.
DISCLAIMER: This content provided strictly for informational and educational purposes. It should not be interpreted as an offer to buy or sell any security, nor as a solicitation to engage in any investment activity. Nothing here constitutes a recommendation regarding any specific security, portfolio, transaction, or investment strategy.
At times, the author or affiliates may hold positions or interests in securities discussed. Any stocks or examples mentioned are not endorsements or suggestions to purchase. This material does not consider your individual financial goals or circumstances, and you should seek guidance from a qualified financial or investment adviser before making any trading or investment decisions.
Past performance does not guarantee future results.
Send feedback to support(at)trendinvestorpro.com or use the contact form. [7]