Gold/Silver Miners Extend Again – URA Ignores Physical Uranium – IBIT Holds Breakout Zone
Posted By
Arthur Hill, CMT
On
In
Archive |
No Comments
Headlines
Massive Gains for Precious Metals ETFs
Gold and Silver Surge, Yet Again
Gold and Silver Miners Go Parabolic
Copper and Base Metals are in Uptrends
SRUUF Bounces off Retracement Zone as URA Surges
Bitcoin ETF Consolidates above Breakout Zone
The next report will be the Friday Chart Fix (17 Oct).
The next Premium report/video will be on Tuesday, October 21th.
Massive Gains for Precious Metals ETFs
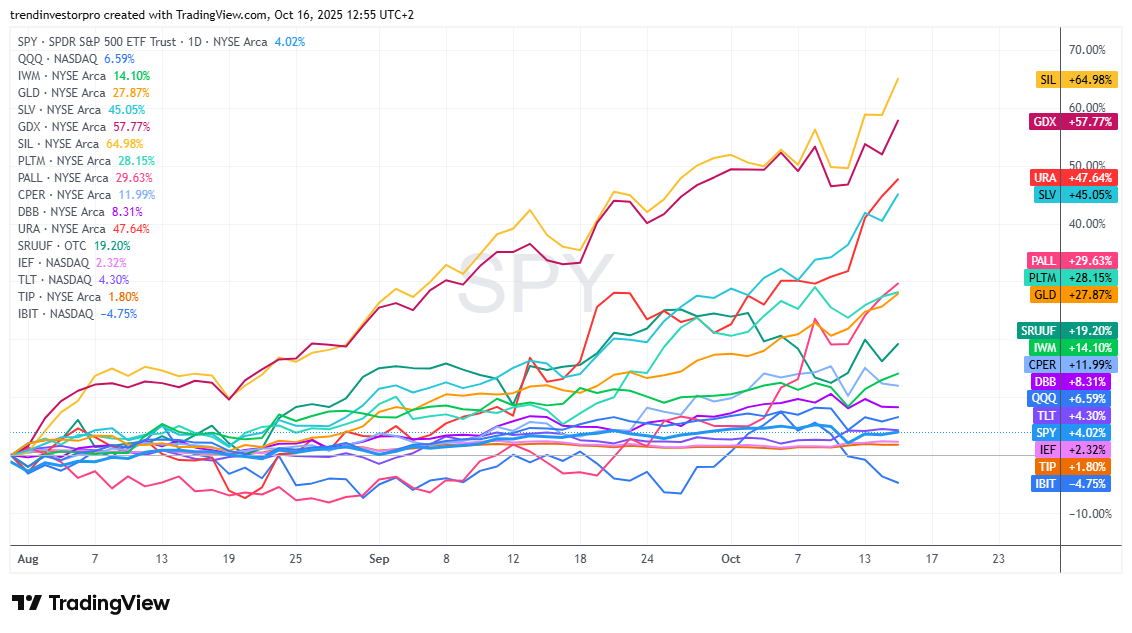
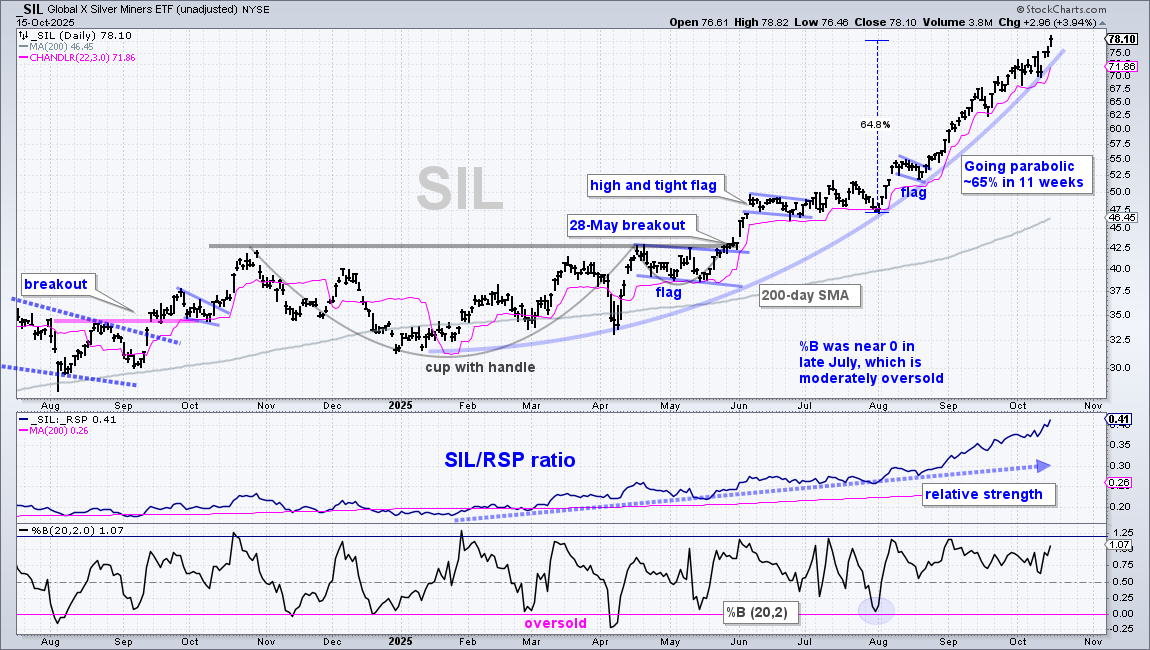
Metals have been leading the financial markets with massive moves the eleven weeks. SPY (+4%), QQQ (+6.6%) and IWM (+14.10%) sport nice gains since August 1st. These gains, however, are dwarfed by Silver Miners SIL (+65%), Gold Miners GDX (+57.77%), Uranium URA +47.64%) and Silver SLV (+45%). The Gold SPDR (GLD) is in the middle of the pack with a 27.87% gain since August 1st (63 trading days). This is clearly a bull market for all metals: precious and industrial. The price charts for many precious metals, however, are looking parabolic, which argues for some caution going forward. At the bottom end of the alternative ETF universe, the Bitcoin ETF (IBIT) is the big laggard since August 1st with a 4.75% decline.
Gold and Silver Surge, Yet Again
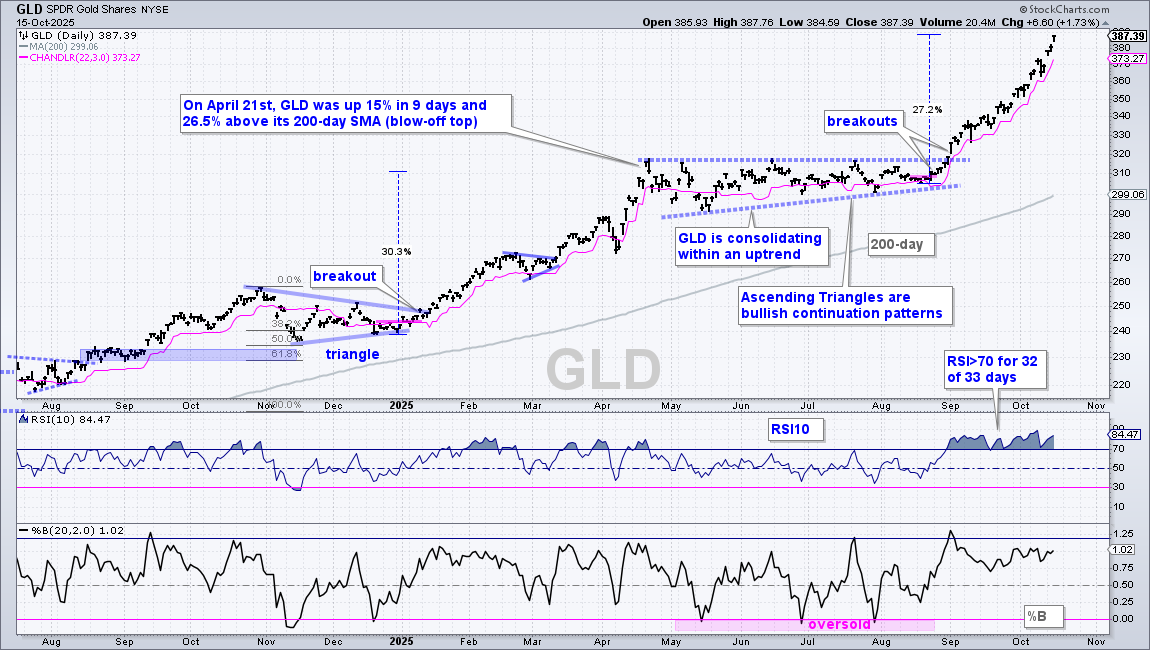
There is no change on the Gold SPDR (GLD) as it tacked on another 4.95% so far this week. GLD is up around 27% since August 19th (40 trading days). Note that GLD rose 30% in 75 days from December 30th to April 21st. The current advance is much steeper and looking parabolic, but nobody knows how far it will extend or how long it will last. All we know is that GLD is in a strong and leading uptrend, and getting frothy. There is no setup on the chart. GLD is simply in the trend-monitoring phase. This means it is time to monitor price action, consider an exit strategy and/or wait for the next setup. The pink line shows the Chandelier Exit (22,3) for reference (373.27).
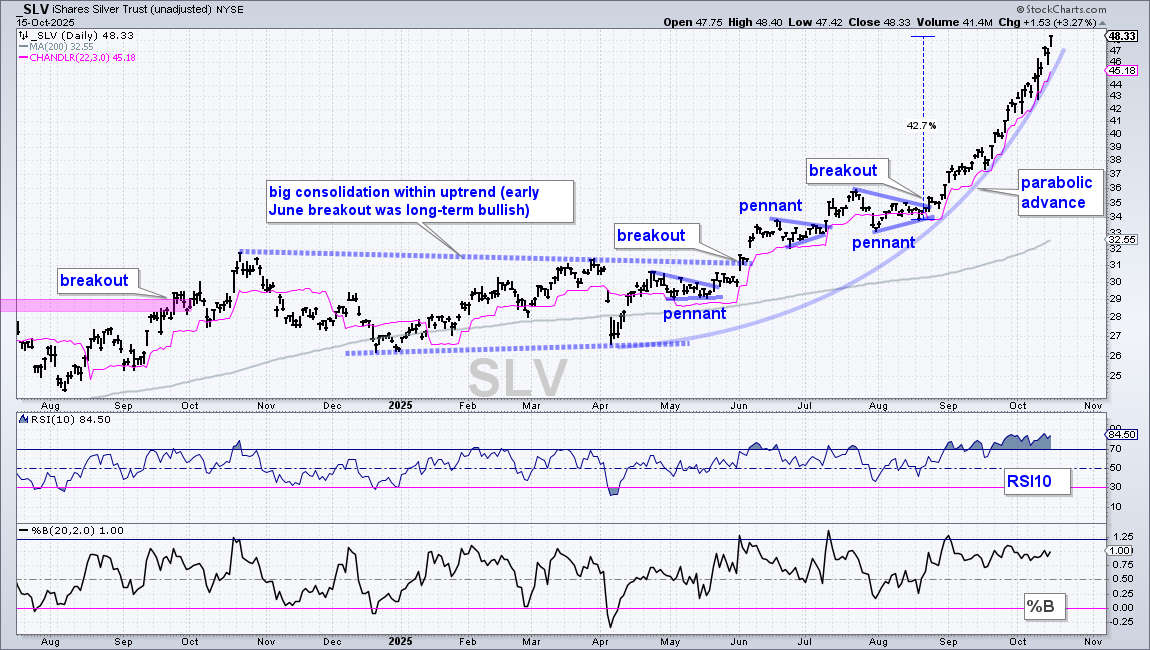
The Silver ETF (SLV) is in the same boat after a 42.7% advance since August 19th (no change). This move is straight up and is clearly going parabolic. A parabolic advance is pretty much the same as a bubble. After rising for a period, the advance accelerates higher with a steepening of the curved line (parabola). Parabolic advances are often unstainable, but it is impossible to pick the top. The best we can do is monitor price action and consider a trailing stop, such as a Chandelier Exit (22,3) or (65,5). For reference, the pink line shows the Chandelier Exit (22,3) at 45.18, which is around 7% below the current close. A break below the Chandelier Exit is not bearish. Instead, it is a mechanism to lock in profits and stem losses. The long-term trend is still up, and this means a pullback would likely lead to the next trading setup.
Gold and Silver Miners Go More Parabolic
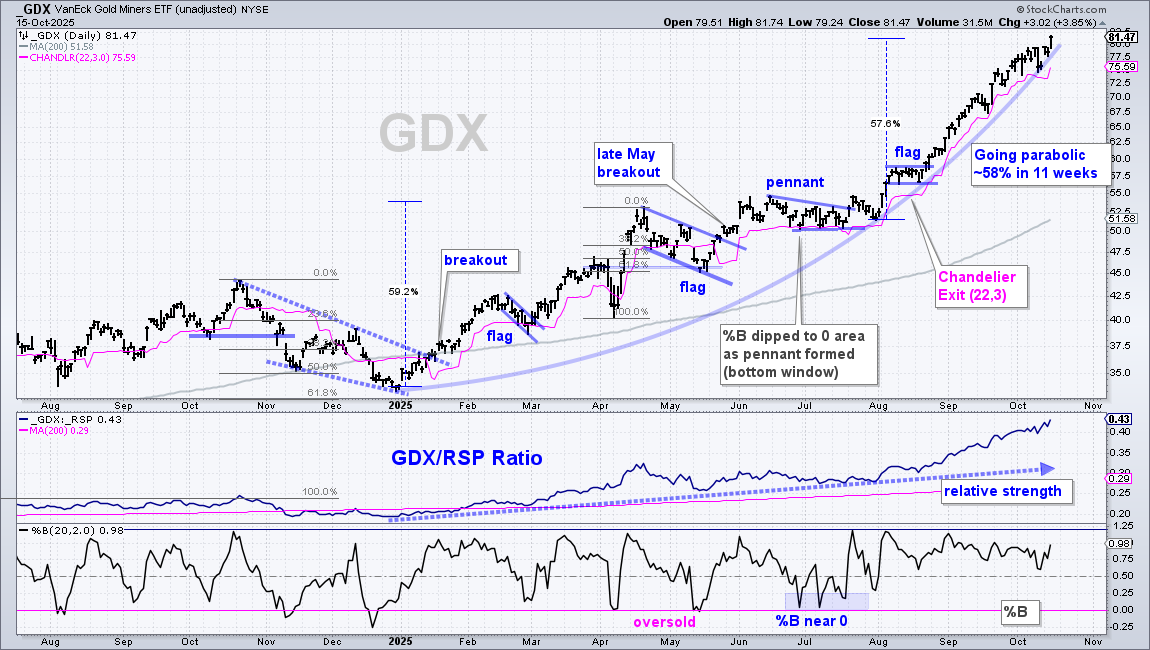
The next chart shows the Gold Miners ETF (GDX) with the parabolic advance (blue parabola). GDX rose 59% from January to mid June (112 days), and then 57.6% from July 31st to October 16th (53 days). GDX gained the same amount in less than half the time. There is nothing to do here except monitor price action, consider an exit strategy and wait for the next setup. The pink line shows the Chandelier Exit (22,3) at 75.59, which is around ~7% below current prices. GDX has not closed below this exit line since the late May breakout. This is a testament to the shallowness of the pullbacks and the strength of the advance.
The next chart shows the Silver Miners ETF (SIL) with similar characteristics and the Chandelier Exit (22,3) at 71.86. This exit was at 68.93 last Thursday and rose to 71.86 as SIL surged to a new high. It is always 3 ATR(22) values below the 22-day high. This means it will rise and trail prices as long as SIL continues making new highs.
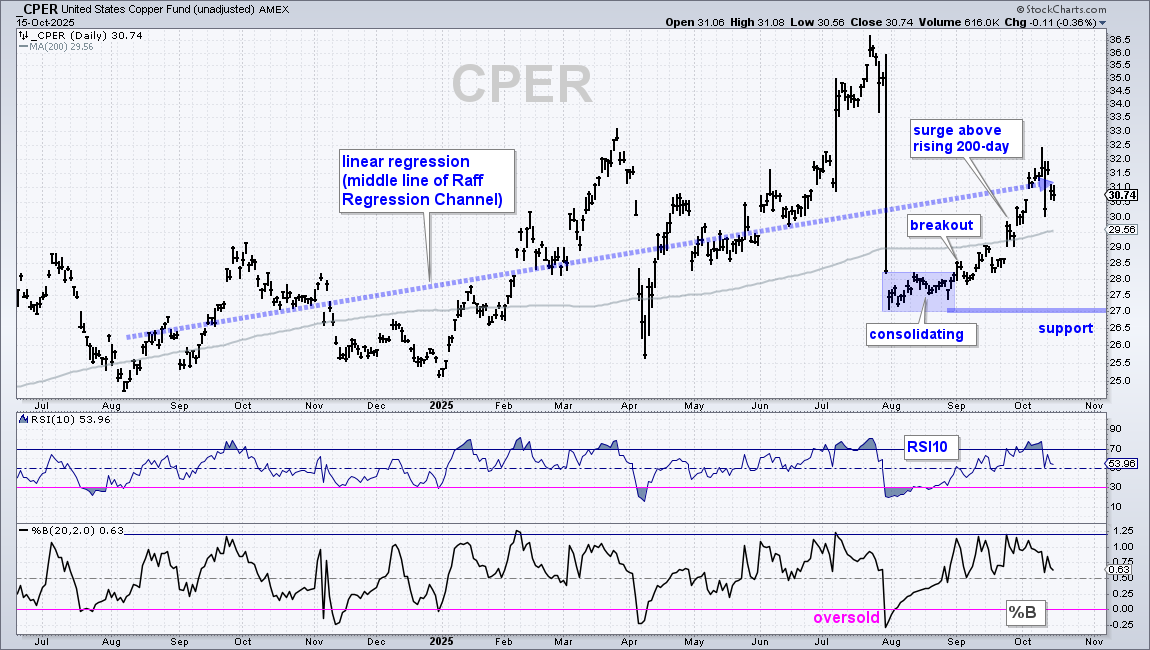
There is no change in the Copper ETF (CPER) as it consolidates around the linear regression, which is the “line of best fit” for closing prices form August to October. This is also the middle line of a Raff Regression Channel, a SharpCharts drawing tool. A rising linear regression means the trend is up. CPER is currently trading right at the linear regression, signaling that it is neither overbought nor oversold. CPER is trading at the mean (average). The last signal was the consolidation breakout on September 2nd. CPER then extended above its rising 200-day. The long-term trend is clearly up and I do not see a setup, which puts CPER is in the trend-monitoring phase.
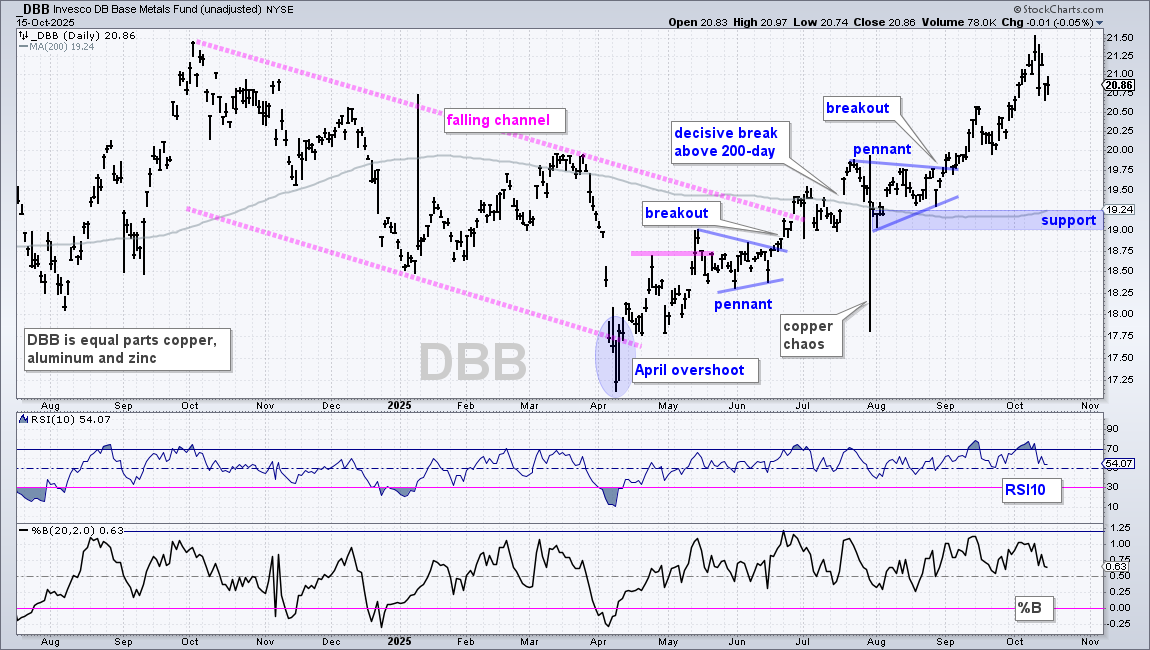
There is no change in the DB Base Metals ETF (DBB), which is equal parts copper, aluminum and zinc. DBB is in a long-term uptrend with breakouts in June, July and September. The ETF hit a new intraday high last week, but fell with the Friday tariff tweet and turned volatile. The last signal was the pennant breakout on September 2nd. I do not see a setup on this chart right now, which means DBB is in the trend-monitoring phase. Time to wait for the next setup, manage any positions and analyze price action. Support is set in the 19-19.25 area.
SRUUF Bounces off Retracement Zone as URA Surges
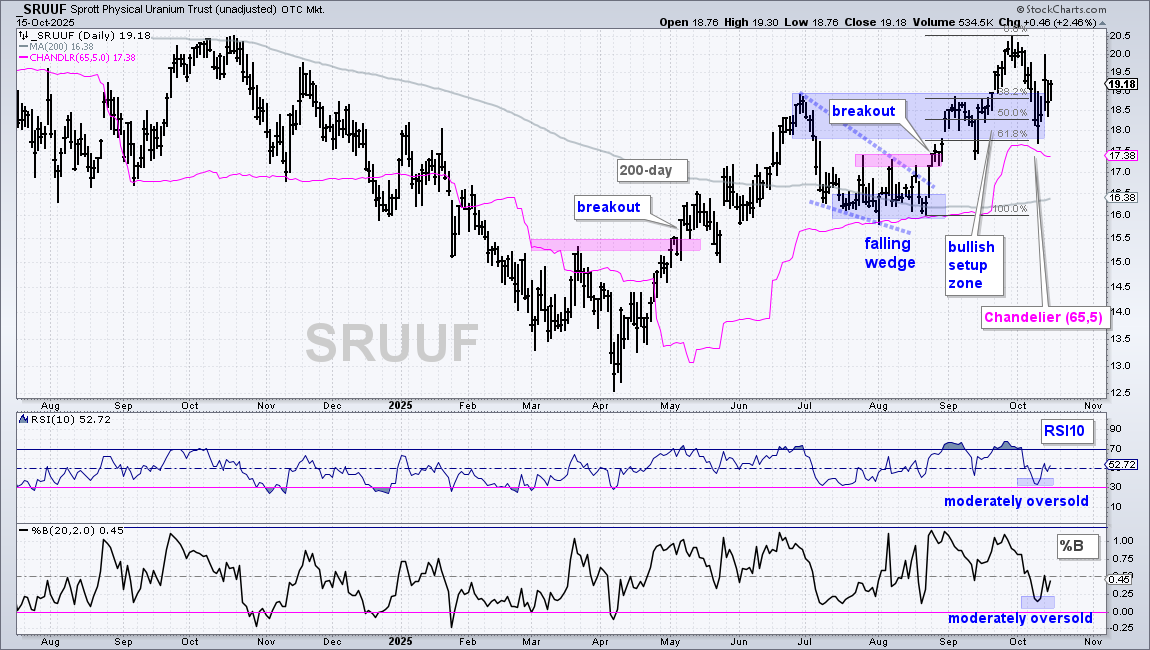
The Sprott Physical Uranium ETF (SRUUF) covers uranium as a commodity and the Uranium ETF (URA) represents uranium stocks. These two are positively correlated, but they can sometimes diverge. For example, SRUUF fell sharply in early July, but URA held firm. Similarly, SRUUF fell 4% on September 12th, but URA barely budged. Most recently, SRUUF fell to 18 in early October, but URA remained strong and moved to new highs.
The first chart shows SRUUF falling to a Bullish Setup Zone last week, which was featured last week[2], and bouncing this week. During a pullback, a Bullish Setup Zone is an area to watch for support and a reversal. I marked this zone last week using broken resistance, the early September consolidation-dip and the 38.2-61.8 percent retracements (blue shading). I realize that this is a wide zone, but this is a volatile ETF that deserves a wide berth. This Bullish Setup Zone is reinforced by the fact that RSI and %B became moderately oversold with moves in the 30-40 zone and 0-.25 zone, respectively. SRUUF is acting well with a bounce after the pullback and I remain bullish. The pink line shows the Chandelier Exit (65,5) for reference. You may wonder why this exit fell the last two weeks. This is because ATR(65) rose (higher volatility). The Chandelier Exit is 5 ATR(65) values below the 65-day high. This means it can fall when ATR(65) values rise.
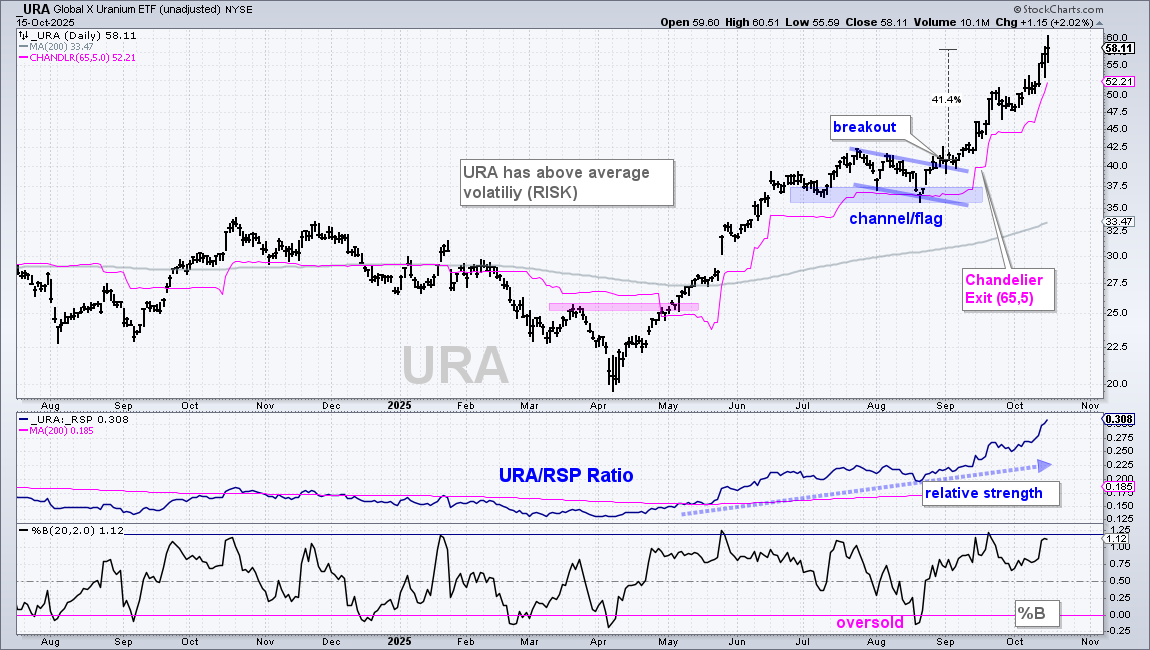
The next chart shows the Uranium ETF (URA) tacking on another 12% this week and hitting a new high. URA is now up some 40% since the breakout and up 60% since August 19th, which is also when GLD began its recent surge. URA is clearly in the trend-monitoring phase. The pink line shows the Chandelier Exit (65,5) at 52.21, which is around 11% below the current close. URA has above average volatility.
Bitcoin ETF Consolidates above Breakout Zone
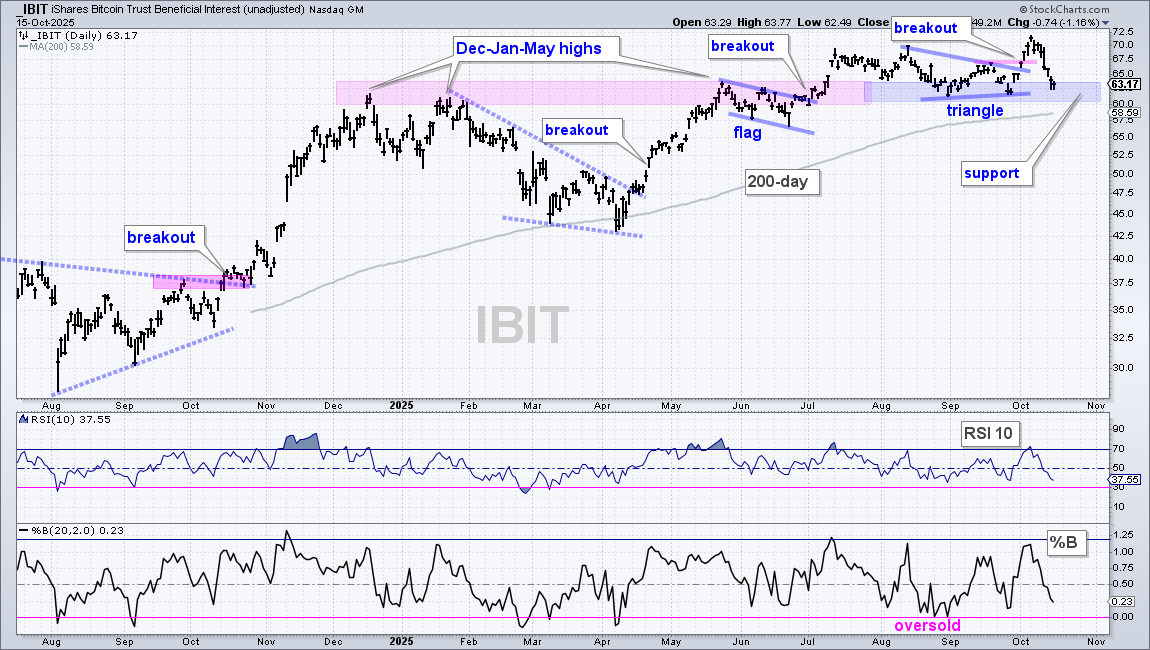
The Bitcoin ETF (IBIT) remains in a long-term uptrend as it consolidates above the mid July breakout zone. IBIT established resistance in the 60-63 area from December to May and broke out with a surge in mid July. Even though the ETF hit new highs in mid July, early August and early October, it has largely consolidated above the prior resistance zone (pink shading). Broken resistance turned support and this zone held in August-September (blue shading). I noted the triangle setup and breakout on October 2nd[3]. The ETF followed through on this breakout with a new high, but fell rather sharply the last seven days. IBIT is once again testing the support zone. I remain bullish because the ETF recorded new highs in July, August and October. Support, however, better hold. A close below 60 would break support and show an increase in selling pressure. This would be negative and increase the chances for a break below the 200-day SMA. I am removing the Chandelier Exit because it is in this support zone, which makes it redundant.
DISCLAIMER: This content provided strictly for informational and educational purposes. It should not be interpreted as an offer to buy or sell any security, nor as a solicitation to engage in any investment activity. Nothing here constitutes a recommendation regarding any specific security, portfolio, transaction, or investment strategy.
At times, the author or affiliates may hold positions or interests in securities discussed. Any stocks or examples mentioned are not endorsements or suggestions to purchase. This material does not consider your individual financial goals or circumstances, and you should seek guidance from a qualified financial or investment adviser before making any trading or investment decisions.
Past performance does not guarantee future results.
Send feedback to support(at)trendinvestorpro.com or use the contact form. [4]