Key Groups Lagging – XLK and QQQ Hold Channel Lines – XLU & XLV Hold Up
Posted By
Arthur Hill, CMT
On
In
Archive |
No Comments
Headlines
Key Economic Groups are Lagging
A Bull Market with Pockets of Weakness
SPY Breaks Channel Line
QQQ Stays within Channel
Large-caps are the Only Game in Town
7-10Yr Treasury Bond ETF Breaks Out
Technology SPDR Holds Rising Channel
XLC Falls Sharply and Lags in October
Utilities Hold Up with New High
Healthcare Pulls Back after Breakout
Key Economic Groups are Lagging
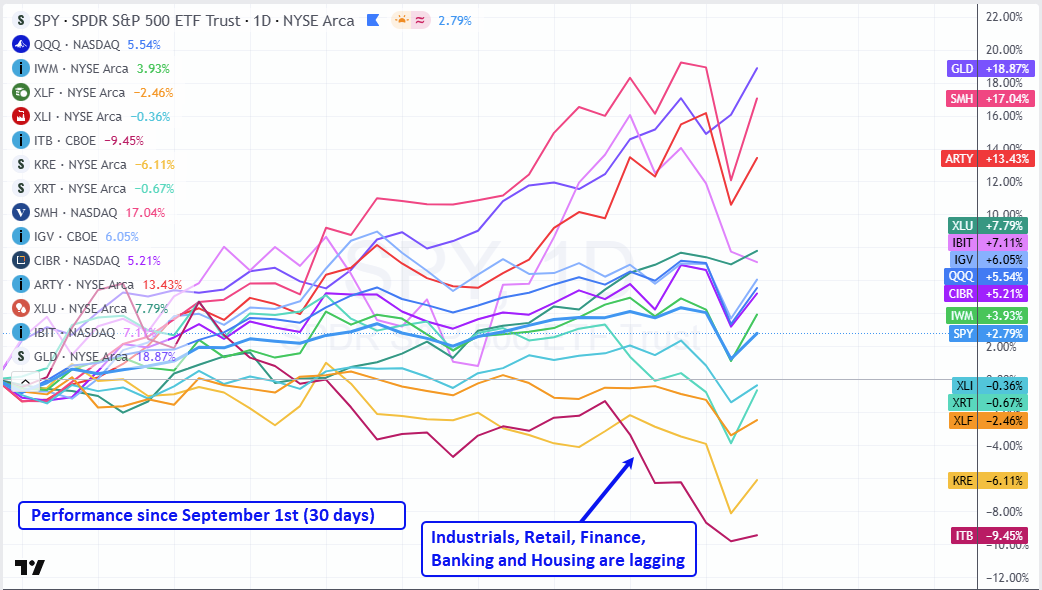
It is still a bull market, but some key groups are under pressure. We start with a performance chart showing the percentage gain/loss for 15 ETFs since September 1st. The right side of the chart shows the performance ranking. The Gold SPDR (GLD), Semiconductor ETF (SMH), Robotics AI ETF (ARTY), Utilities SPDR (XLU) and Bitcoin ETF (IBIT) are the best performers. SMH, ARTY and XLU represent the AI infrastructure trade. GLD and IBIT are alternatives to fiat currencies.
The bottom half of the chart shows the five laggards: the Industrials SPDR (XLI), Retail SPDR (XRT), Finance SPDR (XLF), Regional Bank ETF (KRE) and Home Construction ETF (ITB). These five groups are down since September, and weighing on the broader market. Weakness in these groups is a concern because they represent important areas of the economy (housing, retail spending, banking, manufacturing).
A Bull Market with Pockets of Weakness
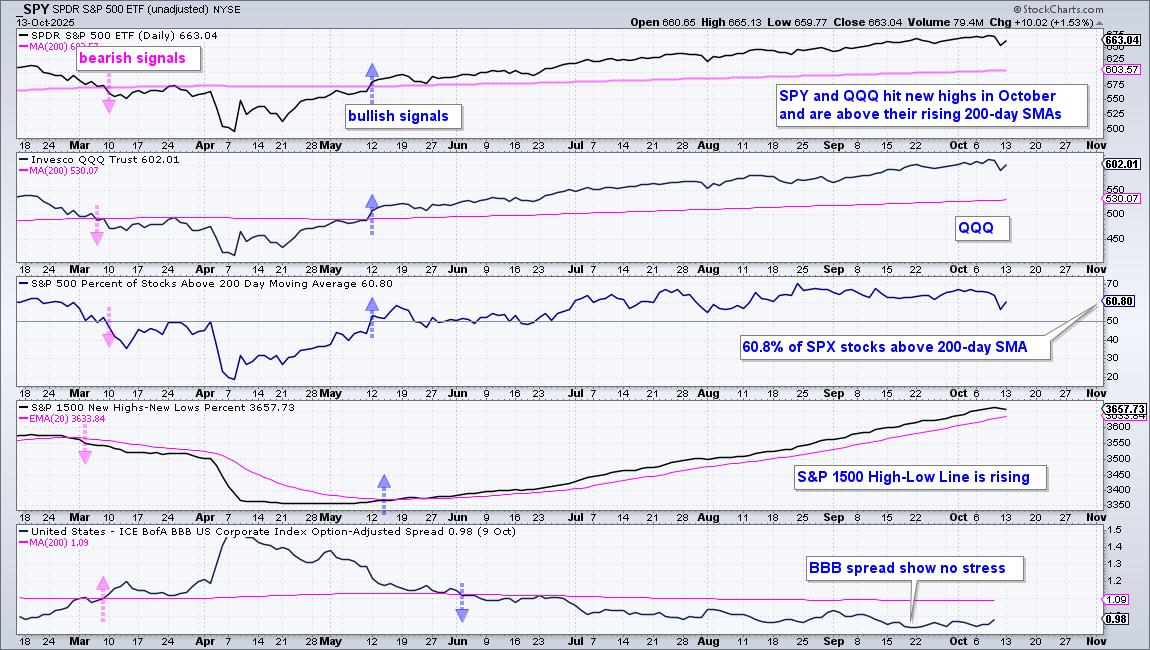
The next chart shows five indicators to assess market health. SPY and QQQ hit new highs in October and remain above their rising 200-day SMAs. Large-caps and large-cap techs are fine. 60.8% of S&P 500 stocks are above their 200-day SMAs. This is enough to prop up the S&P 500. A move below 50% would show the first sign of trouble. Even though the vast majority of stocks are in long-term uptrends, almost 40% of stocks in the S&P 500 are in long-term downtrends.
The S&P 1500 High-Low Line edged lower the last two days as new lows outpaced new highs on Friday and Monday. Overall, the High-Low Line is still rising and above the 20-day EMA. A break below the 20-day EMA would show the first sign of trouble. The BBB spread remains at low levels and below its 200-day SMA. Yield spreads show no signs of stress in the credit markets.
The left side of the chart shows what trouble looks like (early March). SPY and QQQ broke their 200-day SMAs, SPX %Above 200-day broke 50%, the S&P 1500 High-Low Line broke its 20-day EMA and the BBB spread broke its 200-day SMA (pink arrows).
SPY Breaks Channel Line
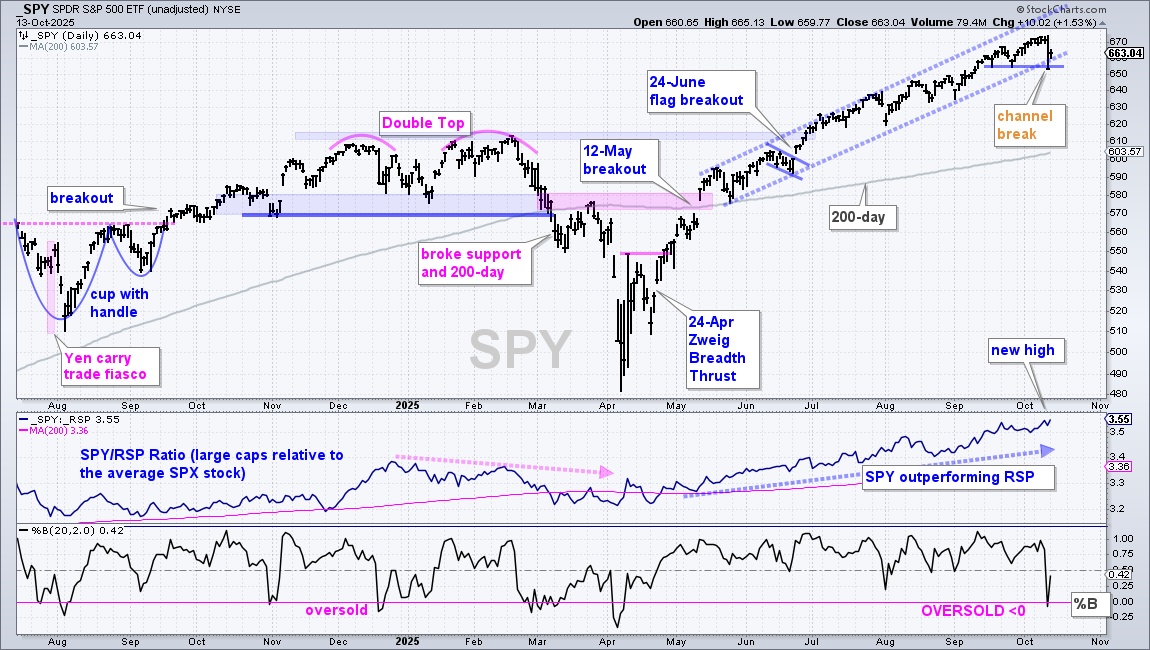
The rising channel defines the uptrend from mid May to October with the lower line capturing the rate of ascent. The steeper the line, the stronger the momentum (rate of ascent). With a sharp decline on Friday, SPY broke the channel line and the mid-late September lows. This is a shot across the bow for the bulls. Upside momentum was destabilized, which means SPY could enter a corrective period.
The lower window shows %B dipping below zero for the first time since early April. %B held above zero during the entire advance, which means it did not become oversold because the dips were shallow. Friday’s dip above average because it produced the first oversold reading. This means SPY closed below the lower Bollinger Band (20,2) for the first time since early April.
Now comes the nuance and interpretation. Technically, SPY became oversold (%B<0) within a long-term uptrend (above rising 200-day SMA). Normally, oversold within an uptrend is an opportunity. Friday’s decline, while news-related, was an outsized decline that destabilized the uptrend. SPY bounced on Monday, but the channel break occurred. As such, I think SPY is more likely to correct in the coming days or weeks. A correction can involve a pullback, a consolidation or a combination of the two (zigzag lower).
QQQ Stays within Channel
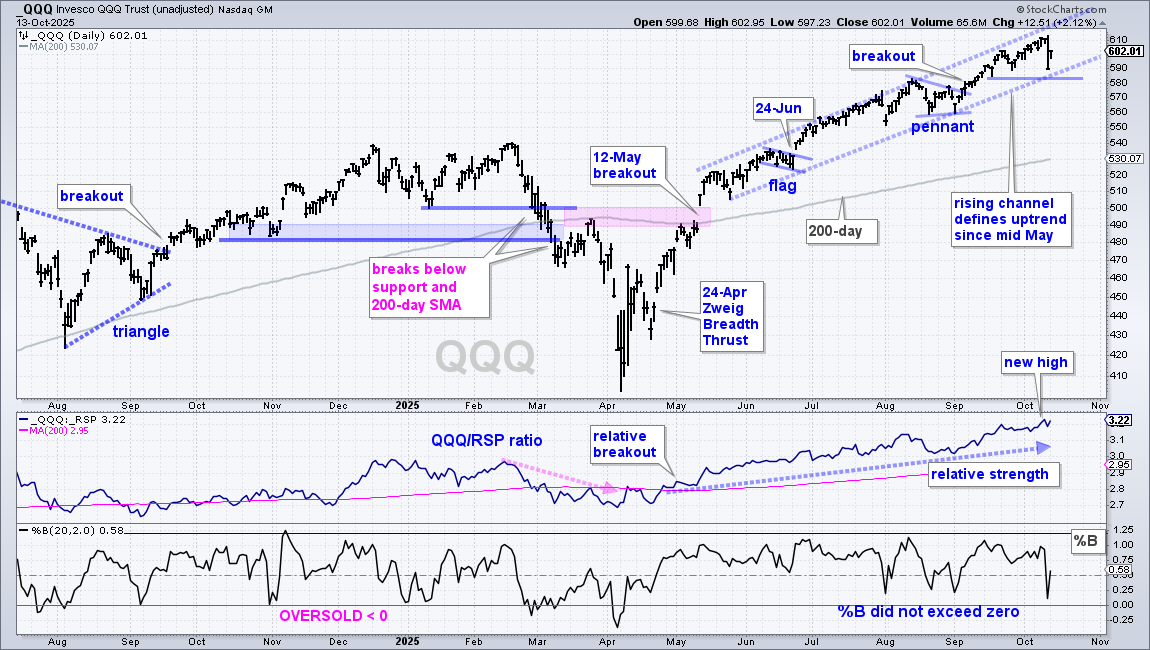
In a testament to relative strength, QQQ held above the channel line and did not break the mid September low (580). Also notice that %B did not break below zero. The lower line of the rising channel defines the upside momentum behind the advance. %B quantifies momentum and did not become oversold from May to October. Thus, we have yet to see a decline big enough to destabilize the uptrend in QQQ. A break below 580 would break channel support and argue for a corrective period.
Large-caps are the Only Game in Town
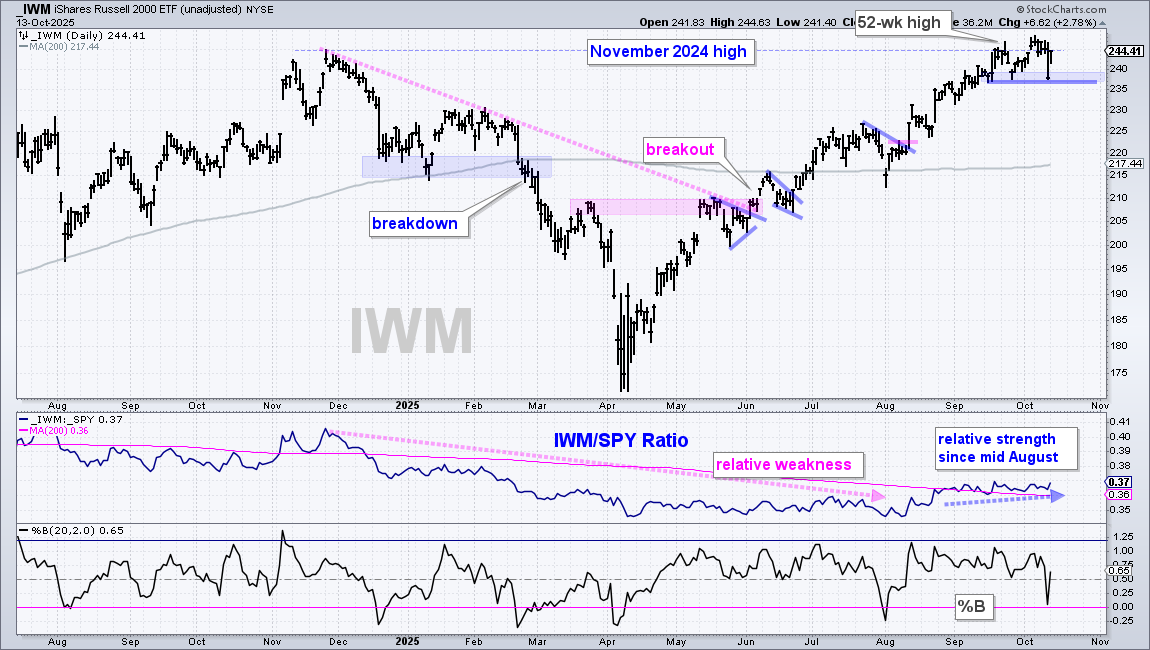
Even though the Russell 2000 ETF (IWM) hit a new high in October, it is still trading near its November 2024 high (dashed line) and has little to show over the past 11 months. SPY is some 10% above its November 2024 high, and QQQ is some 16% above this high. IWM is in the midst of a great run since April, but still lagging the big boys long-term. On the price chart, IWM stalled the last four weeks with support marked at 237. A break here would reverse the immediate uptrend and argue for a corrective period.
7-10Yr Treasury Bond ETF Breaks Out
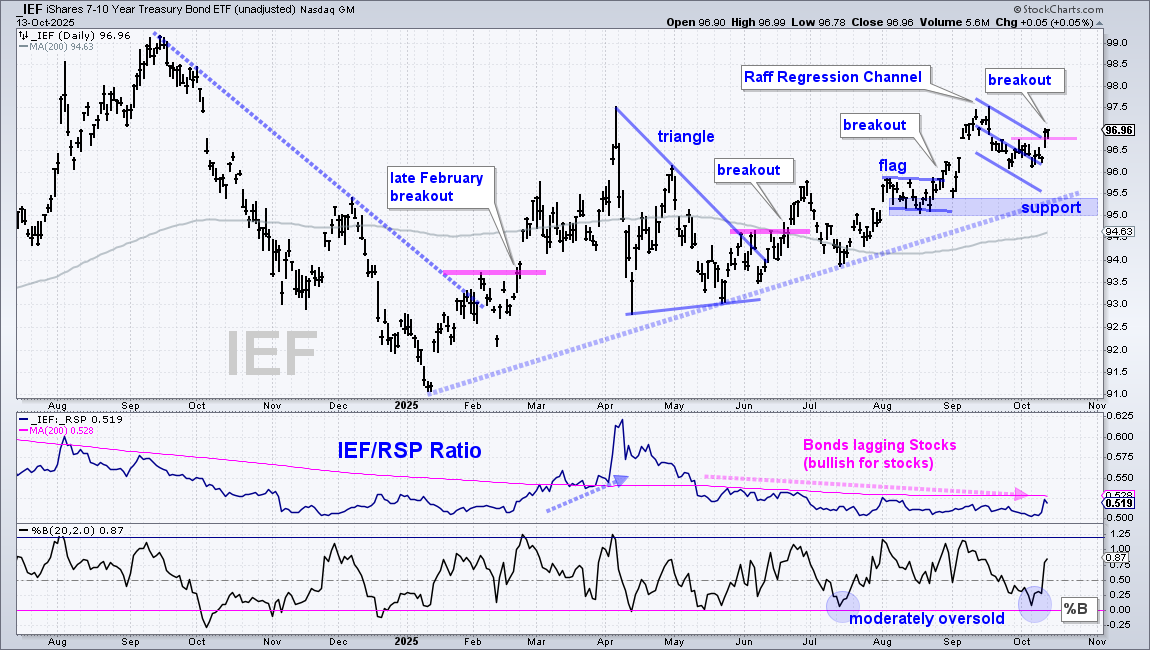
The 7-10Yr TBond ETF (IEF) and the 20+Yr TBond ETF (TLT) were in uptrends already and broke out of small consolidation patterns. The first chart shows IEF in an uptrend since the breakout in late February. There was a wild triangle consolidation in Q2 and then a breakout in late June. The ETF has since worked its way higher since July. Most recently, IEF corrected from mid September to mid October and broke out with a surge the last two days. This pattern/setup was featured in Thursday’s report[1]. I view this breakout as bullish and expect higher prices for IEF. This means I expect the 10yr T-Yield to fall.
The middle window shows the IEF/RSP ratio in a downtrend since mid May when it broke its 200-day SMA. Bonds represent the safe-haven asset, and stocks are the risk asset. In a bull market, bonds should underperform stocks (stocks outperform bonds). This has been the case from May to October as the price-relative fell. This ratio turned up sharply the last three days, but remains just shy of a breakout. Further upside would show bonds (safe haven assets) outperforming stocks (risk assets) and this would be negative for stocks.
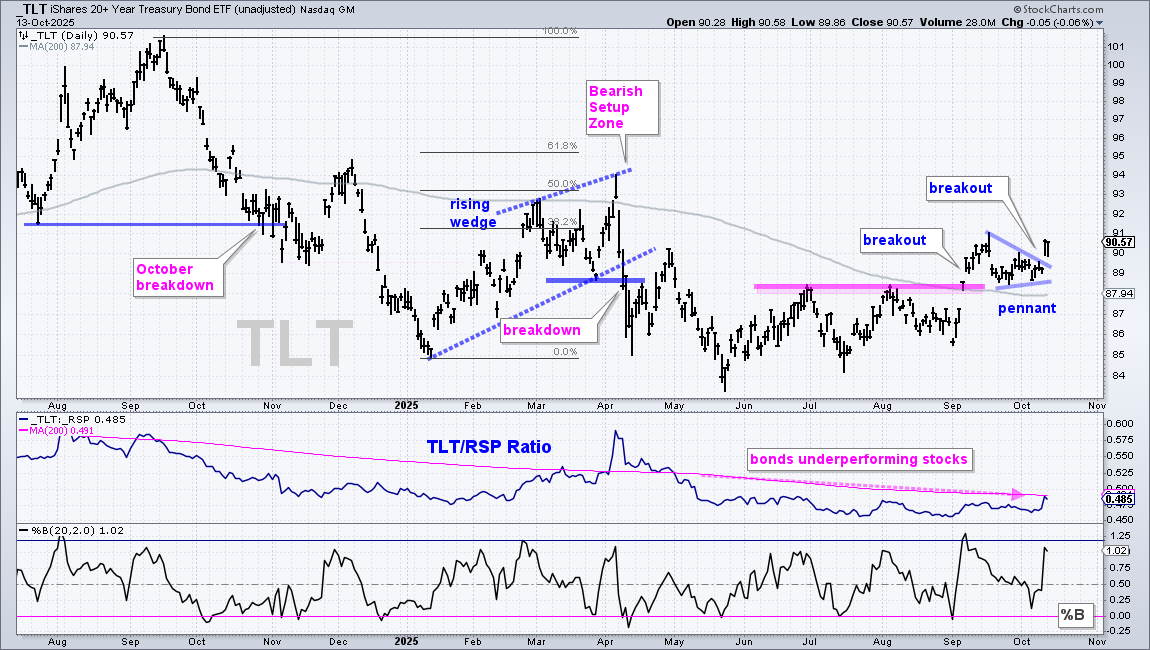
The next chart shows TLT breaking out with a surge in early September, consolidating above this breakout zone with a pennant and breaking the pennant line with a surge the last two days. The long-term trend turned up with the early September breakout. Short-term, the pennant was a consolidation after the September surge, which made it a bullish continuation pattern. This pennant breakout signals a continuation higher.
Technology SPDR Holds Rising Channel
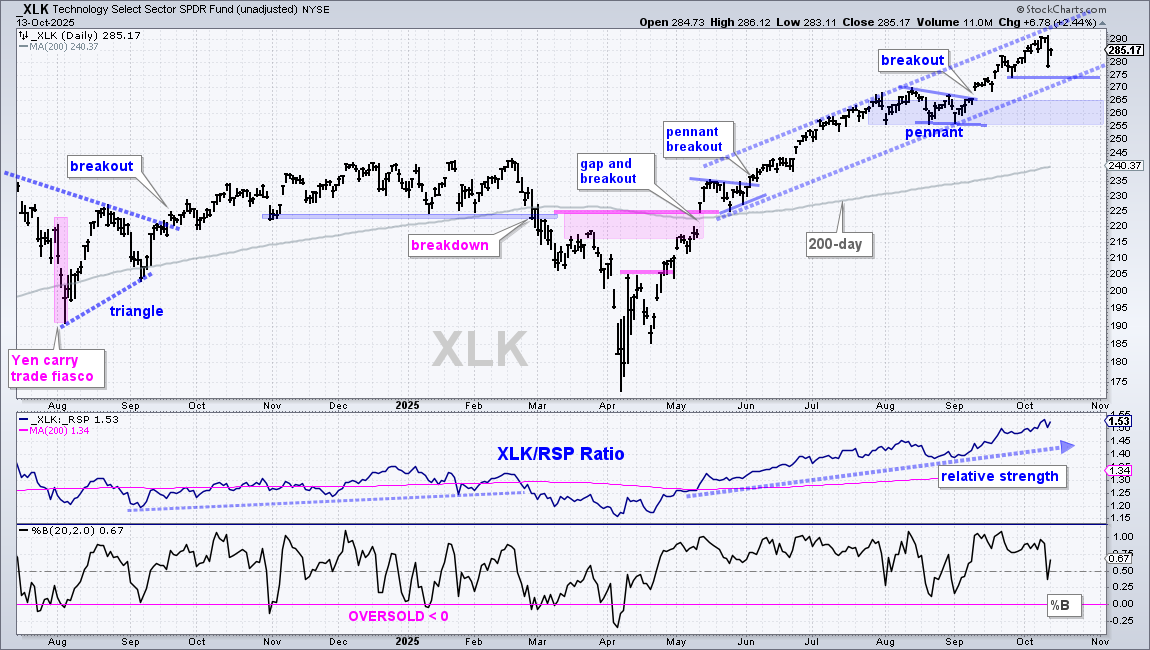
The Technology SPDR (XLK) and Communication Services SPDR (XLC) hold the key for SPY because these two sectors account for 34.91% and 10%, respectively. They are responsible for a large portion of the gains since late April. The first chart shows XLK hitting a new high last week and holding within its rising channel. No problems here. A move below the late September low (275) would break support and put the ETF in corrective mode. A pullback could extend into the 255-265 area (blue shading). Most tech-related ETFs will follow XLK.
XLC Falls Sharply and Lags in October
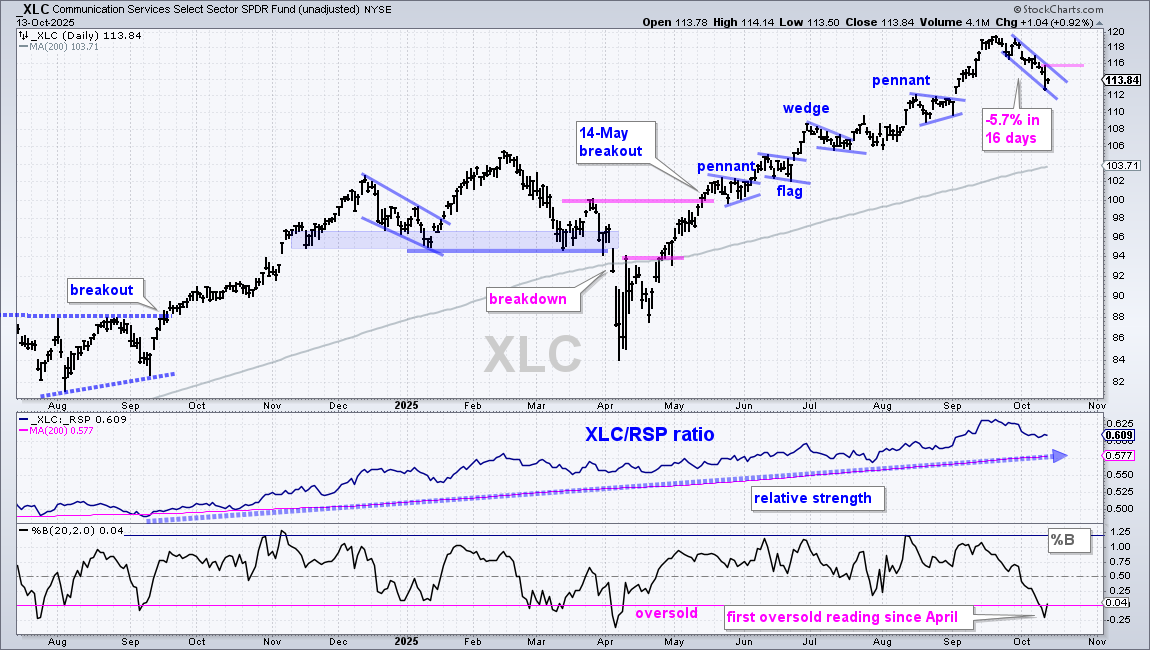
XLC led the market higher into September, but started underperforming in October and is down 3.83% so far this month. SPY, QQQ and XLK hit new highs in October, but XLC turned lower and did not hit a new high. XLC is still in a long-term uptrend, which means the current decline is a correction within this uptrend. We can see, however, that this pullback is different from the other corrections from May to August. These were short consolidations (pennant, flag, wedge, pennant). The current pullback is much deeper (5.7%) in three weeks. This shows an uptick in selling pressure and marks the beginning of a corrective period. Friday’s high marks first resistance and a breakout at 116 would be bullish.
Utilities Hold Up with New High
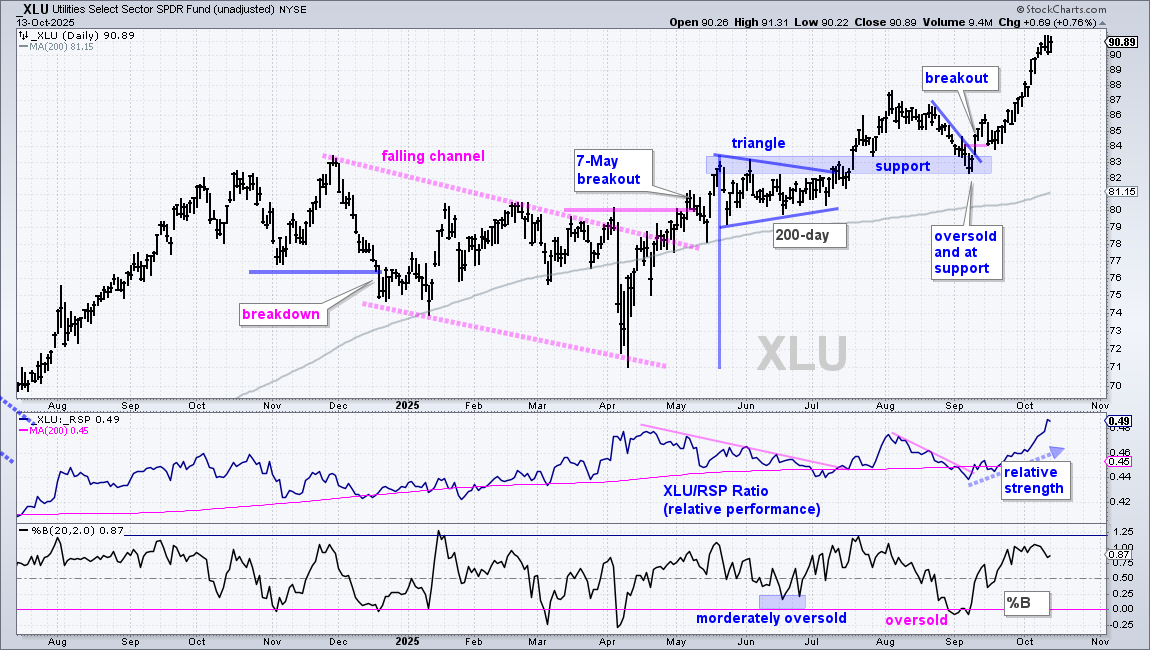
The Utilities SPDR (XLU) is a rare sector that provides exposure to the AI build-out and the defensive area of the stock market. I do not see a trading setup on this chart, just a leading uptrend with a new high in mid October. The long-term downtrend reversed with the May 7th breakout. XLU then formed a triangle into July and broke out. It then corrected with a pullback to resistance in early September and broke out. The extension higher since mid September was very strong with several new highs in October. XLU also shows relative strength as the XLU/RSP ratio turned up in September and hit new highs in October. XLU is in the trend-monitoring phase: strong trend and no setup.
Healthcare Pulls Back after Breakout
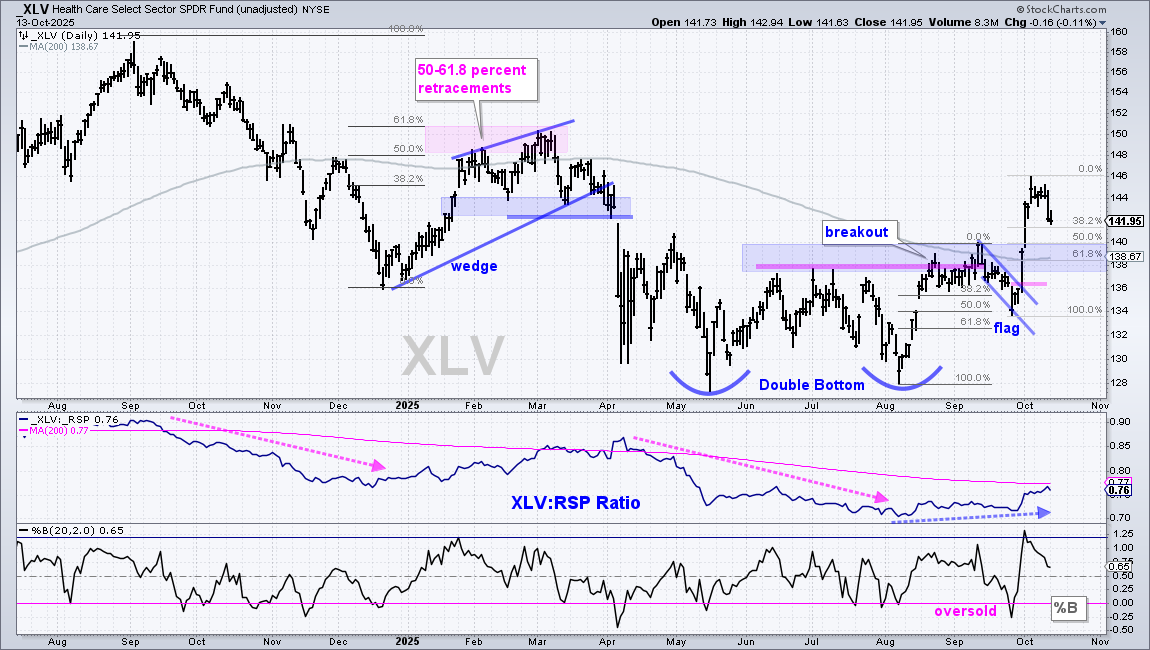
The Healthcare SPDR (XLV) also remains at the top of my list because it is a defensive sector and sports a trend-reversing breakout in late August. The double bottom was noted on September 9th[2] and the bull flag was featured on September 30th[3]. I remain bullish on Healthcare and am watching/waiting for a short-term bullish setup. XLV became short-term overbought after the surge above 144. It pulled back on Friday, but has yet to reach support or form a bullish continuation pattern (flag/wedge/pennant). Using broken resistance and the 50-61.8 percent retracements, I am marking a Bullish Setup Zone in the 138-140 area (blue shading). This is an area to watch for support and a bullish setup.
DISCLAIMER: This content provided strictly for informational and educational purposes. It should not be interpreted as an offer to buy or sell any security, nor as a solicitation to engage in any investment activity. Nothing here constitutes a recommendation regarding any specific security, portfolio, transaction, or investment strategy.
At times, the author or affiliates may hold positions or interests in securities discussed. Any stocks or examples mentioned are not endorsements or suggestions to purchase. This material does not consider your individual financial goals or circumstances, and you should seek guidance from a qualified financial or investment adviser before making any trading or investment decisions.
Past performance does not guarantee future results.
Send feedback to support(at)trendinvestorpro.com or use the contact form. [4]