Headlines
- Coinbase Breaks Short-term Resistance
- Microsoft Ends Short Correction with Breakout
- Cisco Bounces off Support Zone
- AMD Firms Near Key Retracement
- Heico Consolidates within Leading Uptrend
- Rockwell Consolidates within Leading Uptrend
I will update the Market Regime page later today.
Previous Reports with Stock Trends, Setups and Breakouts
September 24th: [1] ADSK, DGX, DRS, MELI, AEE, CNP, ETR and EVRG
September 10th: [2] COIN, DASH, GILD, HWM, KTOS, MKSI, PLTR and VEEV
September 3rd: [3]DIS, BROS, ELF, EW, DRS, AMZN and QCOM
August 27th [4]: CTVA, MELI, CHWY, LNG, BSX, AME, TDY, HON, AAPL, CSCO
August 13th [5]: CCK, TTWO, NFLX, UBER, ABBV, CTAS, PANW, AAPL, TSLA, ASML
Today’s report features six stocks in leading groups. These include the MAG7, Aerospace & Defense, Robotics & Automation, Crypto, Semis and AI Data Center. The market environment is currently bullish, but there are some sizable pockets of weakness because around a third of S&P 500 stocks are below their 200-day SMAs. Chartists can increase the odds of success by focusing on stocks in leading uptrends and within leading groups.
Coinbase Breaks Short-term Resistance
Coinbase (COIN) was featured on September 10th as it broke short-term resistance near 320 (pink line). After a 209% surge, the stock fell 34% with a pullback to the 300 area. The decline into early August grabbed my attention because it retraced 50% of the preceding rally. Simultaneously, %B signaled oversold conditions by moving below zero. And, most importantly, buyers appeared as the stock firmed up in the 290–300 range from early August through early September (blue shading). A 50% retracement is normal for a correction within a bigger uptrend. Think two steps forward and one step backward. The short-term breakout on September 10th signaled the first increase in buying pressure. COIN surged past 350 on September 19th, only to retreat to the low 300s last week. With a pop this week, the stock again affirmed support in the 290-300 area. More importantly, the breakout is alive and well. A close below 290 would warrant a re-evaluation.
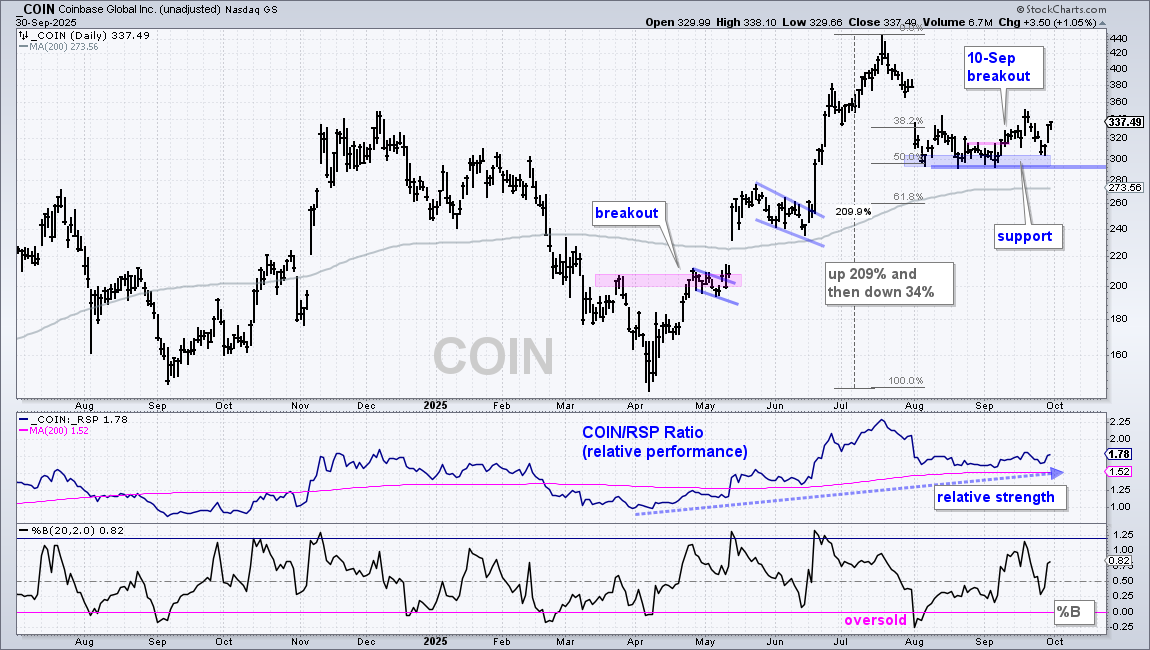
The middle window shows the price-relative (COIN/RSP ratio) moving above its 200-day SMA in May and rising into mid July. This relative performance line fell as the stock corrected in early August, but remained above its 200-day SMA. COIN shows long-term relative strength. Note that COIN has above average volatility (RISK) with the re-evaluation level almost 15% below current levels.
Microsoft Ends Short Correction with Breakout
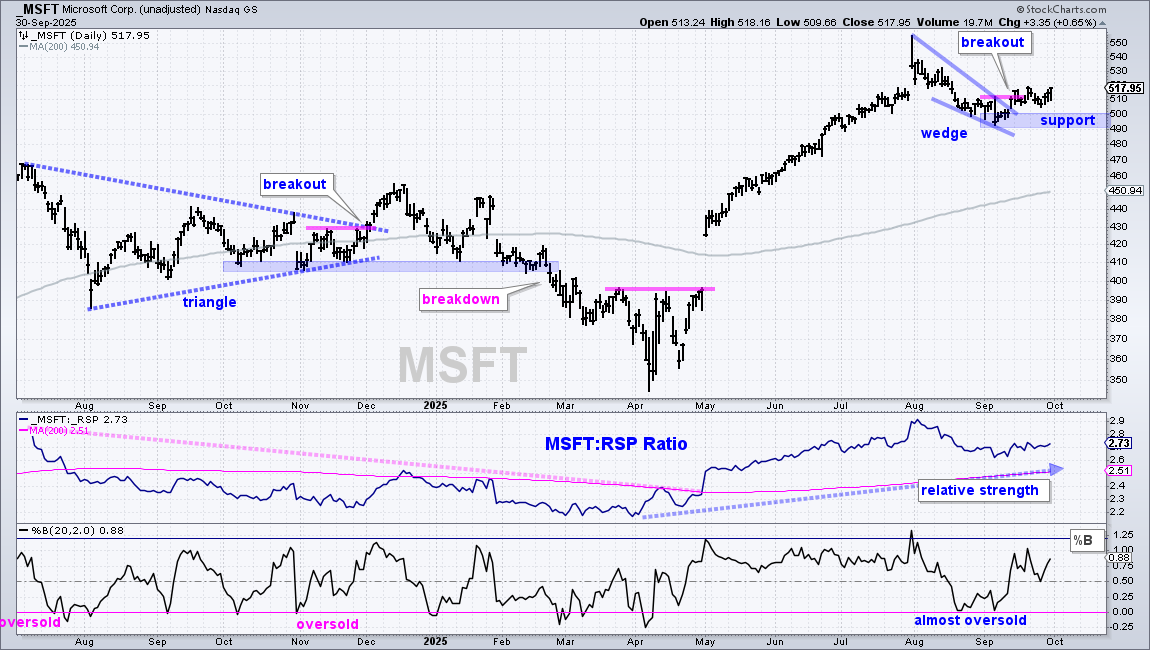
Microsoft (MSFT) led the market off the April lows with a surge from 350 to 550. Pullbacks were non-existent in May, June and July as the stock moved steadily higher. MSFT finally corrected with a falling wedge from early August to early September. This is a short-term corrective pattern that marks a rest within the ongoing uptrend. It is also worth noting that %B was almost oversold in mid August and early September (bottom window). The stock broke out with a surge above 510 on September 15th. MSFT has since oscillated around the 510 area, but the breakout is still valid and it signals a continuation higher. The September lows mark support in the 490-500 area. A close below 490 would call for a re-evaluation. The middle window shows the price-relative breaking out in early May and trending higher the last five months. MSFT exhibits relative strength.
Plan your Trade, Trade your Plan and Diversify
There are two ways to approach these short-term setups.
First, trade them as swing trades. A falling flag or wedge breakout is bullish and this signal remains valid until a break below the re-evaluation level, which is usually the low just before the breakout. For short-term trading, I usually set a profit target and close one third to one half of the position when this target is reached. A trailing stop is then placed to ensure that the entire trade does not result in a loss.
Second, use short-term setups to participate in the bigger uptrend. Bullish setups stem from short-term oversold conditions, falling wedges/flags or pullbacks. Instead of a re-evaluation level, the exit signal is based on a long-term trend change and a trend-following exit. Signals include a cross below the 200-day SMA, a major support break, a Chandelier Exit or a Keltner Channel break. This means the potential loss will be larger, but there is also a possibility to take part in an extended uptrend.
Thus, plan before making the trade, and then trade according to that plan. Also consider position sizing and diversification to spread the risk.
Cisco Bounces off Support Zone
Cisco (CSCO) is consolidating within a leading uptrend. The stock surged to new highs in June with a break above the February-May highs. This broken resistance zone turned into support as the stock held the 66 area from July to September. Overall, CSCO is simply consolidating within a long-term uptrend. Consolidations digest the gains and pave the way for the next move. With the long-term trend up, the odds favor an upside resolution. Short-term, the stock broke out with a pop on September 18th. This is the first sign of increased buying pressure. We have yet to see upside follow through, but the breakout is a positive sign.
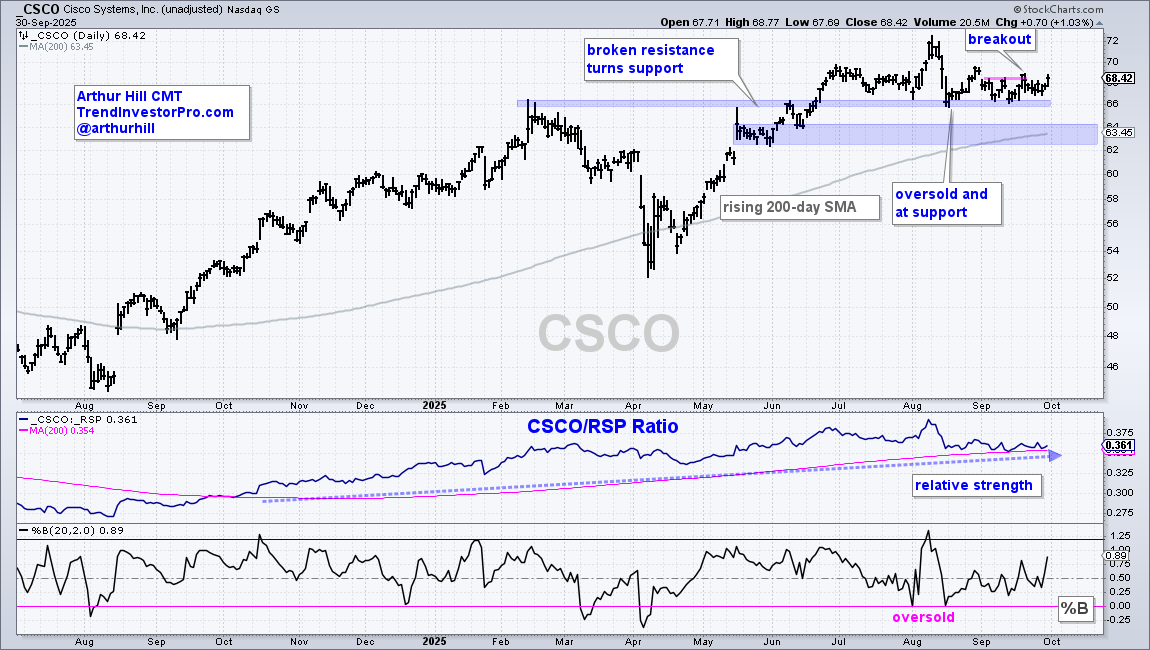
A close below 66 would break short-term support and argue for a corrective period. Even with a break below 66, the long-term trend would still be up. This makes trading tricky. A correction into the 62-64 zone could lead to the next bullish setup. This is why traders must plan their trades before initiating a trade. A short-term trader (The Trader) would have a relatively tight stop and be out on the first break (66). A trend-follower (The Accumulator) would allow more wiggle room and set a wider stop-loss. Also note that we are in a bull market, tech is leading and AI is leading within tech. CSCO fits into these themes.
AMD Firms Near Key Retracement
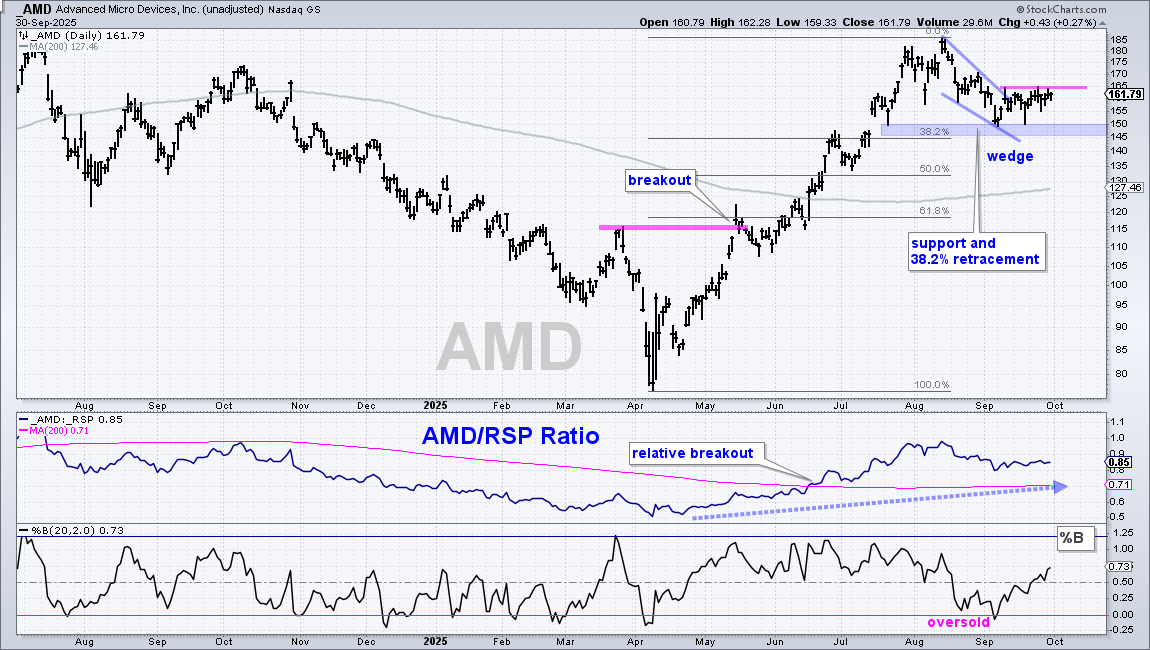
Advanced Micro Devices (AMD) surged over 100% from early April to mid August. As with many AI plays, this move was pretty much straight up from May to July with shallow pullbacks. AMD finally corrected in August with a falling wedge that retraced around 38% of the prior advance. Note that I prefer to mark 33 to 67 percent retracements, which Charles Dow used. StockCharts uses the Fibonacci numbers (38.2 and 61.8 percent). There is not a big difference because retracement levels are simply areas to watch for support on a pullback. Thus, the 33 and 38.2 percent retracements are the first areas to watch. AMD also established support around 150 with lows in July and September (blue shading). Taken together, there is a bullish setup zone marked by the 38% retracement and supports. This is an area to watch for firming and a reversal. AMD is firming, but remains short of a reversal. A breakout at 165 would be bullish and argue for an assault on the August highs. A close below 145 would negate this setup.
Heico Consolidates within Leading Uptrend
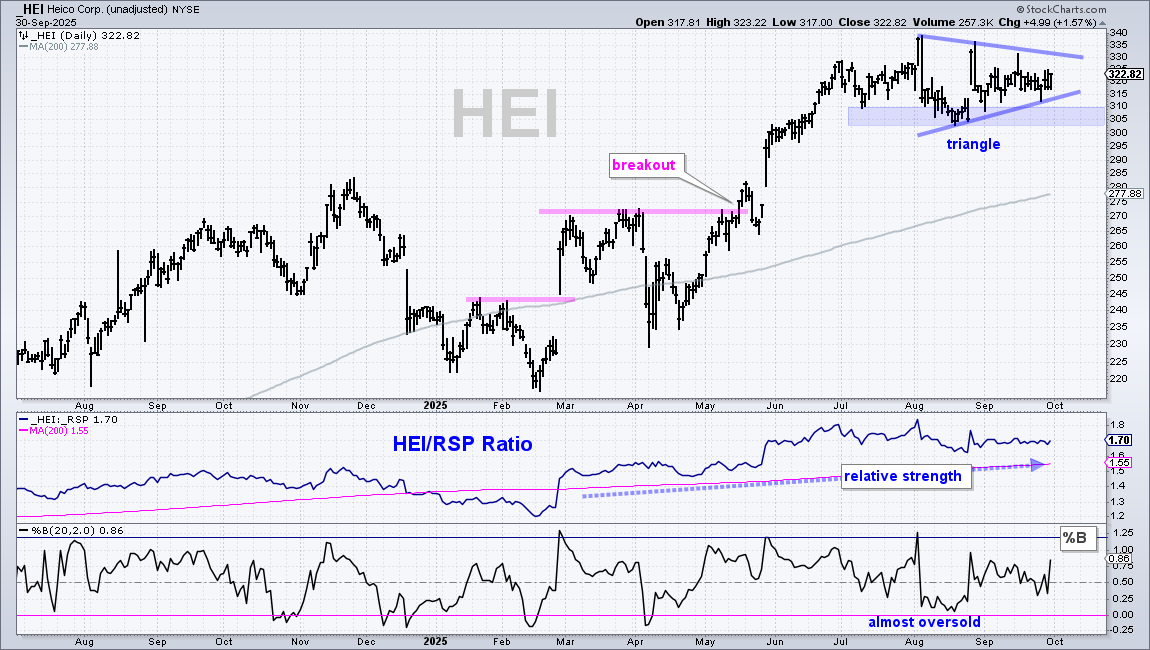
Heico (HEI) is part of the Aerospace & Defense ETF (ITA), which is leading the market. The stock broke out with surges in late February and May. After hitting new highs from late May to early August, the stock corrected with a triangle consolidation. A consolidation within an uptrend is a bullish continuation pattern. Given the long-term uptrend and strong industry group, the odds favor an upside resolution. The blue shading marks a support zone from July to September (303-310). A break below 303 would negate the pattern and argue for a deeper correction within the long-term uptrend. The middle window shows the price-relative breaking out in late February and moving higher as HEI outperforms the broader market.
Rockwell Consolidates within Leading Uptrend
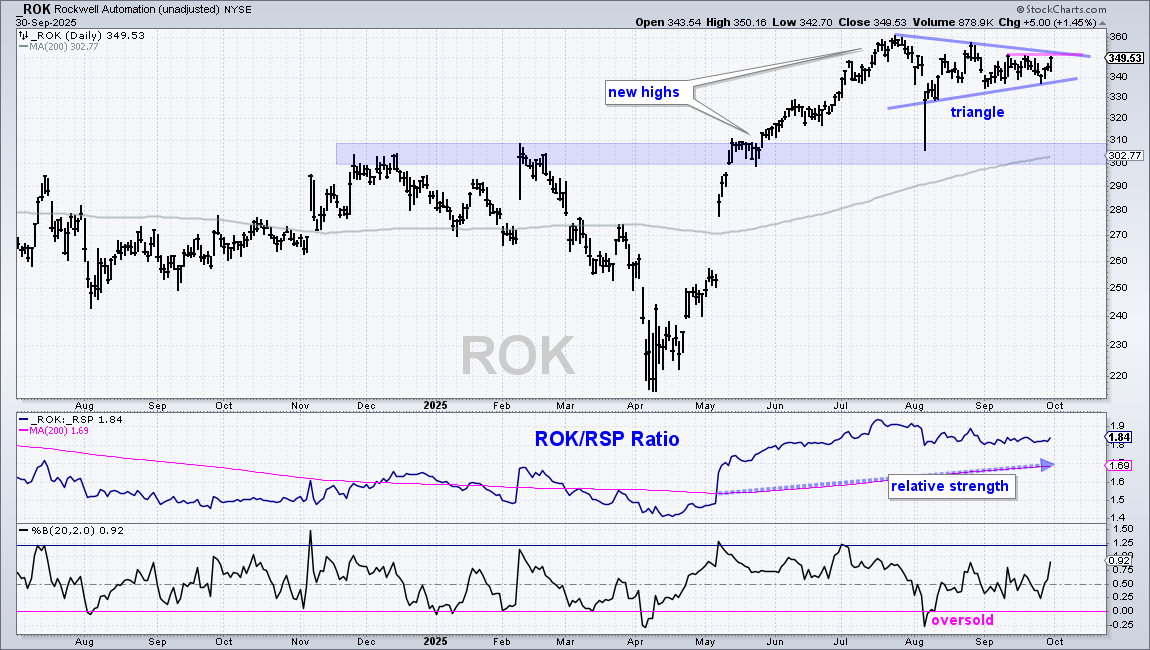
Rockwell Automation is part of the Industrials SPDR (XLI) and the Robotics & Automation ETF (ROBO). The chart is very similar to HEI (above). ROK surged from April to July and then consolidated with a triangle. The stock established resistance with the September highs and a breakout at 352 (pink line) would be bullish. A break below the September lows (334) would negate the triangle and argue for a deeper correction within the long-term uptrend. The middle window shows the price-relative breaking out in early May and holding well above its 200-day SMA. ROK shows long-term relative strength.
DISCLAIMER: This content provided strictly for informational and educational purposes. It should not be interpreted as an offer to buy or sell any security, nor as a solicitation to engage in any investment activity. Nothing here constitutes a recommendation regarding any specific security, portfolio, transaction, or investment strategy.
At times, the author or affiliates may hold positions or interests in securities discussed. Any stocks or examples mentioned are not endorsements or suggestions to purchase. This material does not consider your individual financial goals or circumstances, and you should seek guidance from a qualified financial or investment adviser before making any trading or investment decisions.
Past performance does not guarantee future results.
Send feedback to support(at)trendinvestorpro.com or use the contact form. [6]