Bonds Extend High – Gold/Silver Miners Overextended – BitCoin Breaks Out
Posted By
Arthur Hill, CMT
On
In
Archive |
No Comments
Headlines
Next Week’s Schedule
7-10Yr TBond ETF Extends Uptrend
Gold, Silver and Miners are Strong and Extended
Copper ETF Edges Higher
DB Base Metals ETF Springs to Life
Uranium Pulls Back with Sharp Decline
Bitcoin Breaks Out
Programming Note for Next Week
I am posting reports and videos on Saturday (September 13th) because I am traveling next week and it will be difficult to post regular updates. These Saturday reports set the stage for next week with key support levels to watch, recent breakouts to monitor and the situation with market breadth. It is a bull market until proven otherwise.
The Fed meets next week with a policy statement expected on Wednesday, September 17t. Fed statements and actions can lead to above average volatility in the markets (bonds, stocks, gold, $USD). It is important to ignore intraday noise and put price action into perspective. Focus on the charts. Check the trend, pattern at work, active signal, re-evaluation level and support level.
Traveling Next Week – Limited Coverage
Saturday 15-Sept: Report/Video covering Broad Market and Alternative ETFs
Wednesday 17-Sep: Educational Report/Video
Monday 22-Sep: Report/Video with Chart and Analysis Updates
Bonds, precious metals, industrial metals and Bitcoin all moved higher in September. Throw in stocks and we have bull markets almost everywhere. Bonds extended on their late June signal, gold and silver extended on their late August breakouts, and Bitcoin broke out of a falling flag this week. Next week could bring fireworks because the Fed meets on Tuesday-Wednesday. It is often best to ignore the intraday fluctuations and focus on the charts. Check the trend, patterns at work, active signals, re-evaluation levels and supports.
7-10Yr TBond ETF Extends Higher
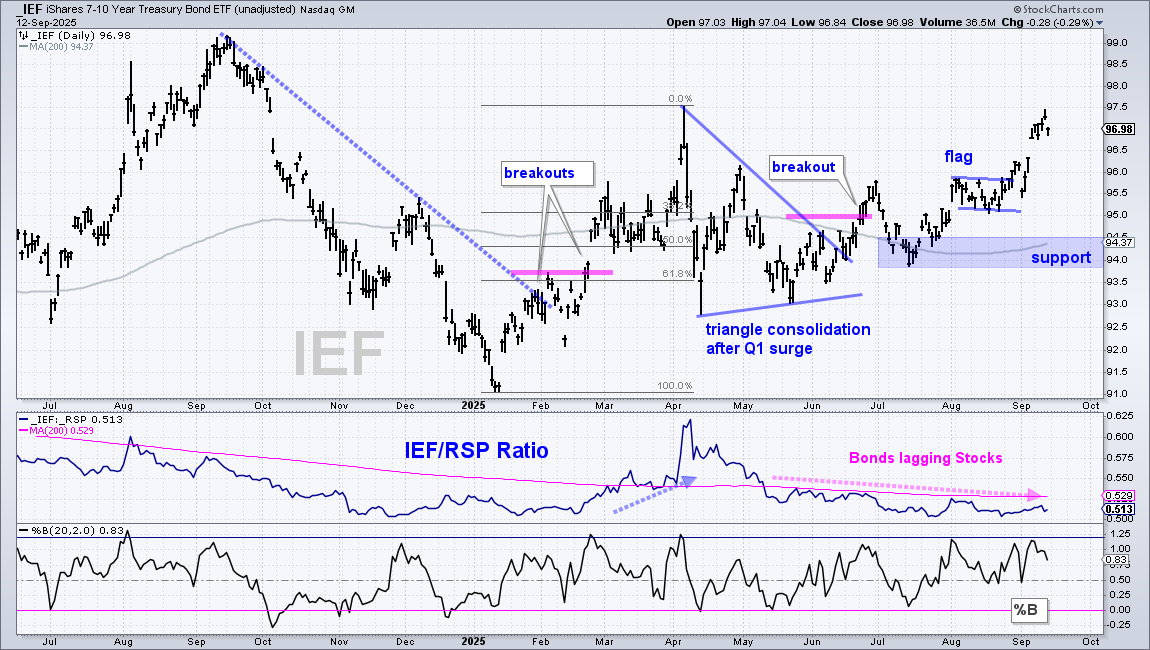
The 7-10Yr TBond ETF (IEF) remains in an uptrend with a new closing high for 2025 this week. Overall, IEF surged in Q1, corrected in Q2 and broke triangle resistance in late June. After a throwback into mid July, the ETF moved sharply higher the last nine weeks with a flag breakout along the way. The July low and 200-day MA mark support in the 93.8-94.5 area (blue shading). The middle window shows IEF lagging SPY since mid May. Safe-haven bonds are underperforming riskier stocks, which means risk is on.
Gold and Silver are Strong and Extended
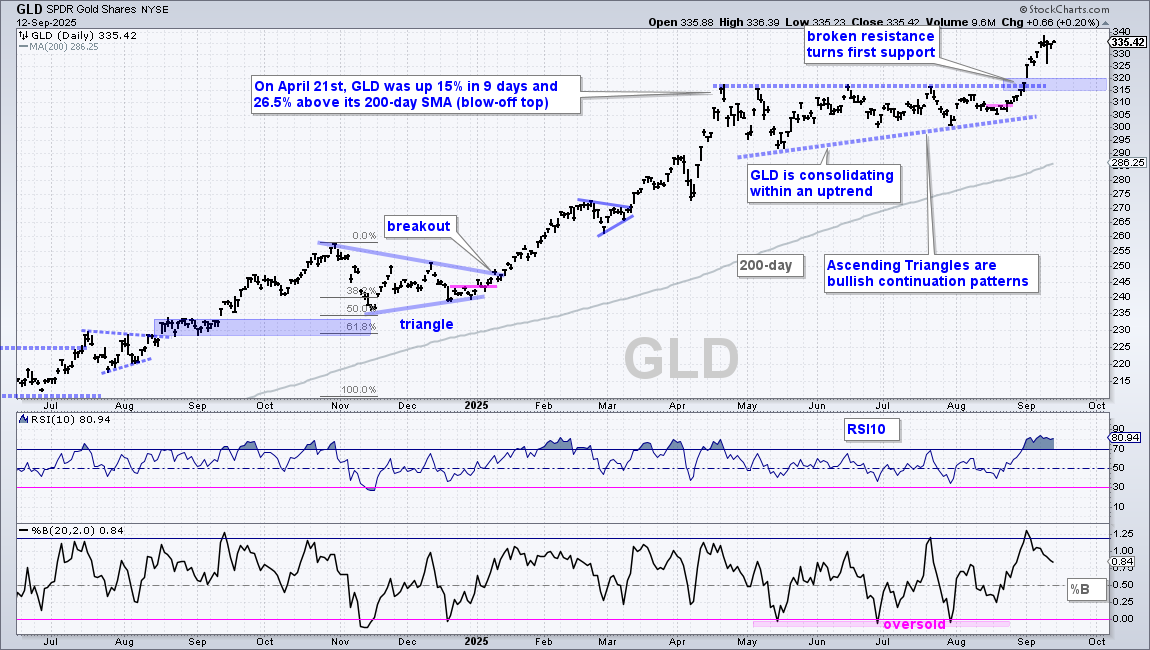
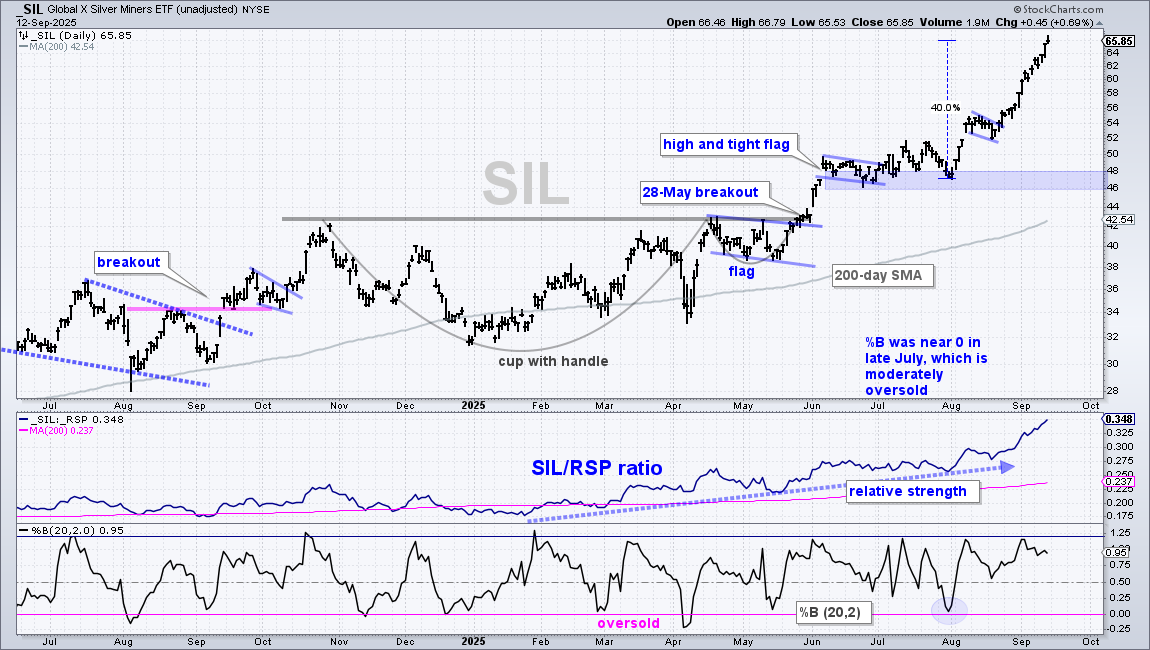
The Gold SPDR (GLD), Silver ETF (SLV), Gold Miners ETF (GDX) and Silver Miners ETF (SIL) are in long-term uptrends with fresh new highs this past week. All four are up sharply since mid August. They are in the trend-monitoring phase and I do not see any chart setups on the charts. This is the time to monitor price action and wait for the next setup. The first chart shows GLD breaking Ascending Triangle resistance and surging to the 335 area. The breakout zone in the 315-320 area turns first support.
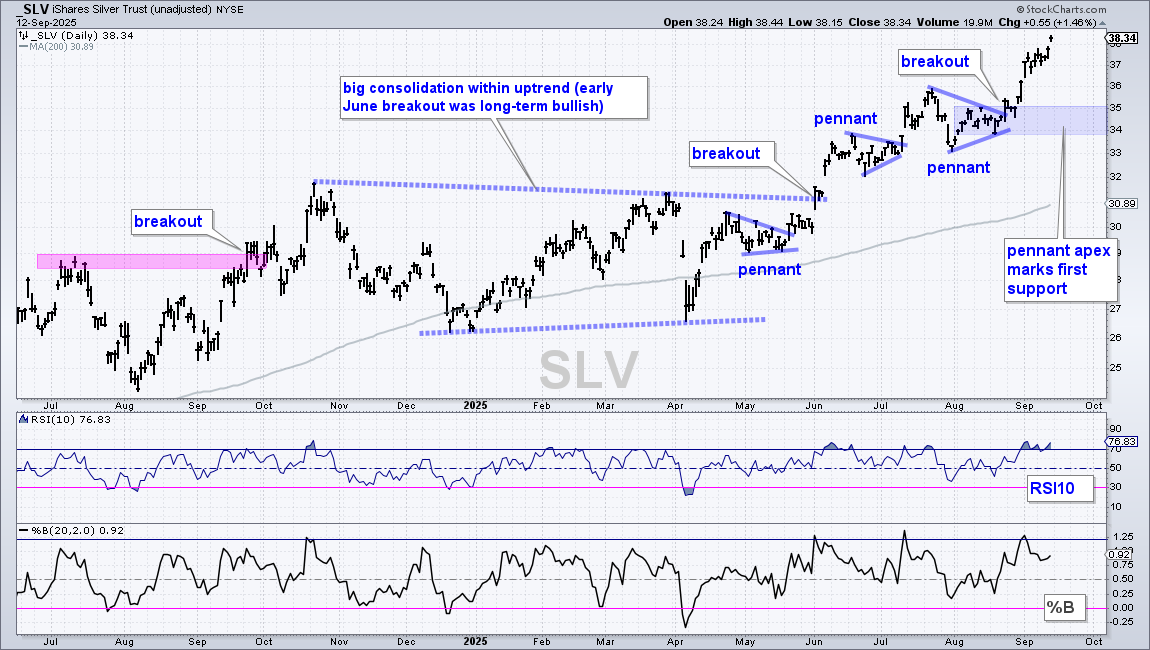
The next chart shows the Silver ETF (SLV) with the pennant apex marking first support in the 34-35 area.
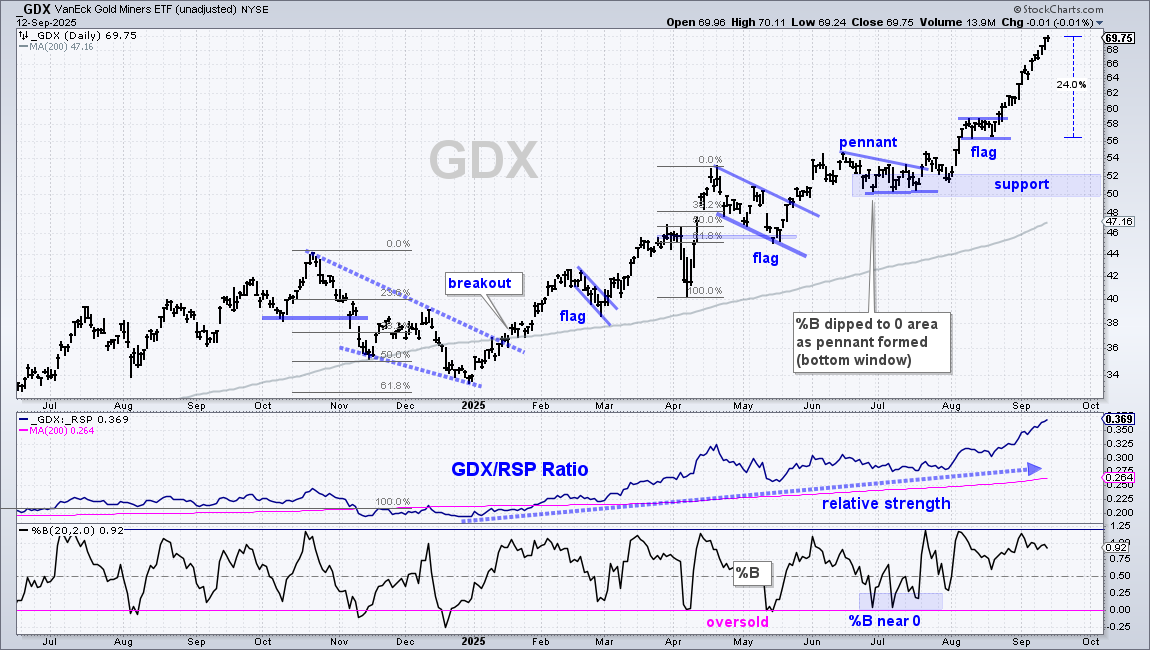
The next chart shows the Gold Miners ETF (GDX) with a 24% surge in 17 days (20-Aug to 12-Sep) and a 40% surge from mid July to mid September. GDX is in a leading uptrend with strong upside momentum. Don’t forget, however, that momentum cuts both ways. There is clearly no setup on this chart and GDX is getting ripe for a corrective period after these big runs.
The next chart shows the Silver Miners ETF (SIL) with similar characteristics: strong, overextended and ripe for a correction.
Copper ETF Edges Higher
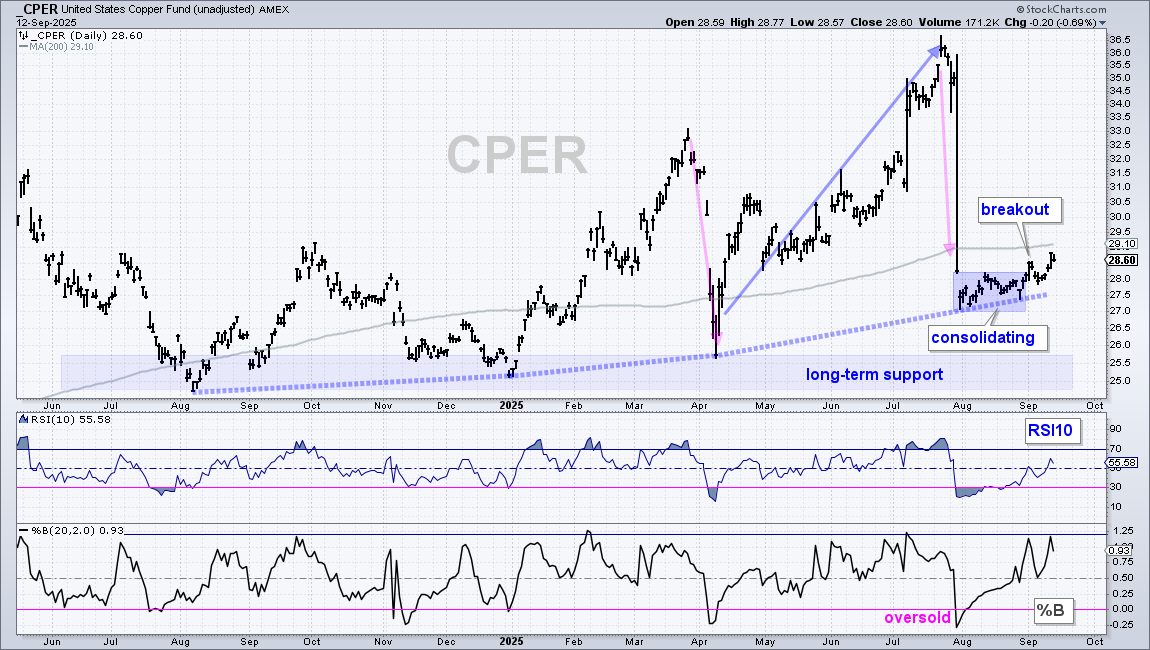
The Copper ETF (CPER) continues to work its way higher after a gut-wrenching plunge in late July. Overall, I still see evidence of an uptrend on this chart with higher lows in January, April and July (blue dashed lines). There are also higher highs. Volatility is the only issue with this uptrend because the swings are huge. Most recently, CPER plunged to the 27 area in late July, firmed for a month and broke out with a surge on September 3rd. This affirms the higher low from April to July and starts a short-term uptrend. The July lows mark support at 27 and a close below this level would argue for a re-evaluation.
DB Base Metals ETF Springs to Life
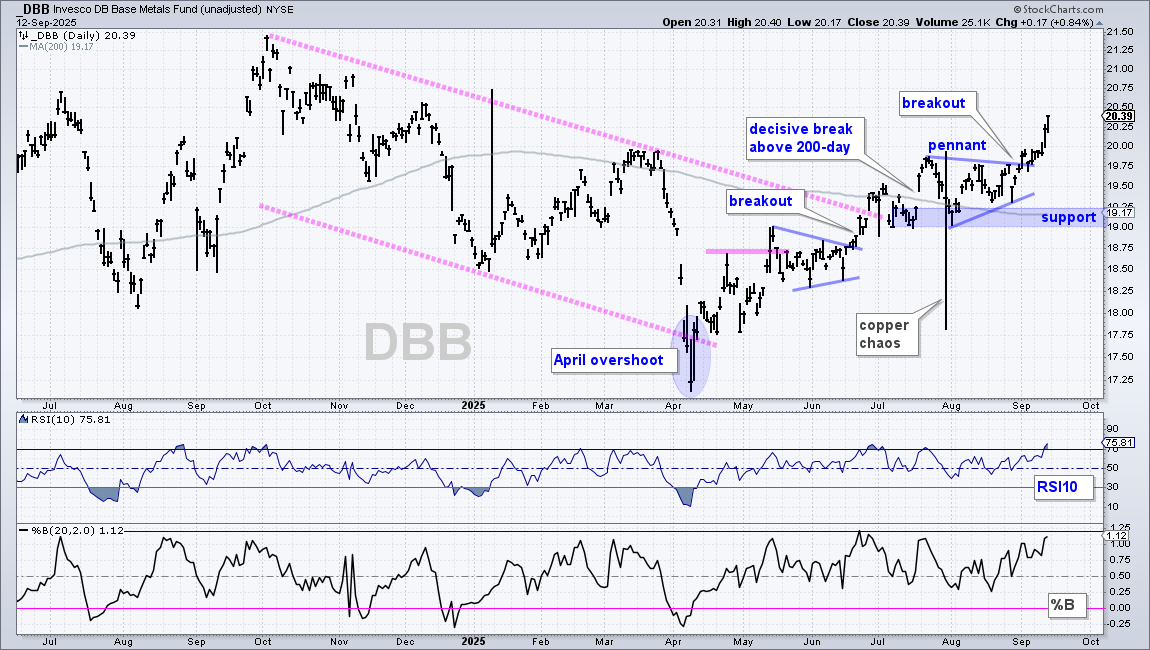
The DB Base Metals ETF (DBB) caught a bid this week as it surged to a new high for 2025. ETFs hitting new highs for the year are in leading uptrends. We have been following DBB since the pennant breakout in late June.[1] After this breakout, DBB extended above the channel trendline and 200-day SMA in July, formed another pennant into August and broke out in early September. The trend since April is clearly up with support marked in the 19-19.25 area.
Uranium Pulls Back with Sharp Decline
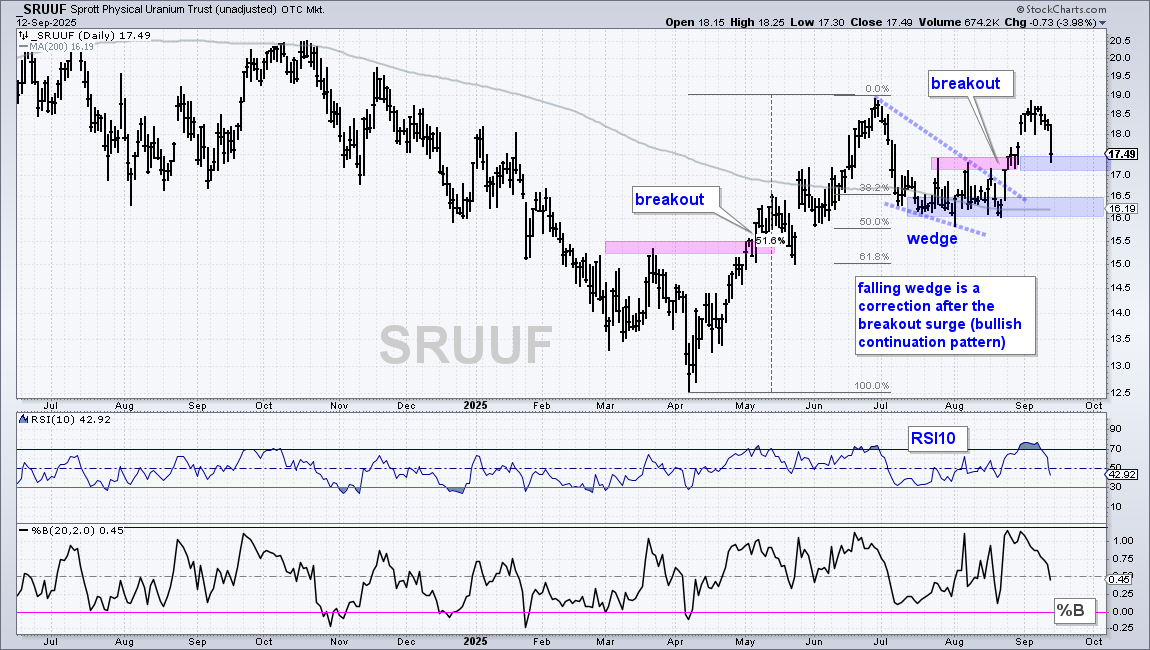
The Sprott Physical Uranium (SRUUF) remains in an uptrend with a breakout working, but the ETF fell sharply with a 4% decline on Friday. Sharp declines are concerning, but it is important to put the decline into perspective and trade based on the chart. SRUUF remains in a long-term uptrend with price above the 200-day SMA. Short-term, a wedge formed and the ETF broke out with a surge in late August, which was featured in this report. The breakout zone in the 17-17.50 area turns first support. This means the current decline could be a throwback to the breakout (support) and a second chance to partake. Long-term, SRUUF established support in the 16-16.5 area with a consolidation from mid July to mid August. A close below 16 would break support and the 200-day SMA, calling for a re-evaluation.
SRUUF was trading in the 17.5-17.8 area when featured on August 28th[2]. It then surged to the 18.50 area and stalled here for a few days. Entries are very important because a good entry makes for a good risk/reward ratio. Entries in the 18.50 carried extra risk because the re-evaluation level was at 16 (~13.5% lower). Entries in the 17.5 area carry less risk because the re-evaluation was closer (~8.5% lower). Based on these risk percentages, we can see that this ETF has above average volatility (risk).
Bitcoin Breaks Out
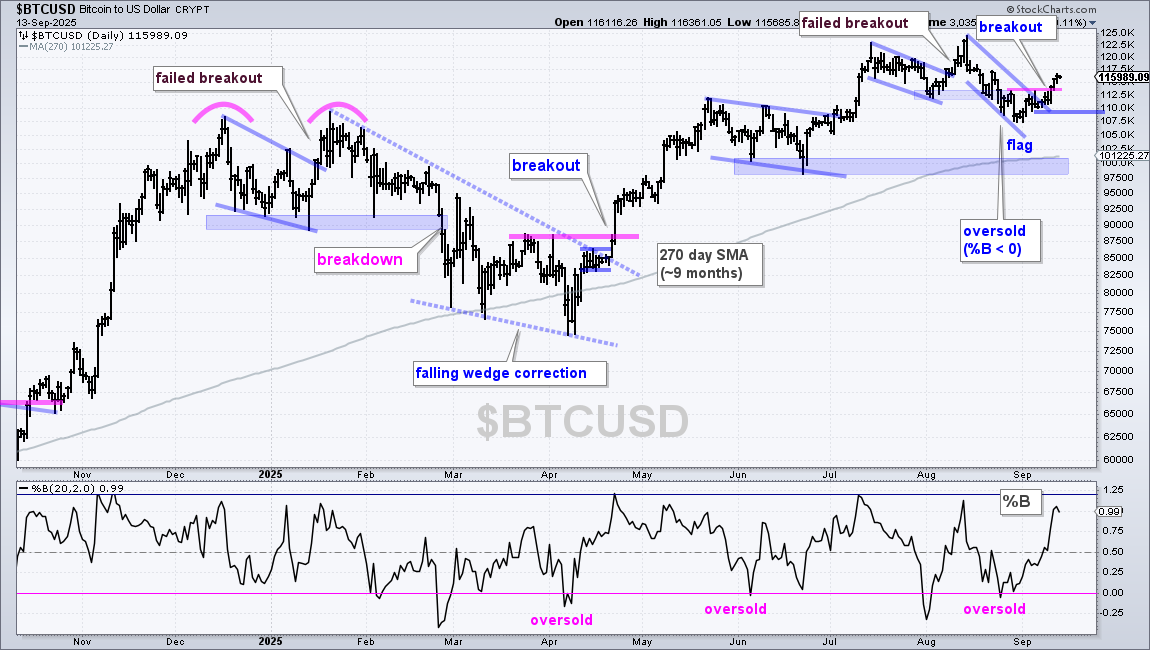
I featured Bitcoin on Tuesday because the chart was setting up. In short, the long-term trend was up, %B became oversold and a bullish pattern formed. Bitcoin is above its rising 270 day SMA. %B dipped below 0 to become oversold in late August. A falling flag formed into September with resistance set at 113,000. Bitcoin broke out on Wednesday and extended higher on Thursday-Friday. This breakout signals a continuation higher with new highs expected. I am marking the first re-evaluation level at 109,000.
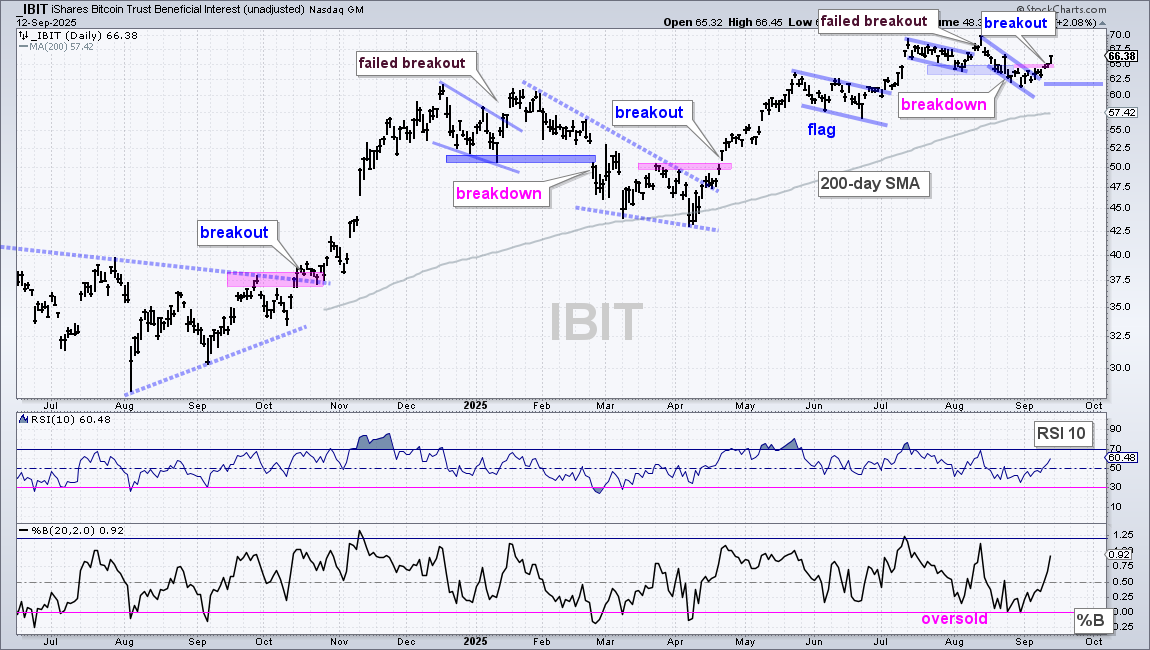
The next chart shows Bitcoin ETF (IBIT) with a breakout at 65 and a re-evaluation at 62.
DISCLAIMER: This content provided strictly for informational and educational purposes. It should not be interpreted as an offer to buy or sell any security, nor as a solicitation to engage in any investment activity. Nothing here constitutes a recommendation regarding any specific security, portfolio, transaction, or investment strategy.
At times, the author or affiliates may hold positions or interests in securities discussed. Any stocks or examples mentioned are not endorsements or suggestions to purchase. This material does not consider your individual financial goals or circumstances, and you should seek guidance from a qualified financial or investment adviser before making any trading or investment decisions.
Past performance does not guarantee future results.
Send feedback to support(at)trendinvestorpro.com or use the contact form. [3]