Seven Stocks – AMZN, BROS, DIS, DRS, ELF, EW and QCOM
Posted By
Arthur Hill, CMT
On
In
Archive |
No Comments
Headlines
Disney Recovers from Gap and Challenges Resistance
Dutch Brothers Breaks Out of Big Continuation Pattern
Elf Beauty Holds 200-day and Gap during Correction
Edward Lifesciences Works its Way Higher
Leondardo Firms Near Support and Key Retracements
Amazon Consolidates above Rising 200-day SMA
Qualcomm Recovers after Earnings and Challenges 200-day
The next report/video will be on Thursday morning (4 September)
This report features stocks with tradable setups or breakouts. Each chart features an analysis checklist covering the trend, relative performance, condition, pattern at work, re-evaluation level and special considerations. Uptrends and bullish continuation patterns are the maintain, but reversal candidates are also featured when appropriate.
Previous Reports with Stock Trend, Setups and Breakouts
On Tuesday, I published a report[4] covering the long-term trends for the major index ETFs, the breadth models and yield spreads. I also published a report[5] covering the possibility for a chaotic September. A correction at this point would be within the confines of a bull market.
Disney Recovers from Gap and Challenges Resistance
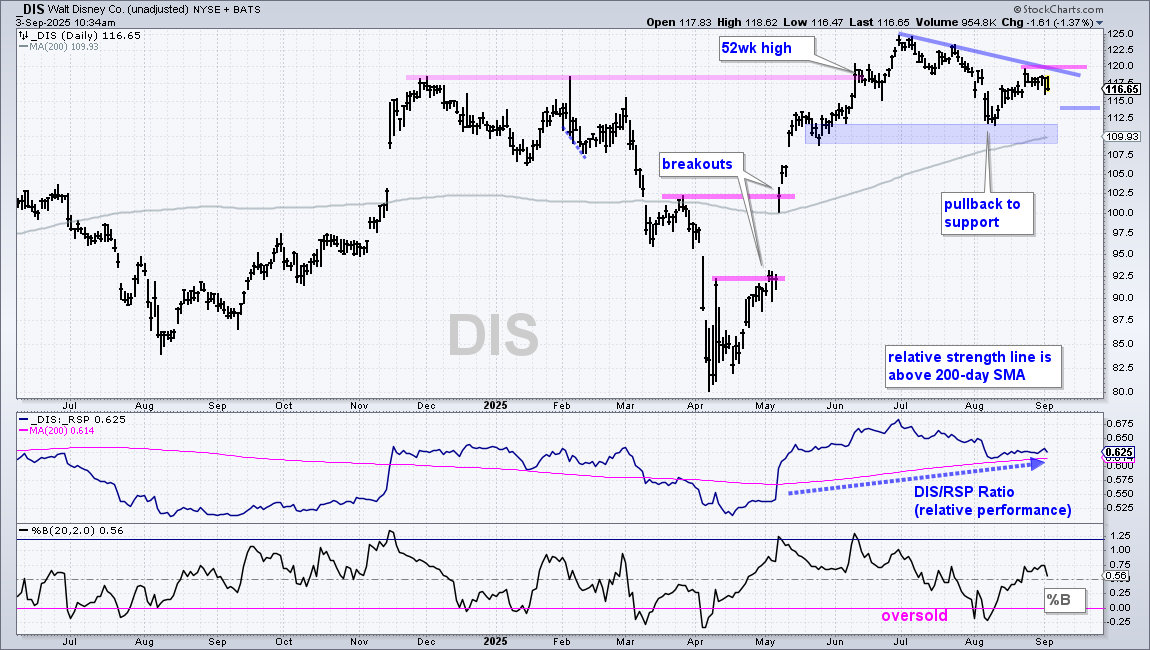
Disney (DIS) is a perennial disappointment with big swings in both directions, no progress since July 2022 because it is locked in a range (80 to 125). Is this the year it breaks free? DIS is in a long-term uptrend with breakouts in May and a new high in June. The stock also shows relative strength with the price-relative (middle window) breaking out in May and holding above its 200-day SMA. Short-term, the stock fell sharply on earnings in early August, but found support from the late May low and rising 200-day SMA (blue shading). I view the decline since July as a correction within the bigger uptrend. Resistance is set at 120, a break of which would signal a continuation of the April-June advance. I would then mark re-evaluation support at 114.
Dutch Brothers Breaks Out of Big Continuation Pattern
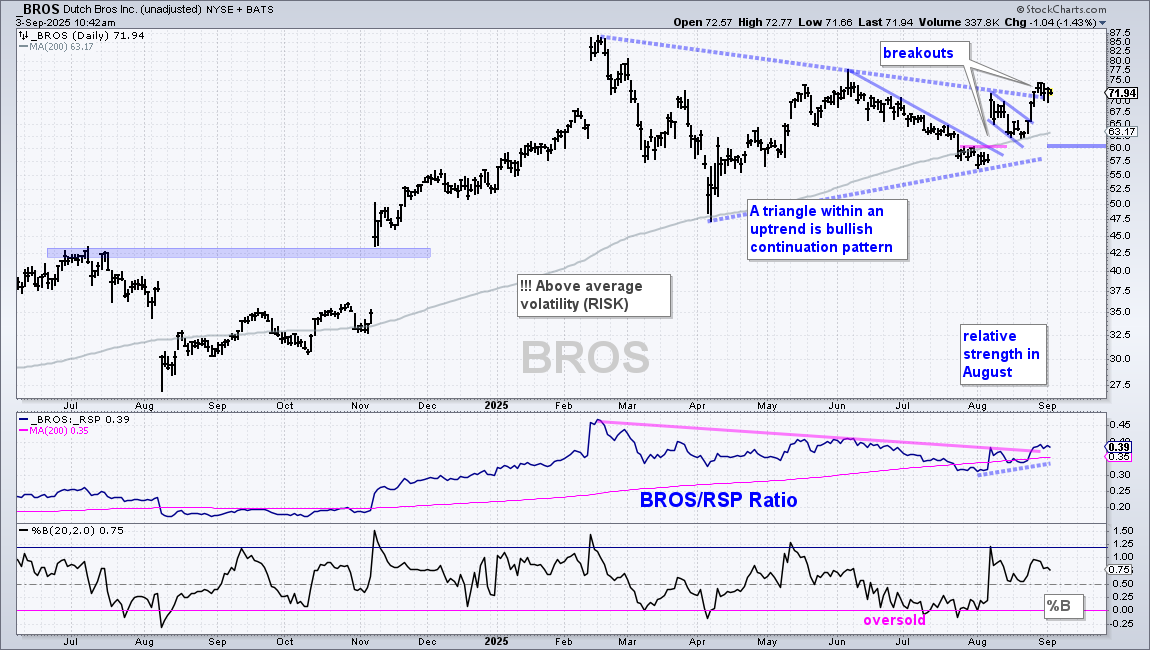
Dutch Brothers (BROS) is a highly caffeinated stock with above average volatility (risk). Overall, the stock is in a long-term uptrend with a new high in February and price above the rising 200-day SMA. Even though BROS went nowhere from March to August, I view this consolidation as a big bullish continuation pattern. It is a rest after the move from 27 to 87. As such, the breakout in late August signals a continuation of this uptrend. I would set the initial re-evaluation level at 60 and trail a stop should prices continue higher. The middle window shows the price-relative (BROS/RSP ratio) falling from February to July and then turning up in August. BROS is starting to outperform the market again.
Elf Beauty Holds 200-day and Gap during Correction
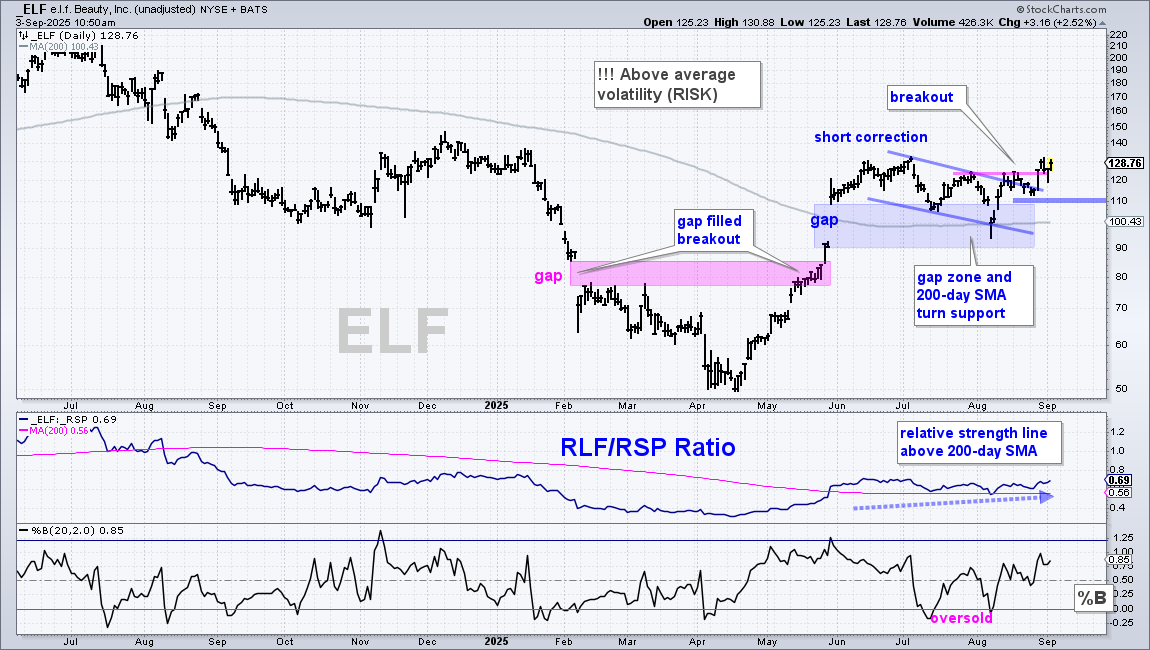
Elf Beauty (ELF) is in the same volatility category as Dutch Brothers (high risk). ELF fell from 220 to 50 and then surged to 130 – in less than a year. The stock is in a long-term uptrend with breakouts in May. Notice the gap and break above the 200-day SMA in late May. After more than doubling from mid April to mid June, the stock corrected with a move into the bullish setup zone (blue shading). Here we have support from the gap zone and the 200-day SMA. This is an area to watch for a reversal that would signal a continuation of the uptrend. A falling flag/channel formed from July to August and ELF broke out with a surge in late August. This signals a continuation higher and I am marking the initial re-evaluation level at 110.
Edwards Lifesciences Works its Way Higher
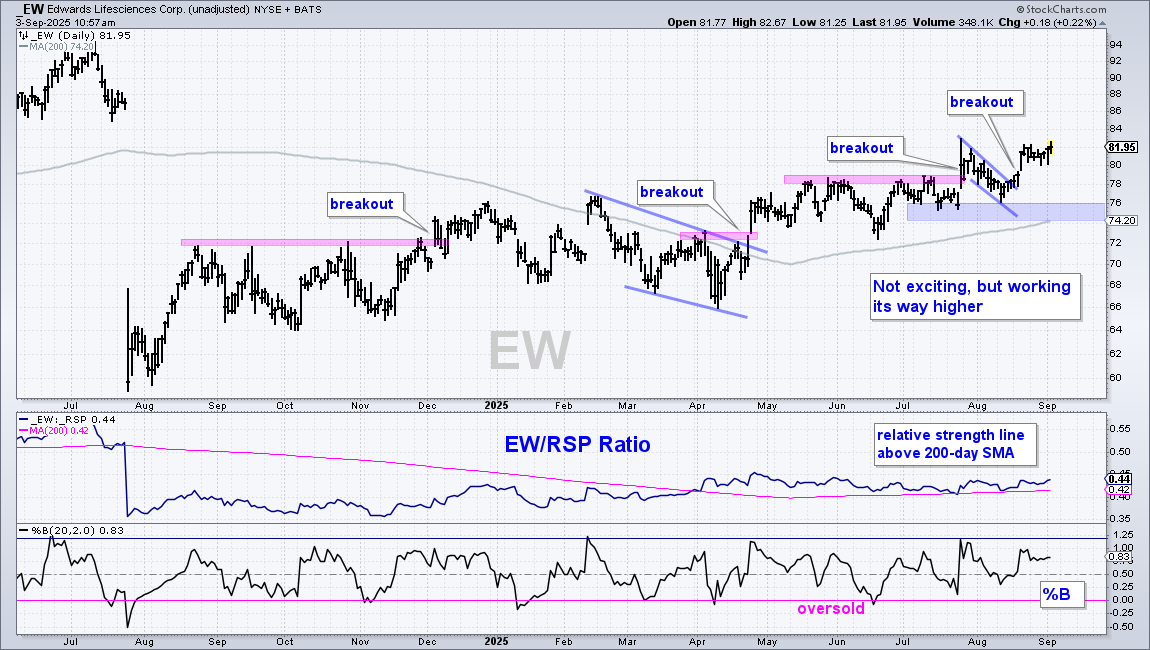
Edwards Lifesciences (EW) is in a boring uptrend with a series of higher highs and higher lows since August 2024. There are three breakouts along the way. EW is currently above its rising 200-day SMA. Most recently, EW fell back into mid August, held support in the 74-76 area and broke out in mid August. The July-August lows and rising 200-day SMA mark long-term support in the 74-76 area.
Leonardo Firms Near Support and Key Retracements
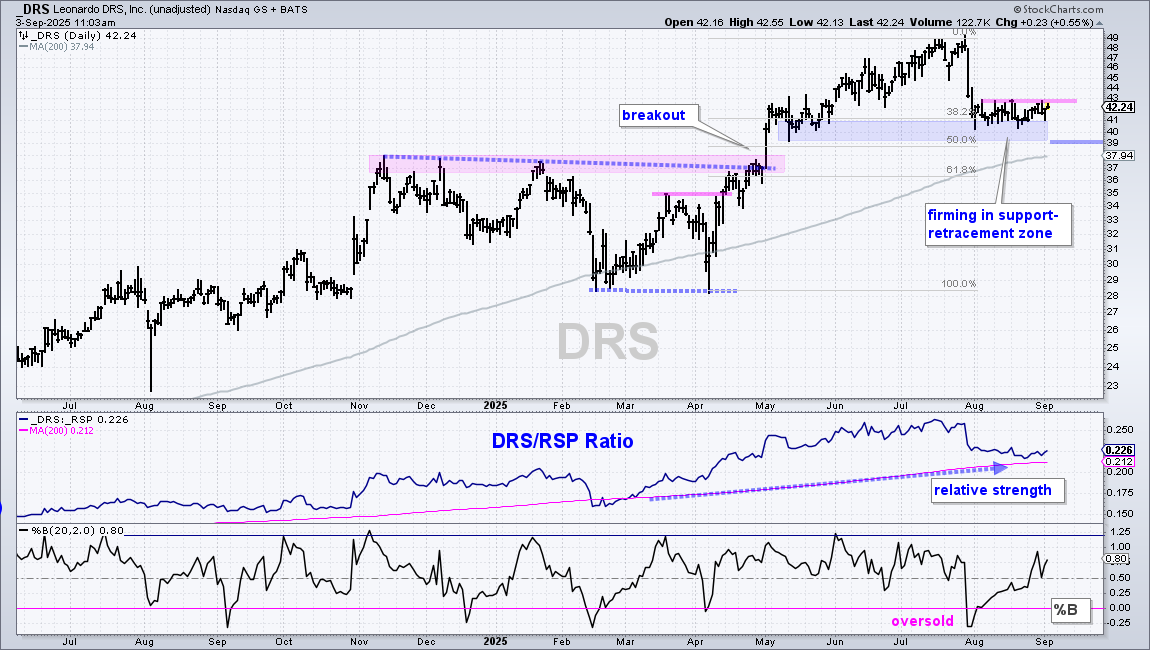
Leonardo DRS (DRS) is a drone maker that is part of the Aerospace & Defense industry. The stock is in a long-term uptrend with a big breakout in early May and new highs in June-July. The stock took a tumble in late July with a decline to the lows 40s, but held well above the rising 200-day SMA. Overall, DRS is firming in a bullish setup zone marked by support and retracements. The May lows mark support in the 39-41 area and this zone also marks a 38-50 percent retracement of the April-July advance. The advance was two steps forward and the decline was one step backward. I am watching for a short-term breakout at 43 to signal an increase in buying pressure. Should DRS break out, I would mark the initial re-evaluation level at 39.
Amazon Consolidates above Rising 200-day SMA
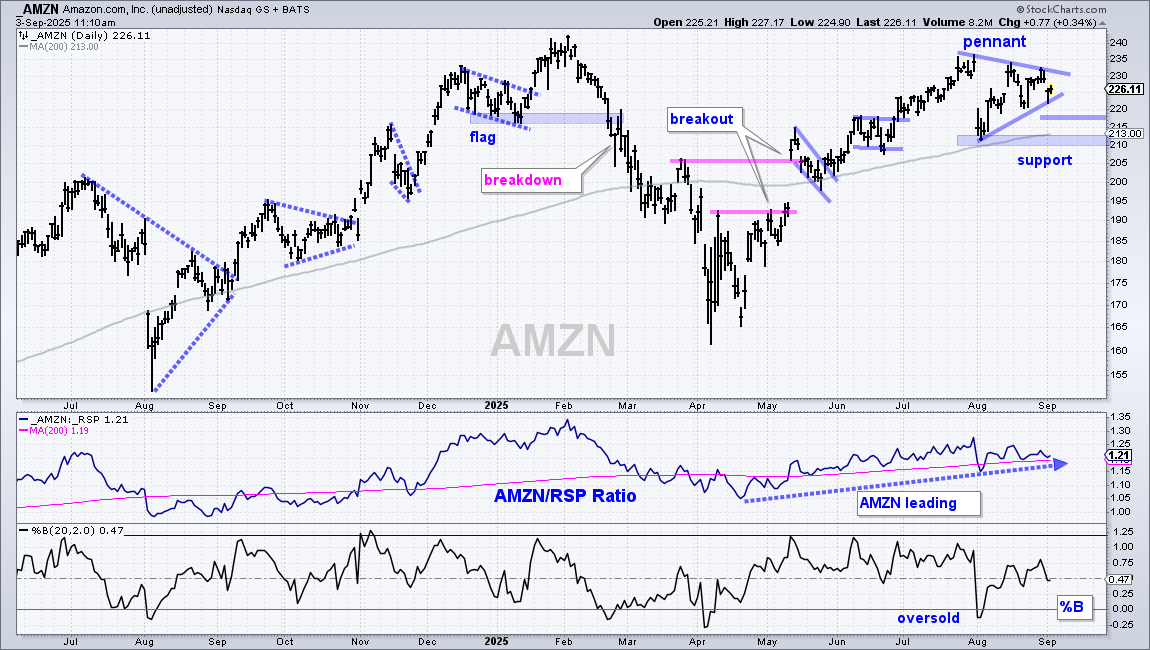
Amazan (AMZN) is in a long-term uptrend with breakouts in May and price above the rising 200-day SMA. The stock struggled the last six weeks with a gap down in early August and a trading range. Overall, a pennant/triangle formed and I view this as a bullish continuation pattern. At this point, however, AMZN needs to completely fill the early August gap and break out at 235 for a bullish signal. This would signal a continuation of the uptrend and I would then set re-evaluation support at 218.
Qualcomm Recovers and Challenges 200-day
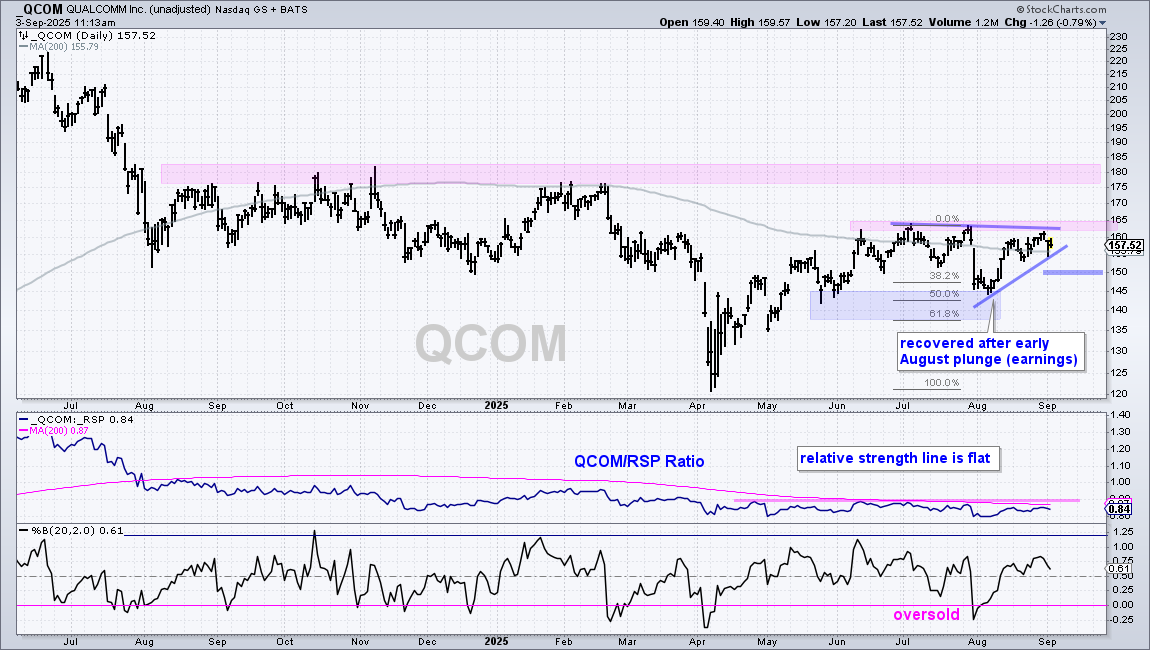
Qualcomm (QCOM) is struggling within the semiconductor group because it remains well below its February highs and the price-relative (QCOM/RSP ratio) has been flat since April. I am highlighting this stock because it is close to a trend-reversing breakout. QCOM advanced from April to June and then consolidated into early September. As with many stocks, it fell hard in late July (earnings). However, it managed to firm and move back towards resistance (160-165 area). This is the big hurdle. A breakout at 165 would be bullish and argue for further gains. I would also watch the price-relative for a confirming breakout (middle window).
DISCLAIMER: This content provided strictly for informational and educational purposes. It should not be interpreted as an offer to buy or sell any security, nor as a solicitation to engage in any investment activity. Nothing here constitutes a recommendation regarding any specific security, portfolio, transaction, or investment strategy.
At times, the author or affiliates may hold positions or interests in securities discussed. Any stocks or examples mentioned are not endorsements or suggestions to purchase. This material does not consider your individual financial goals or circumstances, and you should seek guidance from a qualified financial or investment adviser before making any trading or investment decisions.
Past performance does not guarantee future results.
Send feedback to support(at)trendinvestorpro.com or use the contact form. [6]