Ten Stocks – Leading Uptrends, Tradable Pullbacks, Consolidations and Breakouts
Posted By
Arthur Hill, CMT
On
In
Archive |
No Comments
Headlines
CTVA Breaks Out of Bull Flag
MELI Forms Bullish Wedge
CHWY Holds 200-day and Breaks Out
LNG Consolidates above the Rising 200-day SMA
BSX Continues to Work its Way Higher
AME Breaks Mid Summer Highs
TDY Consolidates above Breakout Zone
HON Falls back to Breakout and Reverses
AAPL Forms Pennant after Breakout Surge
CSCO Tests Breakout Zone as %B Tags Zero
The next report/video will be on Thursday morning (28-Aug)
Today’s report features ten stocks with uptrends and trading setups or recent breakouts. These charts cover 15 months of price action in the main window and two indicators. The price-relative (AAPL/RSP ratio) measures relative performance and %B identifies short-term oversold conditions. The main focus is on price action since the April low and the patterns forming over the last 1-2 months. Make sure you understand the risks and have a plan in place before considering these trades. Even the best setups can fail.
These tickers were featured in our report on August 13th[1]: CCK, NFLX, TTWO, UBER, ABBV, PANW, CTAS, TSLA, ASML
CTVA Breaks Out of Bull Flag
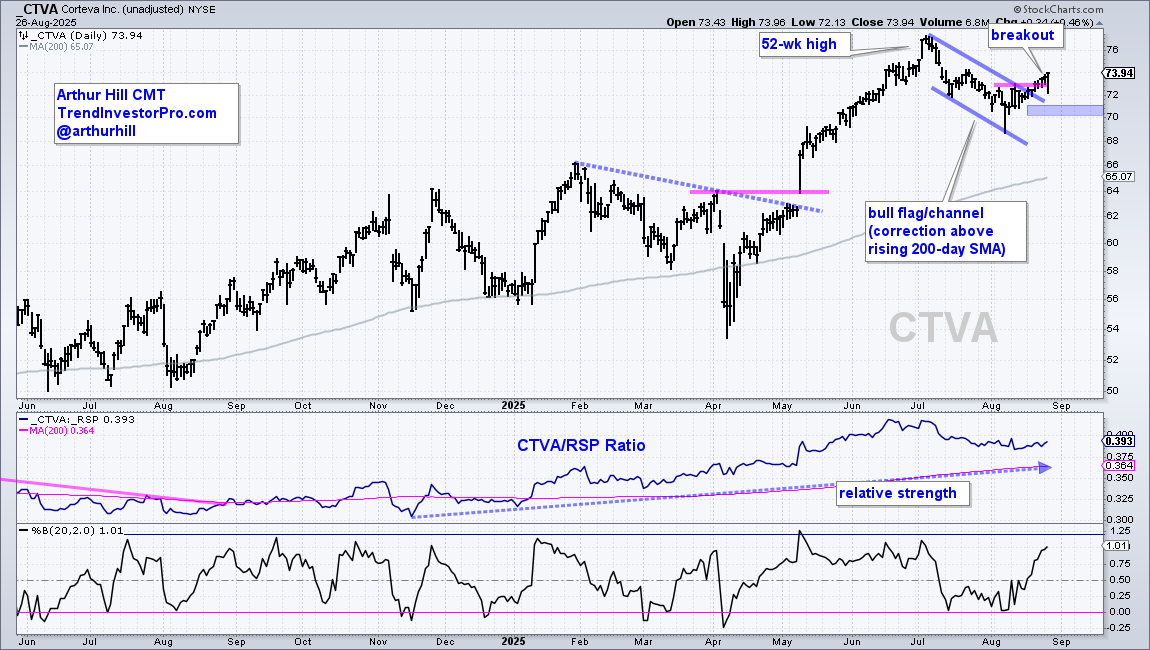
The chart below shows Corteva (CTVA), which is in the business of seeds and fertilizers. First and foremost, the stock is in a long-term uptrend with a new high in early July and price well above the rising 200-day SMA. CTVA corrected into early August with a falling flag/channel and broke out with a move above 73. The flag/channel is typical for a correction within a bigger uptrend. The breakout signals an end to this correction and a resumption of the uptrend. Initial re-evaluation support is set at 70.
For swing trades, I typically set a re-evaluation stop-loss, book partial profits when possible and trail a stop should prices continue to rise. CTVA is currently at 74 with an initial stop at 70 ($4 lower). Should prices rise, I would close half the position at 78 ($4 profit) and then trail the stop using a Chandelier Exit (65,5) or lower line of the Keltner Channel (65,2,65). These settings can be adjusted to suit your personal preferences.
MELI Forms Bullish Wedge
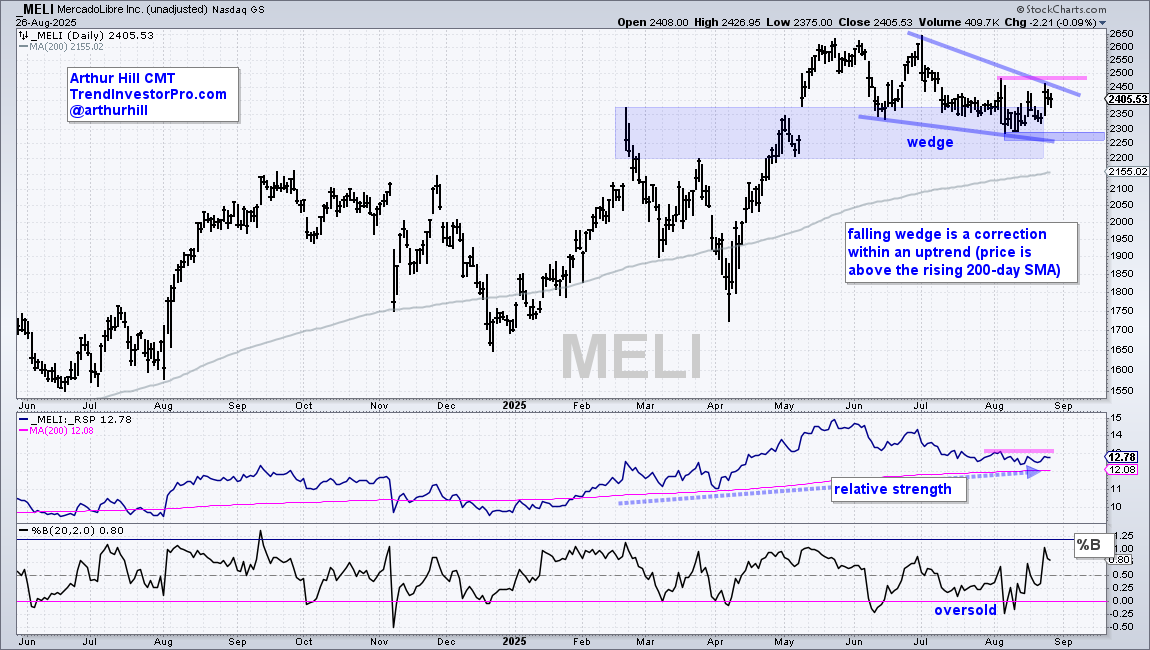
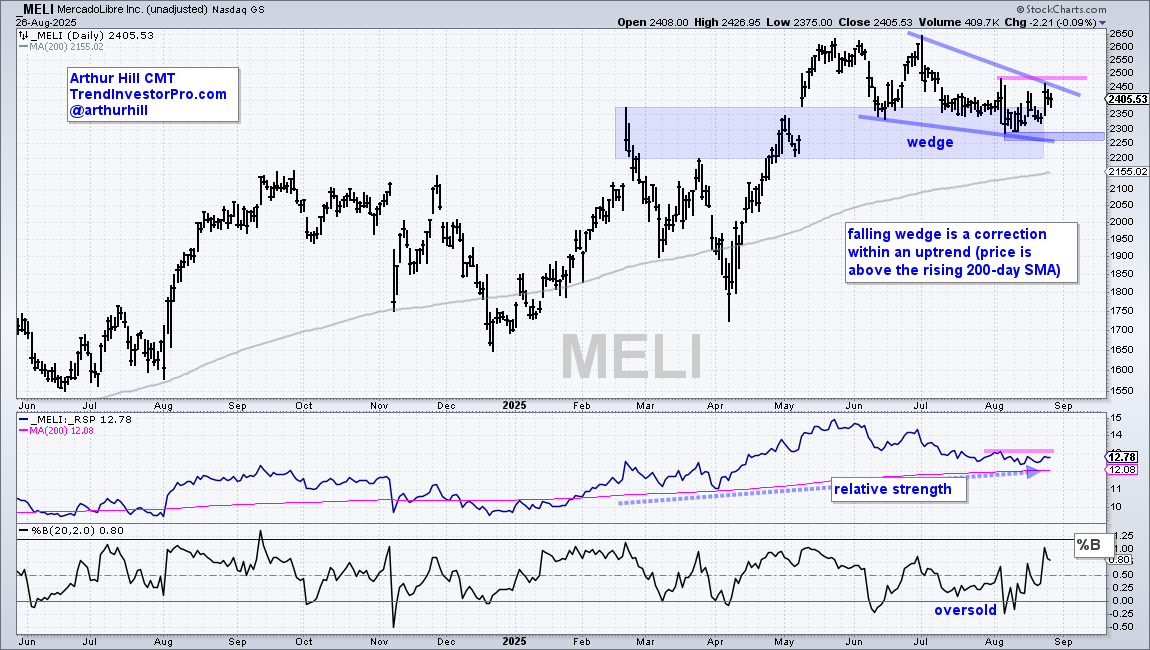
The next chart shows MercadoLibre (MELI), which provides ecommerce services in Latin America. MELI is in a long-term uptrend with a new high in May and price well above the rising 200–day SMA. The stock corrected over the last few months with a falling wedge that returned to the breakout zone. This breakout zone turns into a support area (blue shading). There have been signs of firming since mid July and %B became oversold in early August. A bullish setup is in the making. I view the wedge as a correction within a bigger uptrend. A breakout would signal a continuation higher and open the door to new highs. Initial re-evaluation support is set at 2250.
CHWY Holds 200-day and Breaks Out
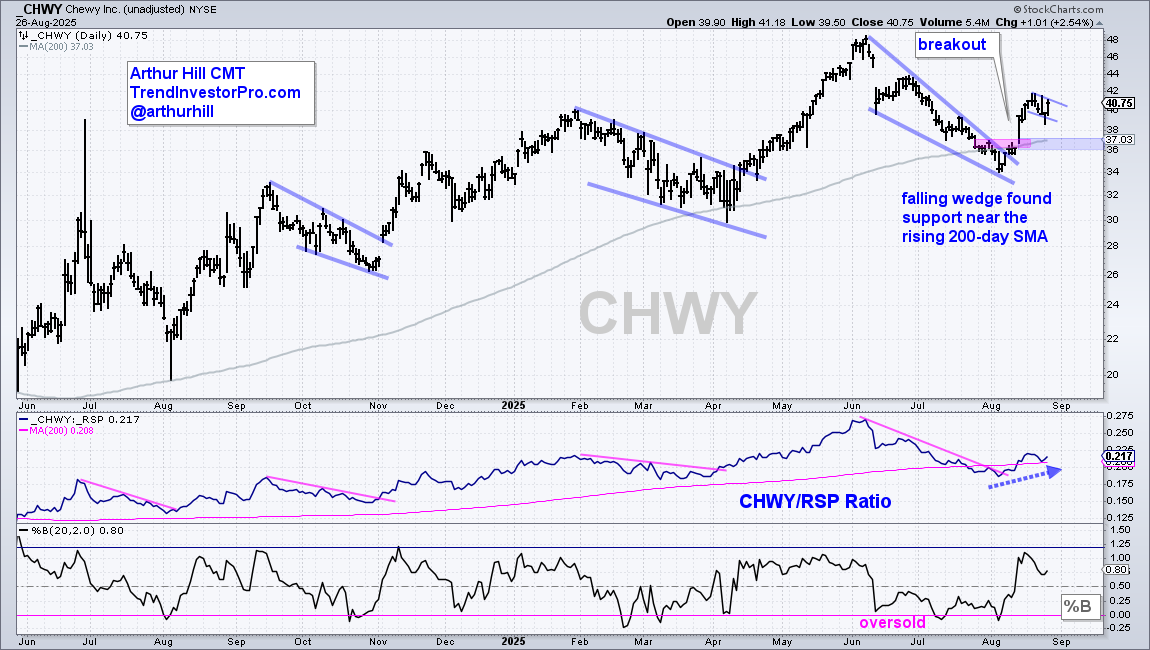
The next chart shows Chewy (CHWY), which is a retailer for animal products and services. CHWY fell rather sharply from early June to early August, but ultimately held the rising 200-day SMA with a surge in mid August. Overall, the long-term trend is up with price back above the rising 200-day SMA. I view the falling wedge as a correction within this uptrend. The breakout was strong with a 9% surge on August 13th. It is important that this surge holds so I am marking re-evaluation support at 36. Short-term, a small flag formed the last 5 days and a breakout at 42 would be bullish.
LNG Consolidates above the Rising 200-day SMA
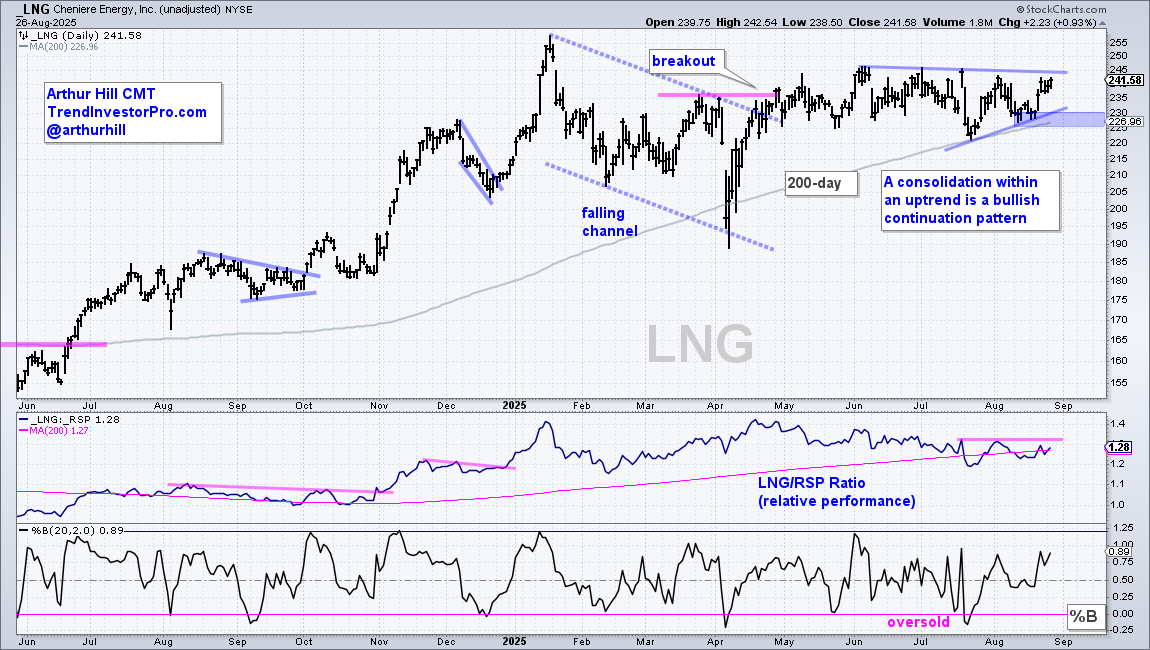
As its ticker suggests, Cheniere Energy (LNG) provides services and products related to liquified natural gas. LNG has been flat since January, but I view this long stall as a consolidation within an uptrend. LNG is still above its rising 200-day SMA and within 5% of its closing high. After a breakout and higher high in late April, the stock consolidated with a tight range the last four months. A triangle formed into August with resistance at 245. A breakout here would forge a multi-month high and open the door to new highs. Initial re-evaluation support is set at 225.
BSX Continues to Work its Way Higher
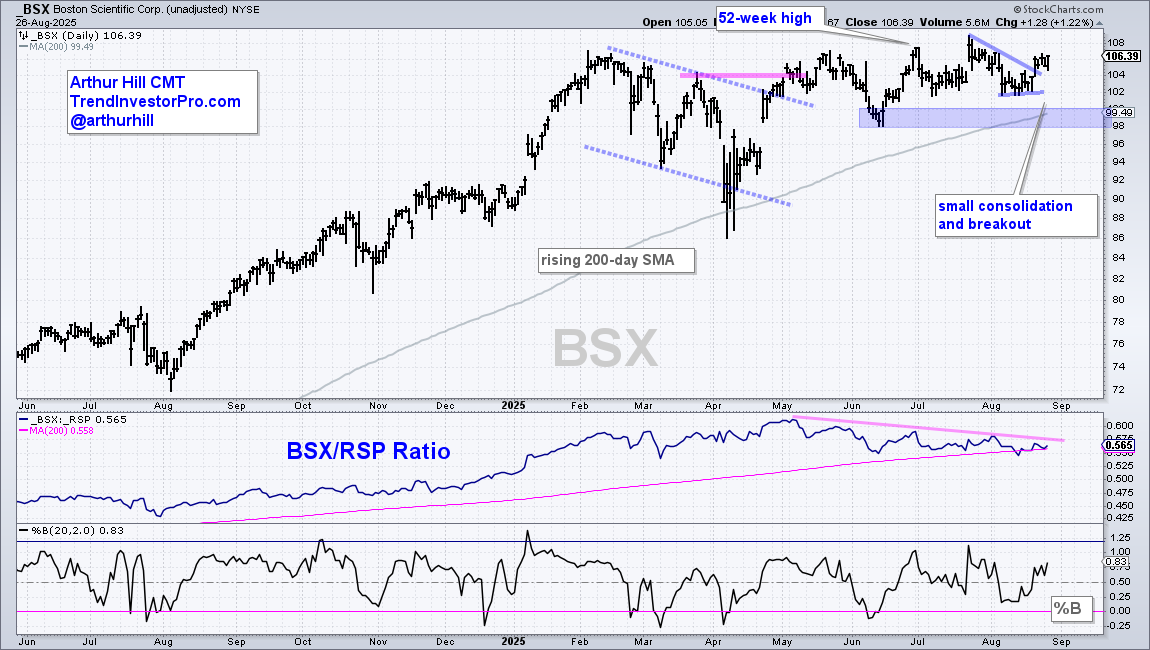
Boston Scientific (BSX) is the third largest holding (11%) in the Medical Devices ETF (IHI). BSX is in an uptrend with a breakout in early May, new highs in July and price above the rising 200-day SMA. Price action since the May breakout has been choppy, but up as the stock continues to work its way higher. Most recently, a small consolidation formed into mid August and the stock broke out with a pop last week. This is bullish and keeps the uptrend alive. Re-evaluation support is set at 98. The middle window shows the price-relative (BSX/RSP ratio) hitting a new high in May and falling into August as the stock market turned risk-on. A break above the pink trendline would show relative strength.
AME Breaks Mid Summer Highs
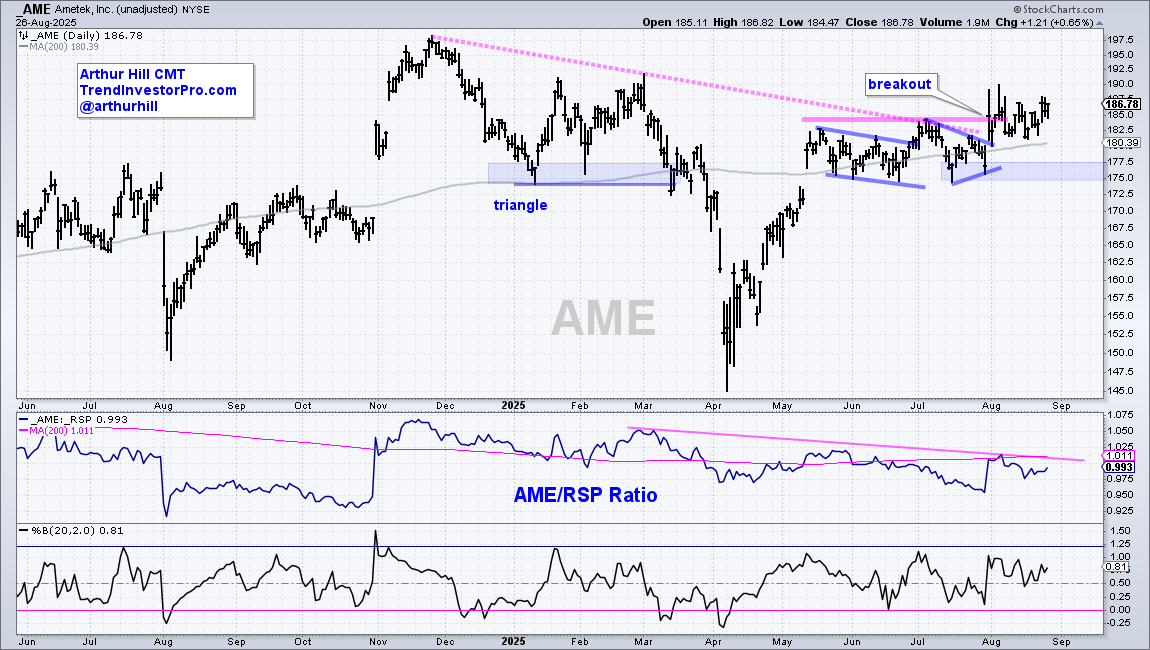
The next chart shows Ametek (AME), an electrical instruments manufacturer that is part of the Industrials SPDR (XLI). AME is in a long-term uptrend since the breakout in early August, which means this is a relatively new uptrend. AME surged with the market in April and then consolidated with a trading range into July. The early August surge broke the July high, November trendline and the rising 200-day SMA. Overall, I see more uptrend than downtrend on this chart. Assuming a trend in motion stays in motion, AME is heading for a test of its November high. Re-evaluation support is set at 175.
TDY Consolidates above Breakout Zone
The next chart shows Teledyne Technologies (TDY), which is part of the Aerospace & Defense ETF (ITA). TDY surged from 420 in early April to 570 in late July and recorded new highs throughout July. Price is also well above the rising 200-day SMA. Short-term, the stock surged from 480 to 565 and then formed a pennant, which is a short-term bullish continuation pattern. Also notice that %B became oversold in mid August as the pennant formed. A breakout at 555 would signal a continuation higher and open the door to new highs. Overall, it is bullish to see a stock consolidate above resistance (blue shading). A close below this zone would call for a re-evaluation.
HON Falls back to Breakout and Reverses
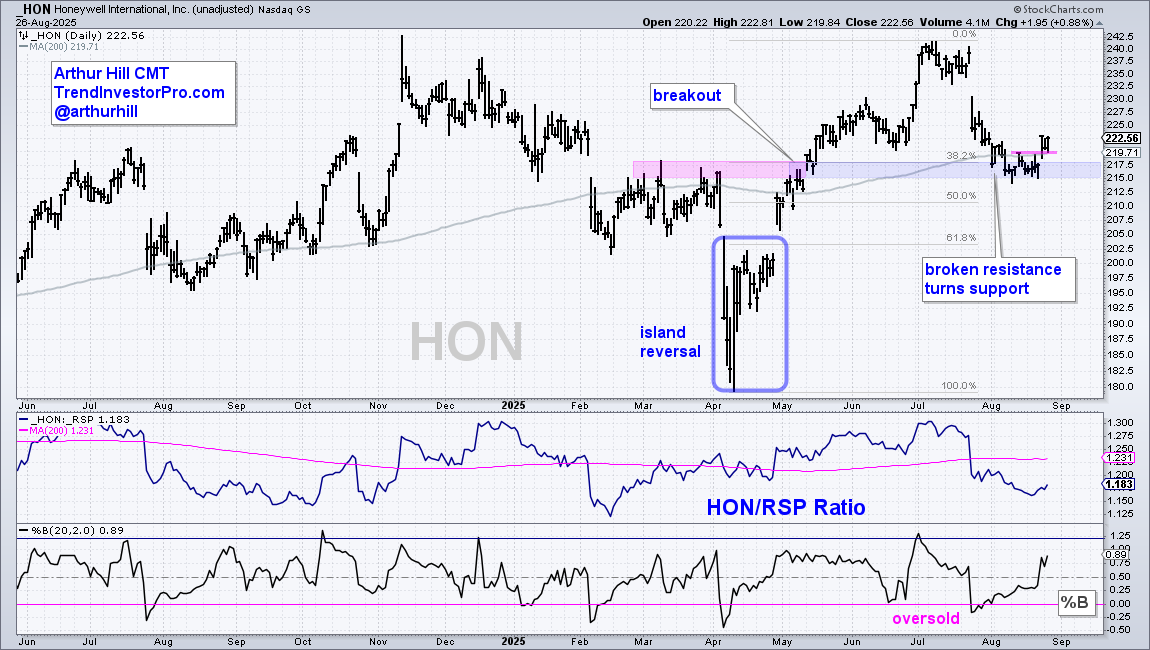
The next chart shows Honeywell (HON), which is the seventh largest holding (3%) in the Industrials SPDR (XLI). HON was doing fine into March, but plunged with the market in early April. The stock then gapped up in late April to form an island reversal. HON continued higher for a resistance breakout in early May and a new closing high in July. The stock then fell sharply with an earnings-related move in late July and firmed near the May breakout (blue shading). The 200-day SMA is in this area and the decline marks a 38-50 percent retracement of the April-July advance. Thus, this decline looks like a correction after a big advance and the 215 area is a bullish setup zone. This week’s short-term breakout is bullish with re-evaluation support set at 214.
AAPL Forms Pennant after Breakout Surge
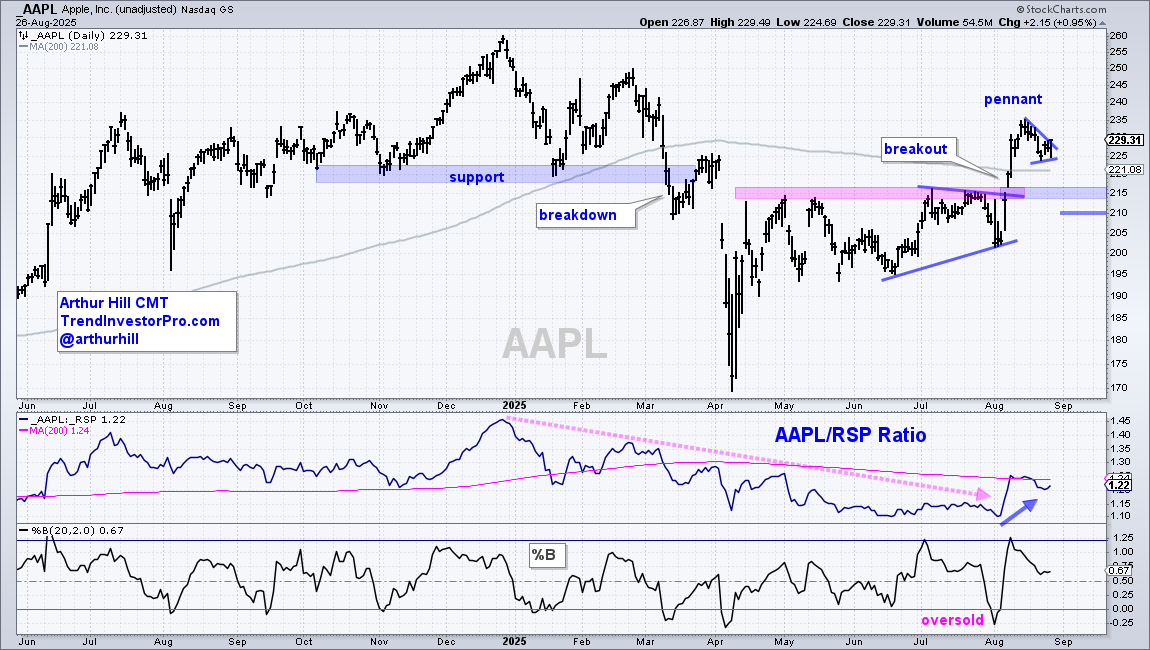
I featured Apple (AAPL) two weeks ago as it broke out with an outsized move in early August. This surge broke the May-July resistance zone and exceeded the 200-day SMA. Notice that this move started from oversold conditions (%B<0) and the price-relative surged to its 200-day SMA in early August. Things are looking up for APPL. Short-term, I am seeing a surge and pennant, which is a short-term bullish continuation pattern. AAPL moved above the pennant line on Tuesday and this is the first sign of a breakout. This pennant is very short-term and prone to whipsaw with normal volatility. Long-term, it is important that the breakout surge holds. I am marking re-evaluation support at 210.
CSCO Tests Breakout Zone as %B Tags Zero
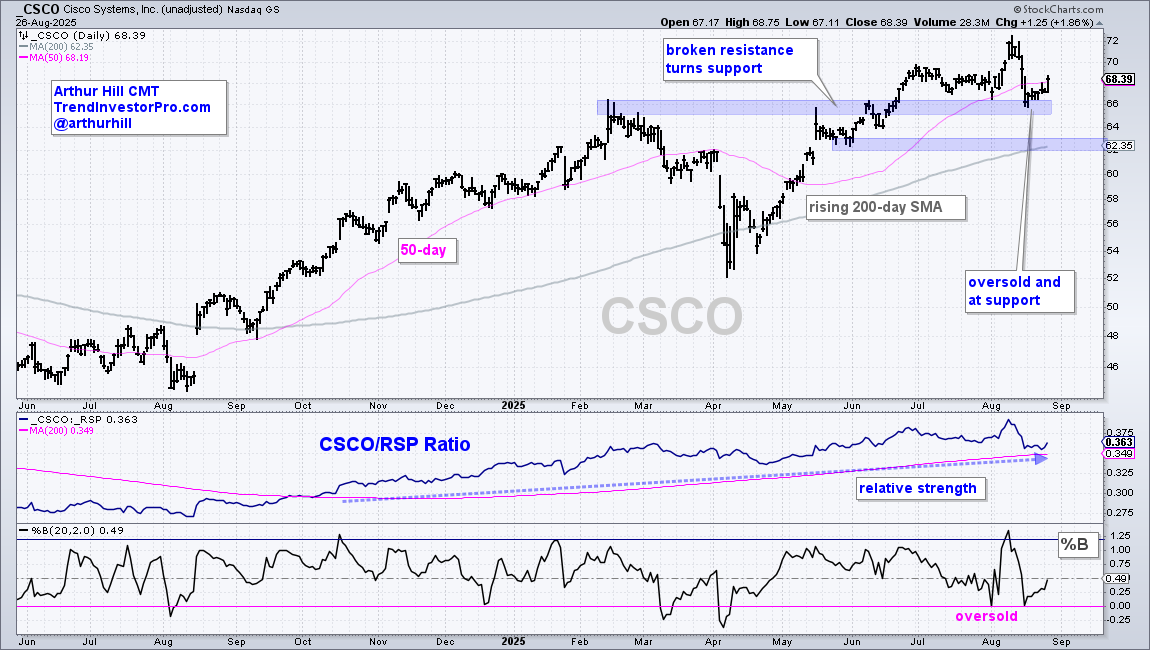
The next chart shows Cisco (CSCO) with a leading uptrend as the stock hit new highs in June, July and August. The middle window shows the price-relative (CSCO/RSP ratio) above its 200-day SMA since October (relative strength). After hitting a new high in mid August, the stock fell sharply with a move back to broken resistance, which turns into support (blue shading). The bottom window shows %B hitting the zero line to become oversold twice in August. CSCO firmed for a week and then turned back up on Tuesday with a move back above the 50-day SMA. I view this upturn as bullish and inline with the leading uptrend. Long-term support is set at 62.
DISCLAIMER: This content provided strictly for informational and educational purposes. It should not be interpreted as an offer to buy or sell any security, nor as a solicitation to engage in any investment activity. Nothing here constitutes a recommendation regarding any specific security, portfolio, transaction, or investment strategy.
At times, the author or affiliates may hold positions or interests in securities discussed. Any stocks or examples mentioned are not endorsements or suggestions to purchase. This material does not consider your individual financial goals or circumstances, and you should seek guidance from a qualified financial or investment adviser before making any trading or investment decisions.
Past performance does not guarantee future results.
Send feedback to support(at)trendinvestorpro.com or use the contact form. [2]