Alt ETF Report – Metal Mania – Silver, Platinum, Palladium and Copper Hit New Highs
Posted By
Arthur Hill, CMT
On
In
Archive |
No Comments
The next report will be on Tuesday, July 29th
Report Headlines
Alternative ETFs Feature on the Leaderboard
Metal Mania Hits the Markets
Gold Consolidates as Silver Surges to New High
Gold and Silver Miners Tag New Highs
Platinum and Palladium Surge to New Highs
Copper Surges to New Highs (DBB Follows)
Lithium Battery Tech ETF Surges after Breakout
Bitcoin ETF Tags a New High
IEF Battles Breakout Zone
Commodity and Crypto Related ETFs Leading
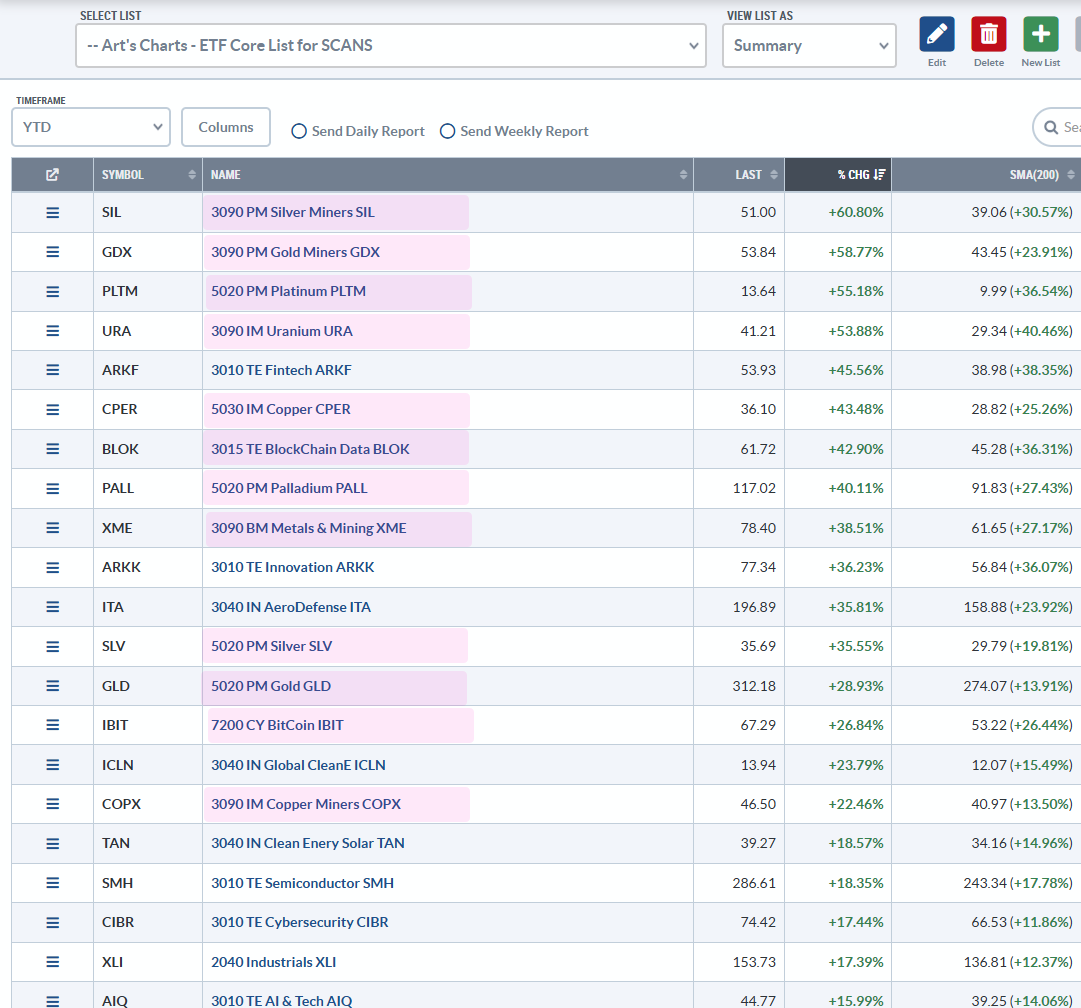
ETFs related to tech and industrials are leading the equity side of the market, but there are still plenty of alternative ETFs leading. Alternative ETFs are those related to bonds, commodities and crypto (non equity). Even though the Gold Miners, Silver Miners and Metals & Mining ETFs are based on common stocks, the underlying companies are involved with commodities and benefiting from the bull market in metals. The image below shows the top 20 year-to-date gains in my core ETF ChartList. 12 are related to commodities or crypto (pink shading). Even though stocks are up sharply since April, commodities and crypto are performing well, if not better.
Metal Mania
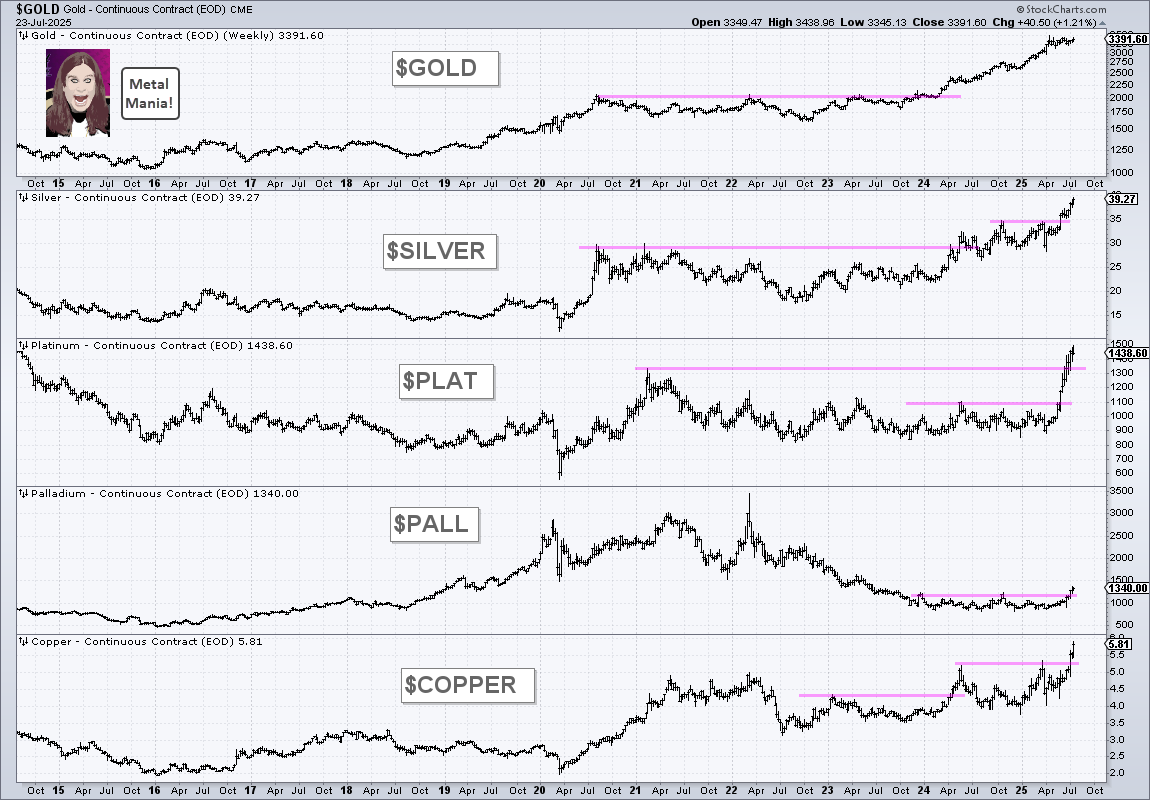
The markets are also in the midst of a metal mania (perhaps as a tribute to Ozzy!). Gold is still stalling, but we are seeing multi-year highs in silver, platinum, palladium and copper. The chart below shows the continuous futures contracts for five metals. At the pink lines show, all have major breakouts working. We will dive into these charts later in this report.
Gold Consolidates as Silver Surges to New High
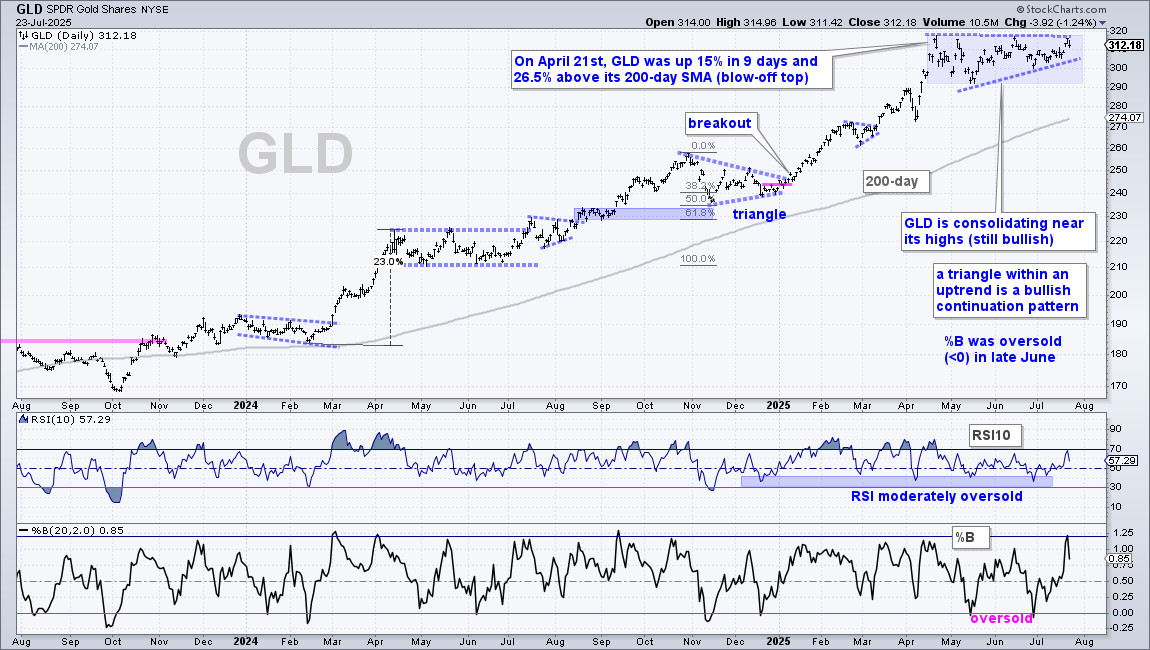
The Gold SPDR (GLD) remains in a leading uptrend and a leader in 2025 with a 29% year-to-date gain. After becoming overbought on April 21st, the ETF moved into a consolidation phase with a triangle taking shape since late April. Consolidations work off overbought conditions and pave the way for further gains. As such, this is a bullish continuation pattern and a breakout at 320 would signal a continuation higher. Note that GLD became oversold during this triangle as %B dipped below zero twice (mid May and late June). Oversold conditions present opportunities to partake in uptrends.
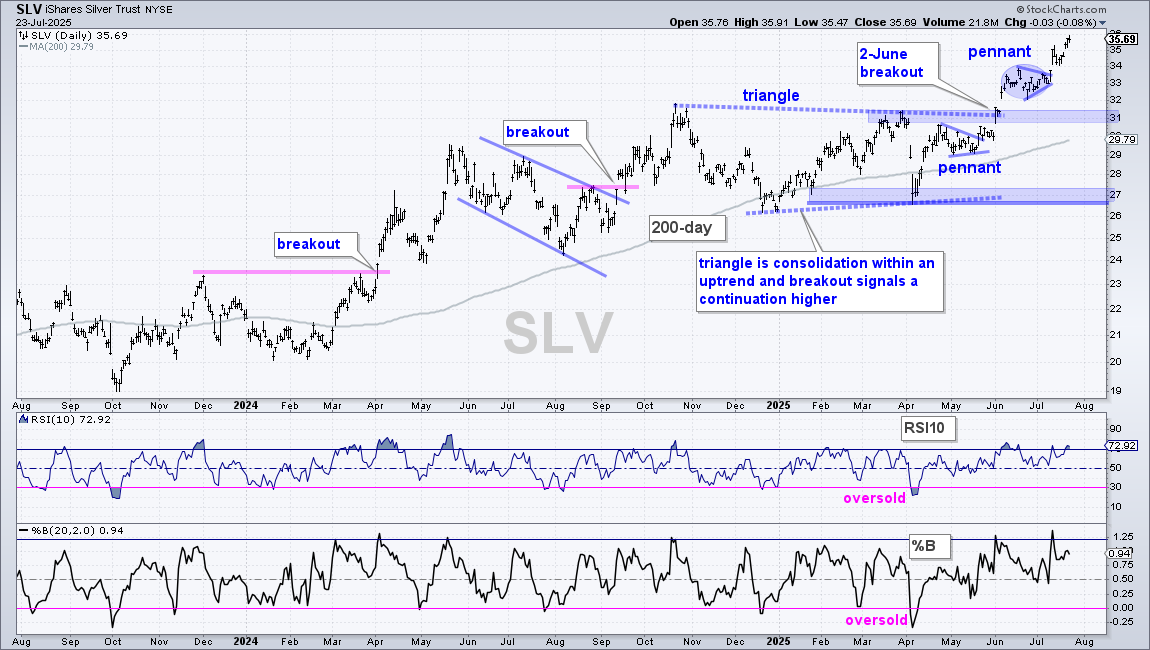
Silver is stronger than gold as the Silver ETF (SLV) broke out of a small consolidation on July 10th and surged to new highs. I marked this consolidation with a blue oval in early July. A small pennant evolved as the range contracted and these are short-term continuation patterns. With the breakout and surge to new highs, I do not see a trading setup right now. Long-term, SLV broke out of a large triangle on June 2nd. Broken resistance turns first support in the 31 area, but I am not sure if we will see a test of this breakout. SLV is also well above the rising 200-day SMA (long-term uptrend).
Gold and Silver Miners Tag New Highs
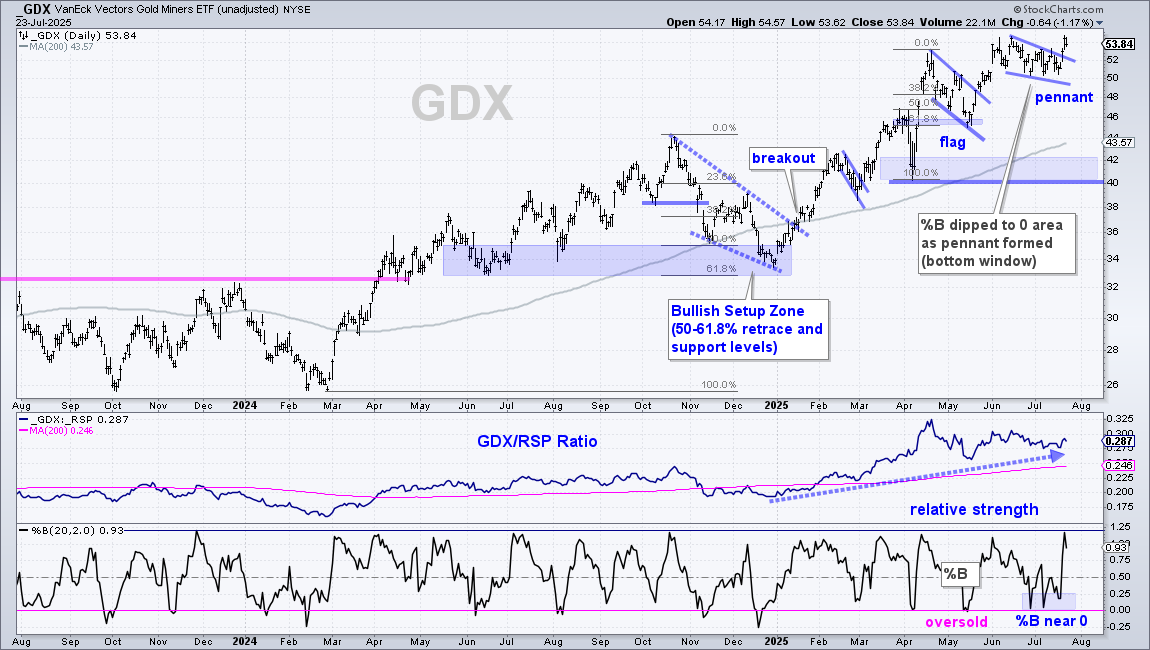
The Gold Miners ETF (GDX) is also in a leading uptrend with a new high this week and price well above the rising 200-day SMA. GDX is up 58.7% year-to-date, which earns second place in our core ETF list. The Silver Miners ETF (SIL) is the leader with a 60.8% year-to-date gain. Short-term, GDX surged to a new high in June, corrected with a pennant into July and broke the pennant line with a surge this week. This breakout signals a continuation of the long-term uptrend. Notice that %B dipped to the zero area as the pennant formed. This means the close was near the lower Bollinger Band (20,2) and GDX was moderately oversold (short-term).
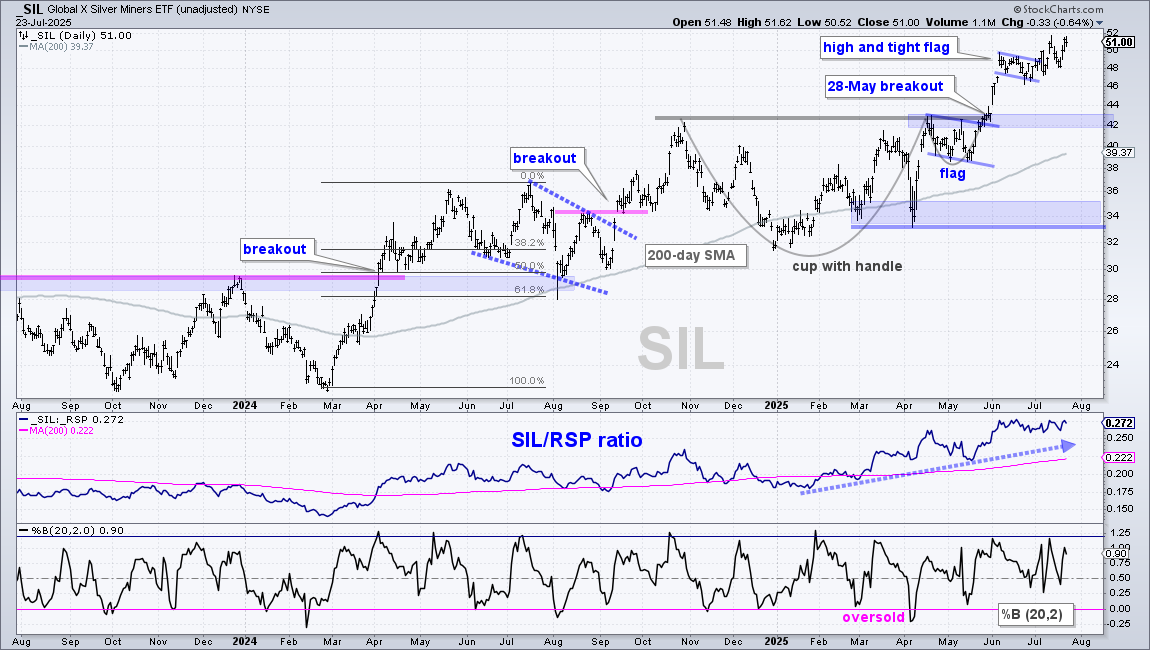
The Silver Miners ETF (SIL) broke cup-with-handle resistance with a breakout on May 28th and surged to new highs in early June. A high and tight flag formed in June and SIL broke the flag line on July 2nd. Price worked its way high the last two weeks with SIL hitting a new high. The breakout zone in the 42 area turns into support, but strong follow through on the breakout decreases the chances for a test of the breakout zone.
Platinum and Palladium Surge to New Highs
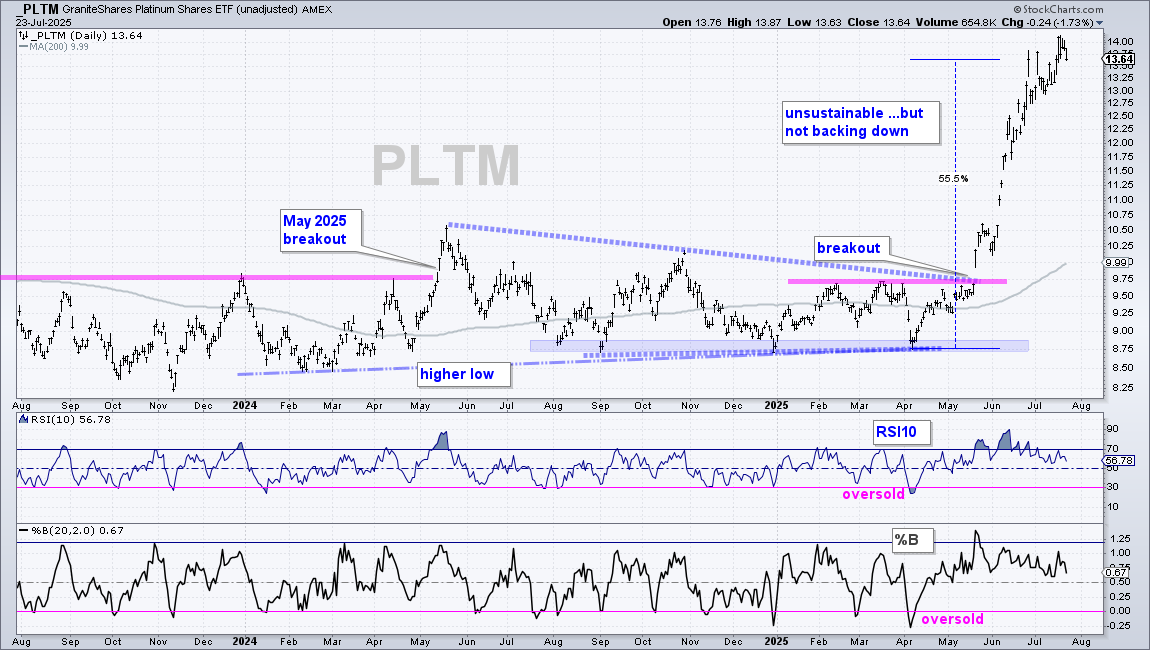
The Platinum ETF (PLTM) caught fire in the second half of May with a breakout in the 9.75 area. This fire raged into June-July with the ETF surging into the 14 area. This advance looks unsustainable because it is straight up. However, the breakout and new high are long-term bullish. At this point, PLTM remains on my radar for tradable pullbacks and short-term oversold conditions because it is a leader. For some perspective, note that Platinum Continuous Futures ($PLAT) hit a 10 year high with the recent move to $1500 and traded in the $1800 area in 2011.
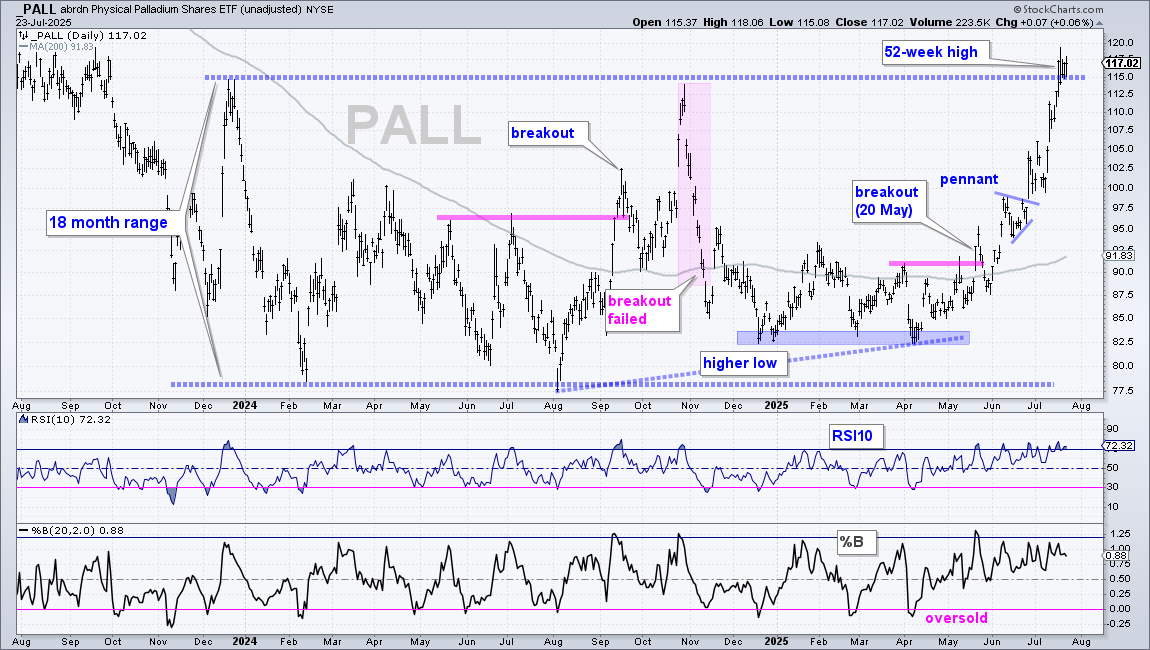
The Palladium ETF (PALL) is also in the midst of a big breakout and short-term overbought. PALL broke out with a surge above on May 20th, formed a pennant into June and then surged to a 52-week high in July. The move from early June to late July (87.5 to 117) was pretty much straight up. PALL is long-term bullish with the breakouts and 52-week highs, but short-term overbought and parabolic right now. I do not see a tradable setup on this chart. As the PLTM, PALL remains on my radar for tradable pullbacks and short-term oversold conditions. Note that Palladium Continuous Futures ($PALL) based near $800 in 2024-2025 and broke out of an 18 month range with the move above $1250. Palladium hit the $3000 area in 2021 and 2022.
Copper Surges to New Highs (DBB Follows)
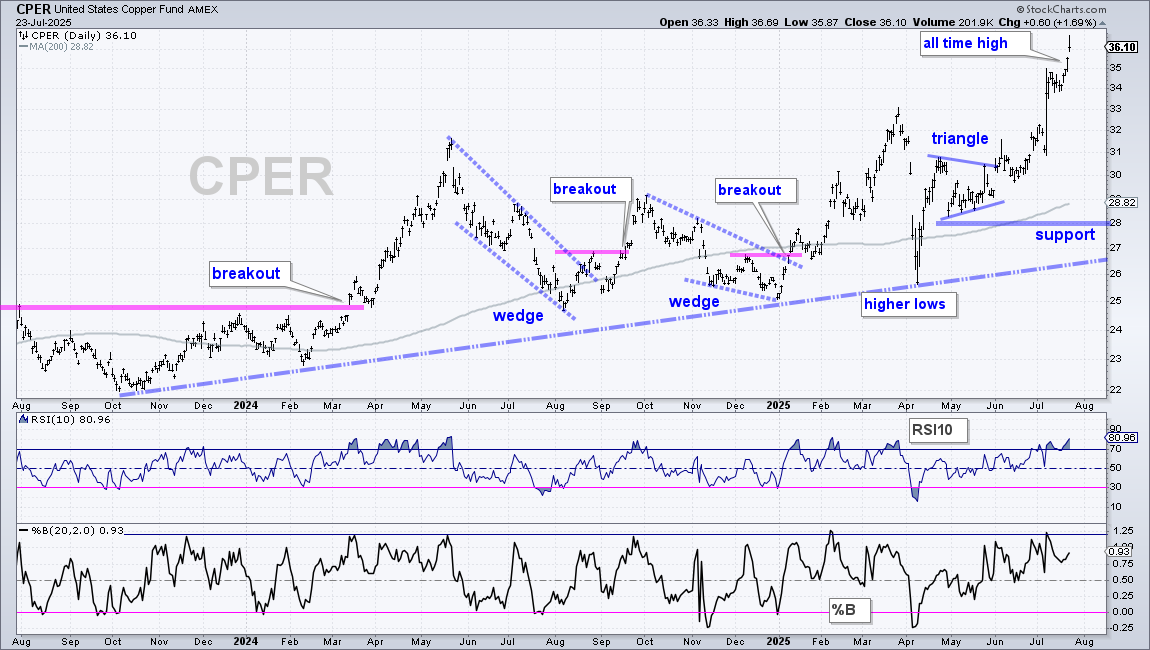
The Copper ETF (CPER) is also partaking in metal mania. First, the long-term trend is up with a series of higher lows extending back to early 2024. There are also higher highs in May 2024 and March 2025. After a volatile April, CPER formed a triangle into late May and broke out in early June. This triangle was noted in late May[1] and early June[2]. CPER surged to new highs in July with a 20% gain since mid June (30 to 36). As with Palladium, Platinum and Silver, Copper is long-term bullish with a major breakout, but short-term overbought and I do not see a setup on the price chart.
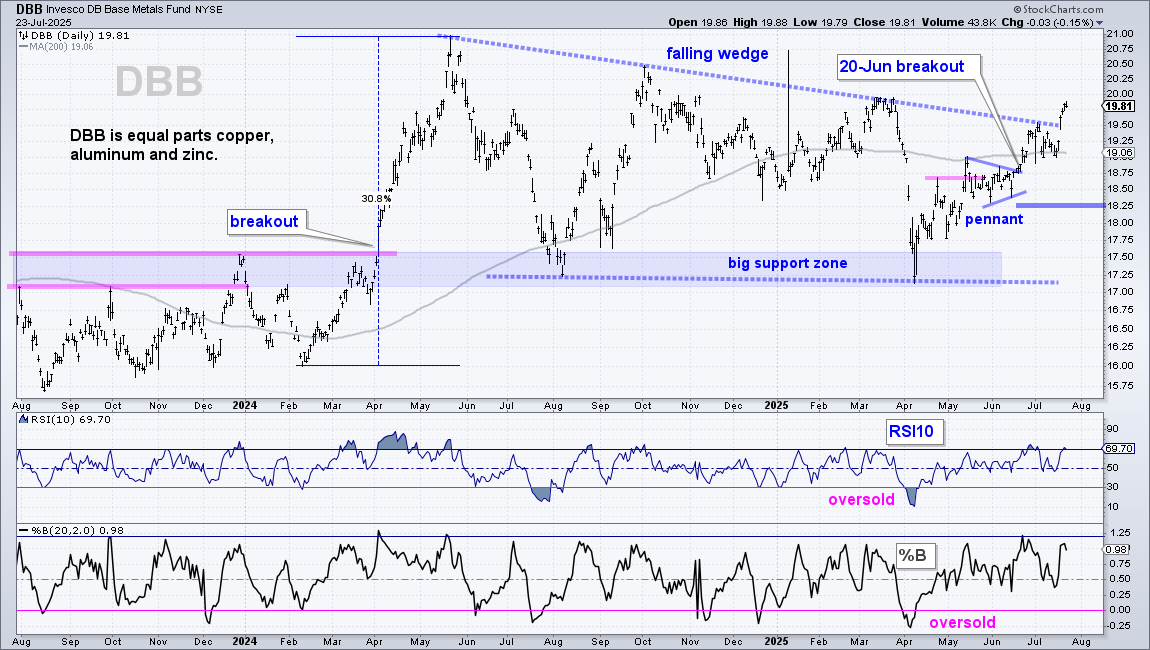
DB Base Metals ETF (DBB) is equal parts copper, aluminum and zinc. DBB caught my attention in mid June after it broke the mid April high and formed a pennant. The ETF broke the pennant line on June 20th and followed through with further gains into July. DBB broke the trendline extending down from the May 2024 high. This trendline is part of a large falling wedge and a bigger breakout is in the making. This wedge looks like a massive correction after the surge from February to May 2024 (+30.8%). The wedge breakout signals an end to this corrective period. I will mark re-evaluation support at 18.25 for now.
LIT Surges, Consolidates and Breaks Out
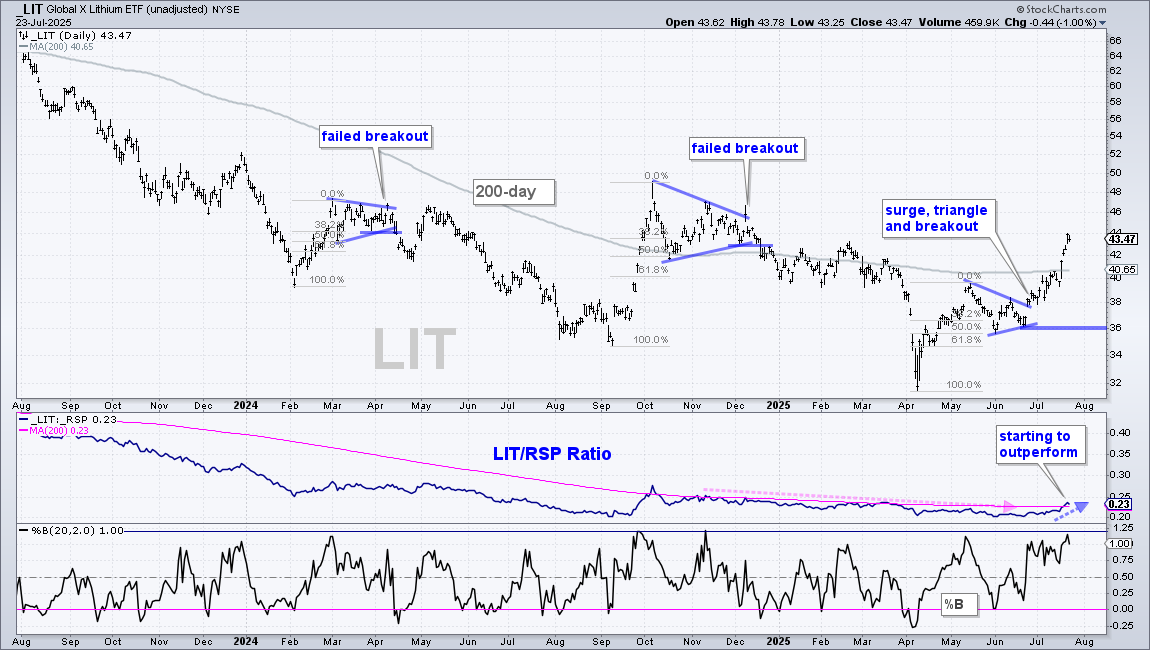
The Lithium Battery Tech ETF (LIT) is making another bid to reverse its long-term downtrend as it surges above the 200-day SMA. Note that LIT made a similar bid in September-October and ultimately failed. Short-term, I pointed out the April-May surge and triangle into June, as well as the breakout in late June. LIT extended on this breakout with a move from 38 to 44. There was a gap-surge in the 36-38 area so I am marking re-evaluation support at 36. LIT is now up 20% since late June and up 12% since the breakout. It is short-term overbought and, perhaps, ripe for a rest. This is the place where I would look to take some money off the table by closing part of the position (1/3 to 1/2).
Bitcoin ETF Tags a New High
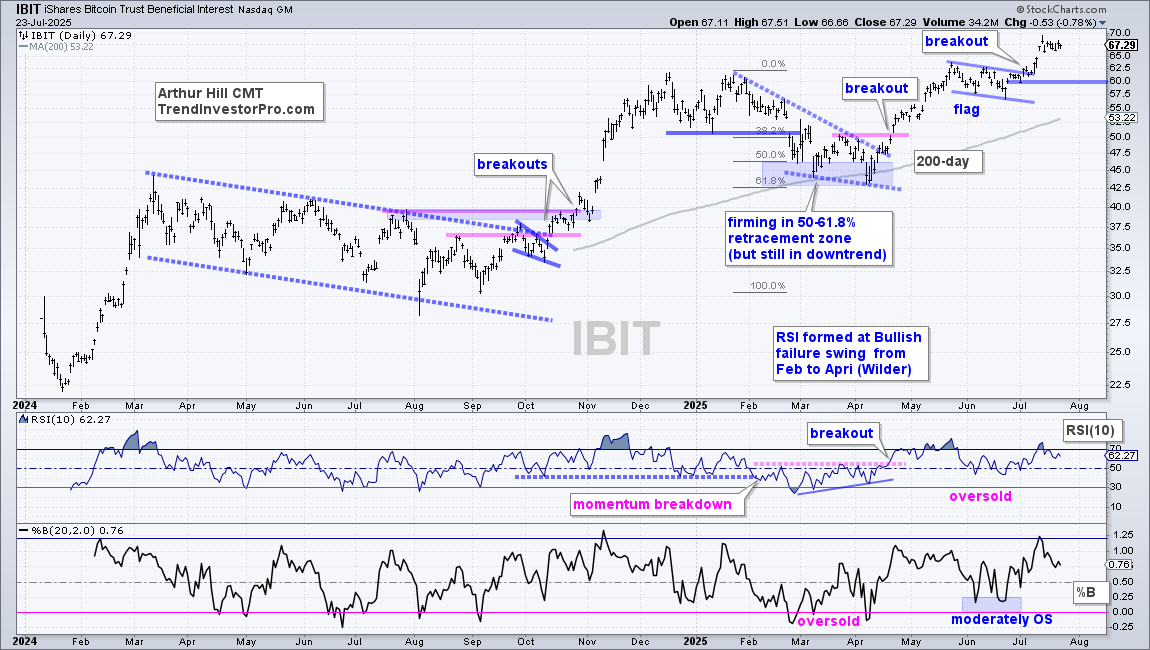
The Bitcoin ETF (IBIT) remains in a leading uptrend with a new high in mid July and price well above the rising 200-day SMA. Short-term, the ETF hit a new high in May, corrected with a falling flag and broke the flag line in early July. This flag was featured in reports on June 26th[3] and July 3rd[4]. IBIT consolidated around the flag breakout zone so I am marking re-evaluation support at 60. I would also note that IBIT broke out at 62.5 and is up around 8% now. This is an area to consider taking some money off the table and setting a stop for the remainder.
IEF Battles Breakout Zone
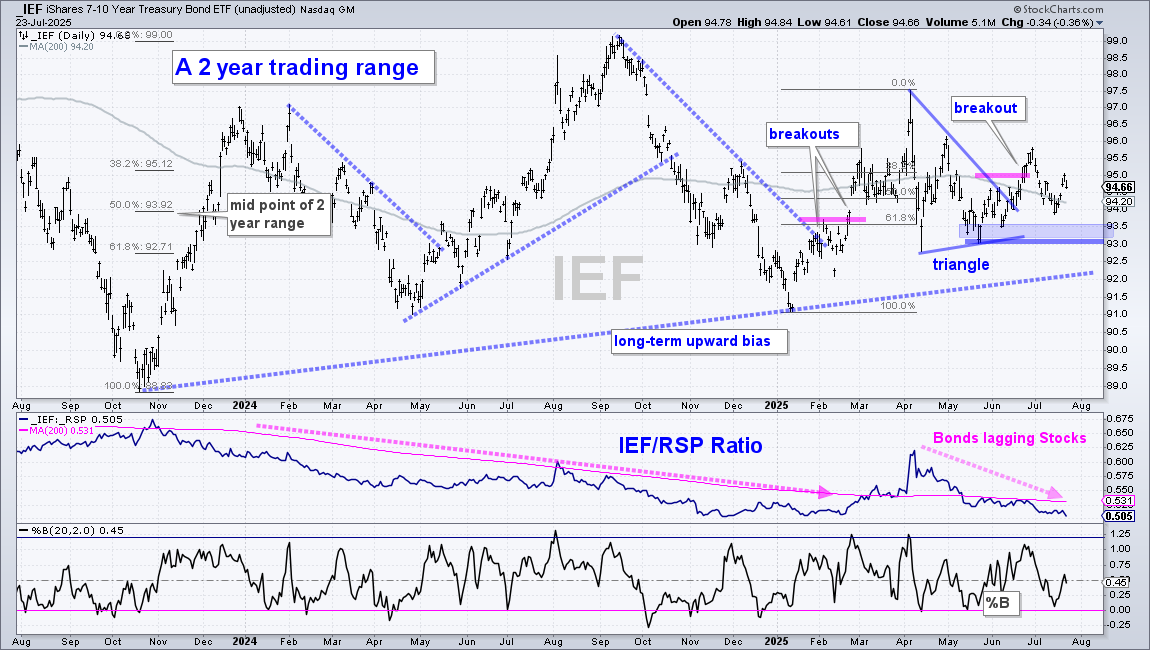
The 7-10Yr TBond ETF (IEF) is stuck in a trading range the last two years and remains just above the mid point (93.91). I am currently bullish because the ETF broke triangle resistance with a surge into late June. Prior to this triangle, IEF surged from 91.5 to 97.5 (early January to early April). I view this triangle as a consolidation after this surge and the breakout as a bullish continuation signal. IEF is struggling to hold this breakout as it fell back below the breakout zone (pink line). I will give the bulls the benefit of the doubt as long as support at 93 holds.
Send feedback to support(at)trendinvestorpro.com or use the contact form. [5]