The next report/video will be on Wednesday, April 9th.
Before looking at the current extremes, keep in mind that the weight of the evidence on the Market Regime page is bearish. We are in a bear market, and bear market rules apply. Support levels are less likely to hold and Bullish Setups are less likely to work. Stocks are extremely oversold right now: long-term and short-term. These oversold conditions could lead to a bounce, but this will be considered a bear market bounce as long as the evidence remains bearish. With volatility higher in bear markets, we can expect some sharp counter-trend bounces and erratic price action.
It is time to exercise some patience and let the market settle down. Bear markets are for big picture analysis. This is not the time to find leading stocks/ETFs or look for bullish setups. There will be oversold bounces, but the bear market and long-term downtrends are the dominant forces at work.
Report Headlines
- Price Decline Reaches a 99.7% Extreme
- Oversold Extreme Does Not Usually Mark the Low
- Breadth Indicators Hit Extremes
- Zweig Breadth Thrust Indicator Becomes Oversold
- SPX %Above 50-day Hits Multi-year Low
Price and breadth indicators hit panic levels as investors indiscriminately dumped stocks. Even though these extremes could foreshadow a bounce, these extremes resulted from strong selling pressure and increasing downside momentum, which is bearish. SPY, QQQ and the vast majority of stocks are in long-term downtrends and new lows expanded within the S&P 500. Such serious technical damage is unlikely to be reversed with the first bounce.
This report will start with SPY and long-term breadth indicators hitting extremes. Even though there were two “V” reversals, the stock market did not hit its final low after the other five extremes. This means the technical damage remains and we need an indicator to signal that the bulls are back in control. We then turn to the Zweig Breadth Thrust and the Percentage of Stocks above the 50-day SMA for thrust signals.
Panic selling differs from capitulation, which typically occurs after an extended decline covering several months. Capitulation occurs when investors tire from the mental strain of losing money for months and throw in the towel. This type of capitulation normally marks a bottom in the stock market. The current extremes, however, are occurring after a seven week decline, as opposed to a multi-month decline. As such, I would classify this as panic selling. Regardless of the terminology, stocks are extremely oversold after a gut-wrenching decline over the last two months.
Price Decline Reaches an Extreme
The S&P 500 SPDR (SPY) reached an extreme by closing below the lower Bollinger Band (200,3) for the first time since June 2022. For reference, SPY crossed the lower Bollinger Band 25 times since 2000. These bands are three standard deviations above/below the 200-day SMA. In a normal distribution, 99.7% of closing prices are within three standard deviations of the 200-day SMA. This infers that a close outside the Bollinger Bands (200,3) is an extreme event. Chartists can also use %B (200,3) to confirm Bollinger Band crosses. A %B cross above 1 means the close is above the upper Bollinger Band, while a %B cross below 0 means the close is below the lower Bollinger Bands.
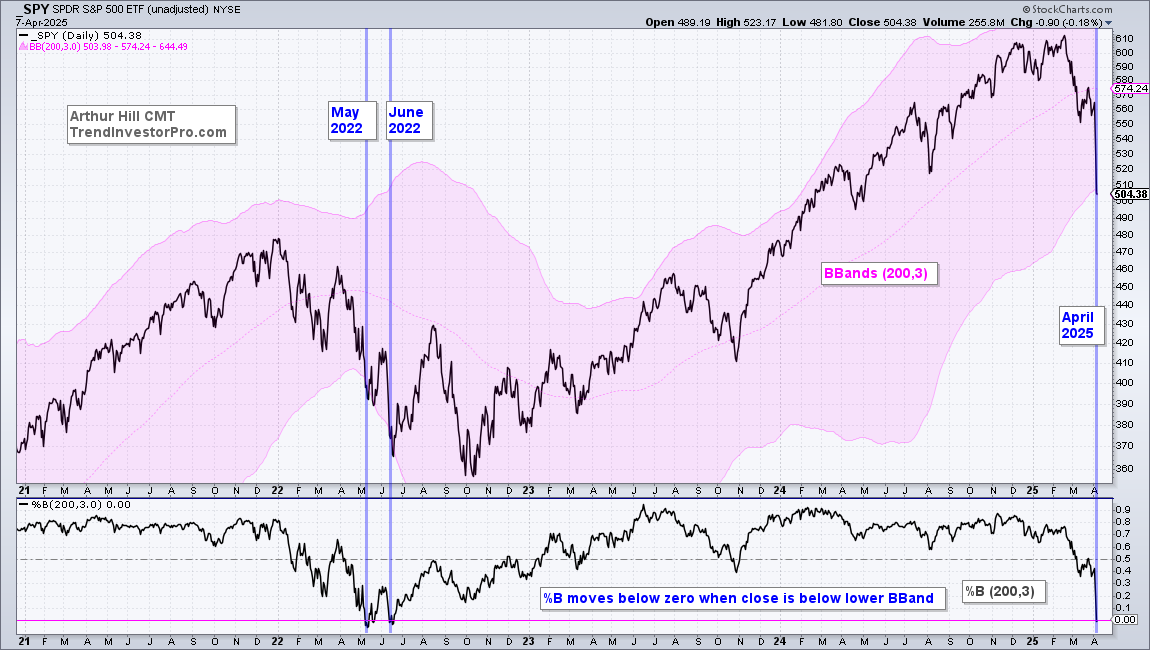
The chart above shows the Bollinger Bands (200, 3) in pink on the price chart and %B (200,3) in the indicator window. The blue lines show when SPY closed below the lower Bollinger Band (May 2022, June 2022 and April 2025). SPY bounced after closing below the lower Bollinger Band in May and June 2022, but these bounces were short-lived as the ETF subsequently moved to new lows. Also note that the first cross below the lower Bollinger Band occurred on 10-May-2022 and SPY did not bottom until 12-October-2022, five months later. Thus, a cross below the lower Bollinger Band signals an oversold extreme that can give way to a bounce, but this oversold extreme does not always coincide with the final low.
Continuing Lower after Initial Oversold Extreme
The next chart shows crosses below the lower Bollinger Band since 2000. Crosses occurred within a few weeks of each other are counted as one blue line. For example, there were actually six crosses in 2008, but there are only four blue lines. There are seven signal groups here, starting with the 2001-2003 bear market and ending with the 2022 Bear Market.
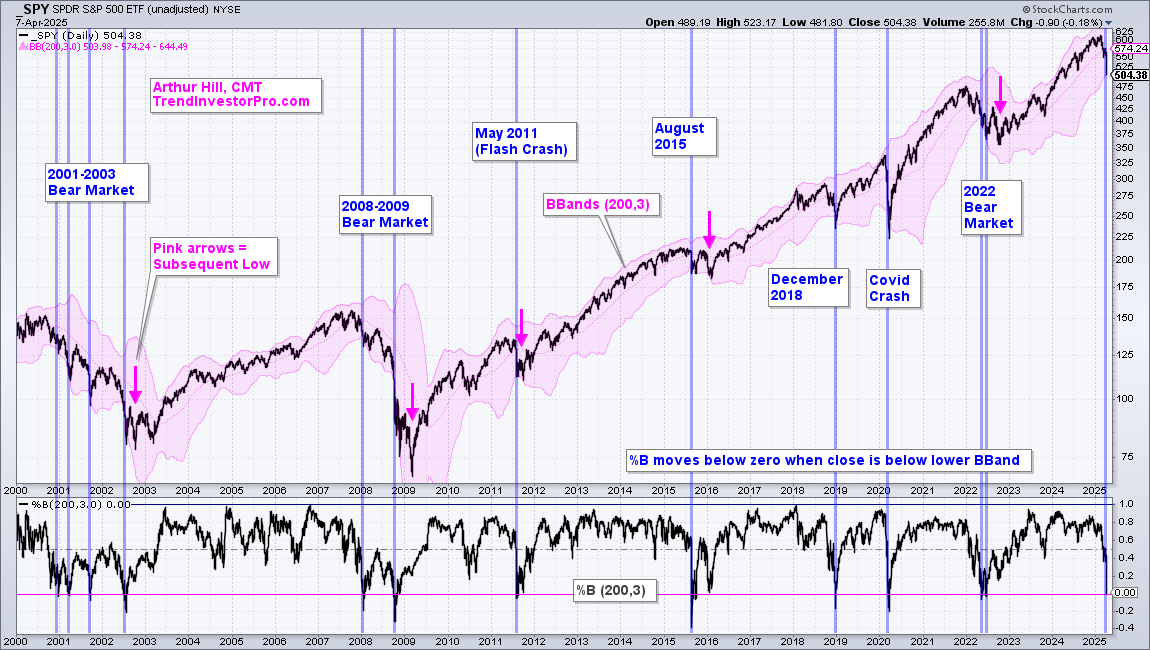
There are three takeaways from these oversold extremes. First, the initial cross below the lower Bollinger Band coincided with a low only twice (December 2018 and March 2020). These were “V” bottoms. Second, SPY moved lower in the weeks or months following these oversold extremes on five occasions (pink arrows). Third, the initial oversold extreme corresponded with bear markets on three occasions (December 2000, January 2008 and May 2022).
Long-term Breadth Indicators Hit Extremes
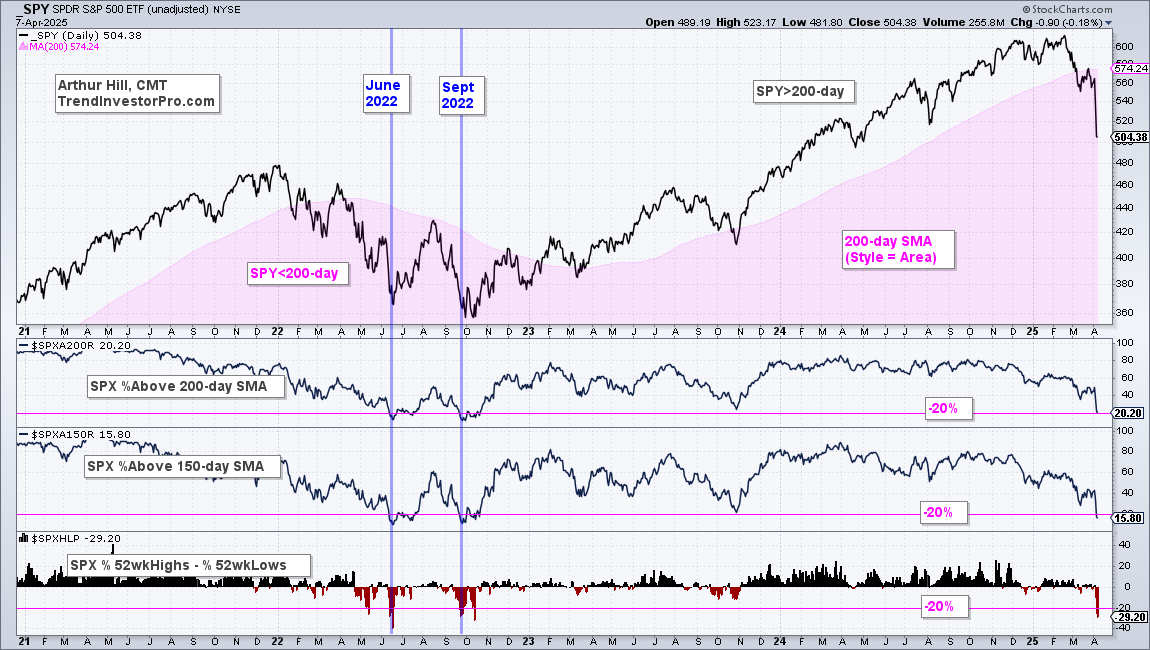
Widespread selling pressure pushed breadth indicators to their lowest levels since October 2022. The next chart shows SPY with three breadth indicators for the S&P 500: the Percentage of Stocks above their 200-day SMAs, the Percentage above their 150-day SMAs and High-Low Percent. The latter is the percentage of 52-week highs less the percentage of 52-week lows.
Breadth indicators measure participation. Extremes occur when investors indiscriminately sell and the vast majority of stocks participate in the decline. I am using 20% as the key level. Selling pressure reaches an extreme when fewer than 20% of stocks are above their 200 or 150 day SMAs. This means more than 80% of stocks are in downtrends. High-Low Percent reaches an extreme with a move below -20%, which implies that 20% of S&P 500 stocks hit new 52-week lows.
The chart below shows all three breadth indicators hitting their extremes in June 2022 and September 2022. The June 2022 extreme led to a strong bounce, but SPY moved to new lows in October and these indicators again hit extremes. Currently, two of the three are at extremes. SPX %Above 150-day dipped below 20% and SPX High-Low Percent dipped below -20%. These extremes argue for a bounce, but not the end of the bear market. We cannot have a bull market when the vast majority of stocks are in downtrends.
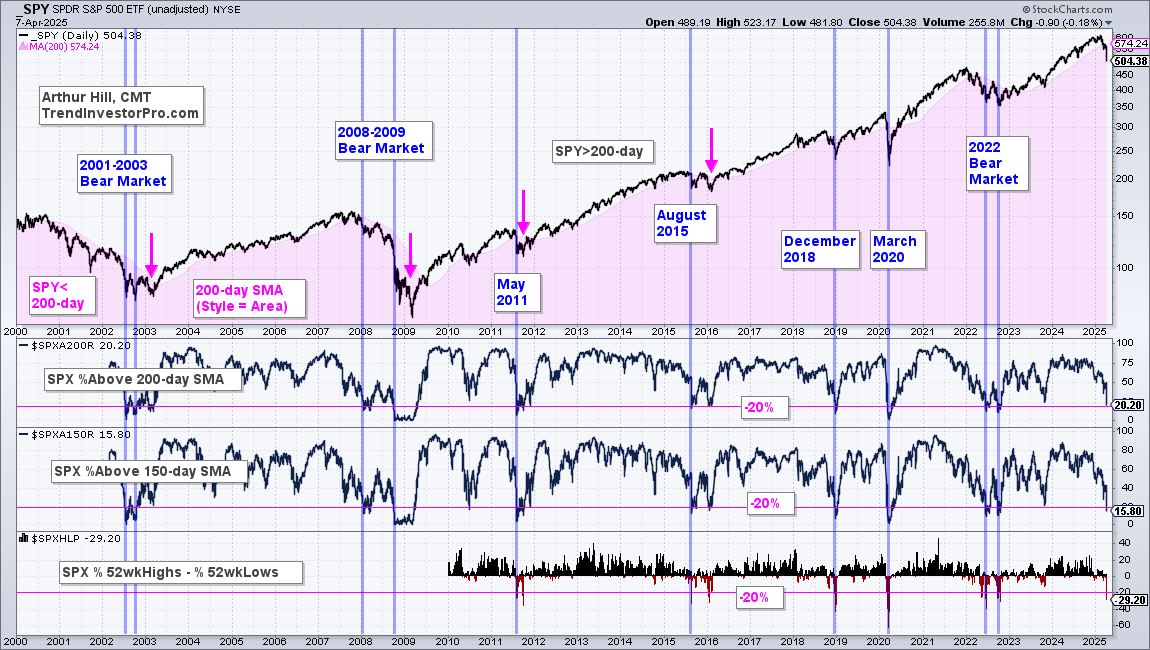
The next chart shows SPY since 2000, but the first two indicators start in 2002 and High-Low Percent starts in 2010. Again, we can see “V” bottoms in December 2018 and March 2020. The pink arrows mark a test of the prior low (2009) or dips below the prior low. Most of the time, there is some sort of double dip or test of the prior low. Usually, the first oversold extreme does not mark the bottom. Why? Because the damage is extensive and it takes time to recovery.
Bearish until Reversed with a Bullish Thrust
What would it take to turn bullish again? Either a bullish Breadth Thrust or bullish signals from the long-term breadth indicators in the Market Regime report [1] (last update was April 2nd). A thrust signal shows a strong short-term surge in upside participation. This can be with a Zweig Breadth Thrust or a signal using S&P 500 Percent Above 50-day SMA ($SPXA50R). See this report/video [2] for details on the Zweig Breath Thrust.
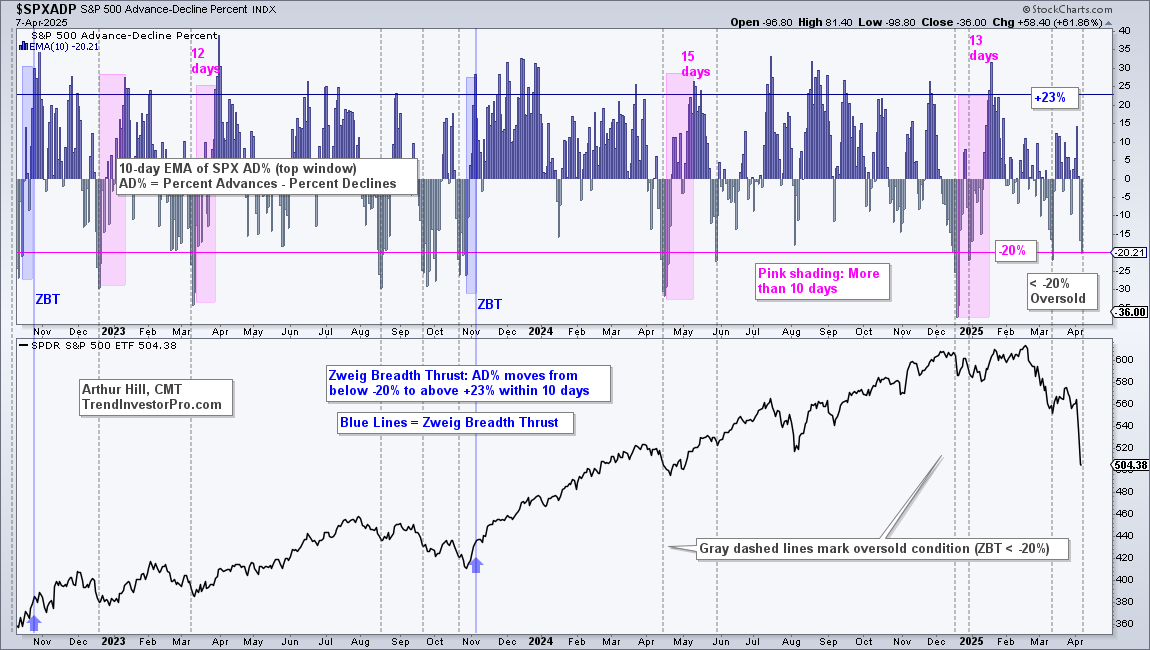
The chart below shows the Zweig Breadth Thrust indicator for the S&P 500 in the top window and SPY in the lower window. This indicator sets up with a move below -20%, which is also an oversold condition (gray dashed lines). These are short-term oversold conditions that can lead to a bounce. The last oversold condition was on March 12th and this led to a dead-cat bounce (555 to 570).
The next chart shows the percentage of S&P 500 stocks above their 50-day SMA. This indicator becomes moderately oversold with a move below 30% and seriously OVERSOLD with a move below 20% (solid pink line). The gray dashed lines mark initial oversold conditions in March 2023, September 2023, December 2024 and April 2025. A bullish thrust signal occurs with a subsequent surge above 60% (blue lines). Again, this shows a sharp and sudden increase in upside participation that can lead to further strength.
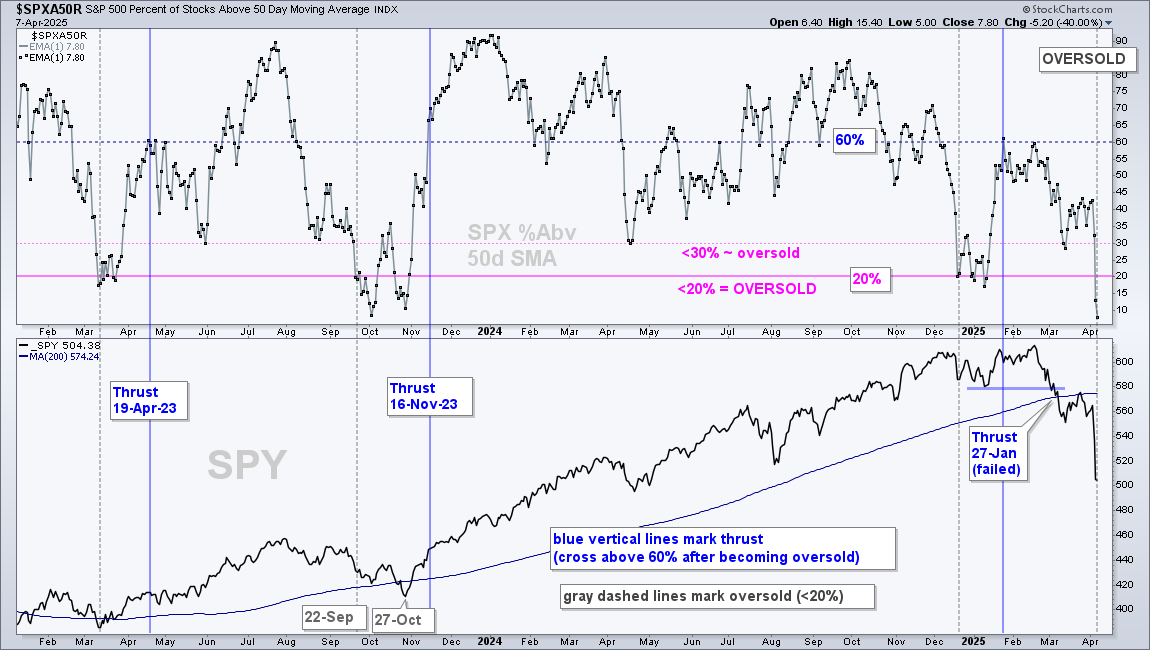
There were three thrust signals over the last two years (19-April-23, 16-Nov-23 and 27-Jan-25). SPY extended higher after the first two, but the third one failed as SPY broke support in early March (blue line). Currently at 6.8%, this indicator is at its lowest level since September 2022. The market has been broad sided with strong selling pressure and there is serious technical damage. Time is needed to repair this damage. Notice how this indicator became oversold on 22-Sept-23 and SPY did not bottom until 27-Oct-23, a month later (see annotations on chart).
It is time to exercise some patience and let the market settle down.
Send feedback to support(at)trendinvestorpro.com or use the contact form. [3]