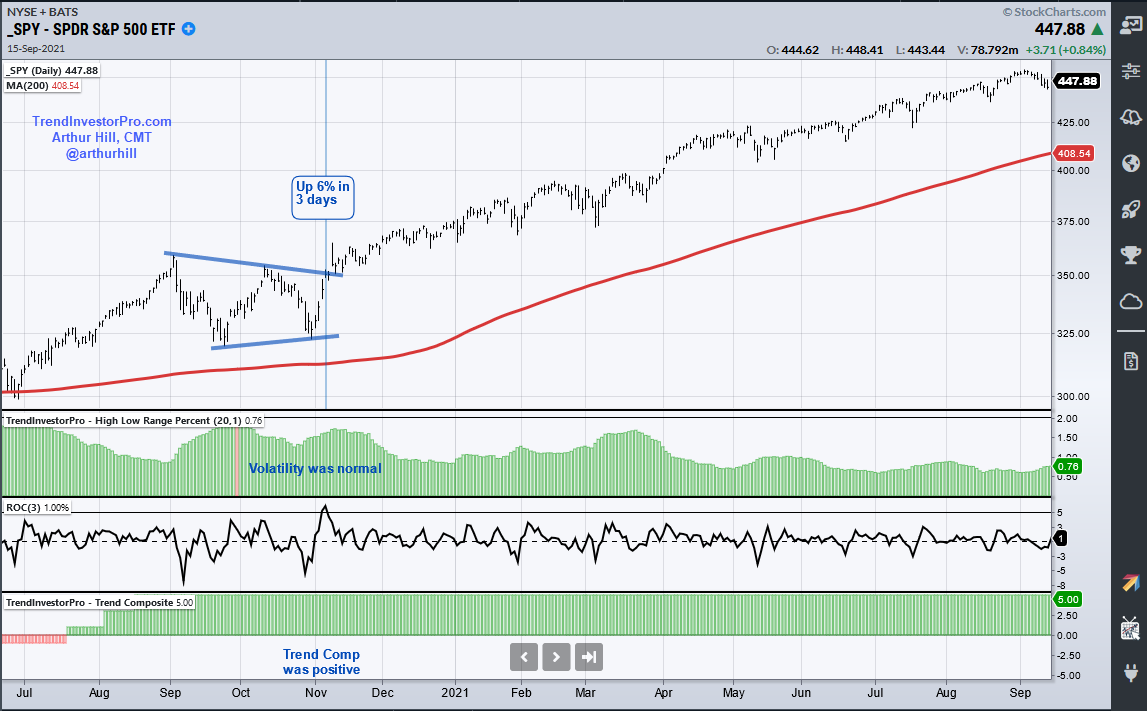
The S&P 500 SPDR (SPY) surged 5.77% from Tuesday to Thursday and this is the biggest 3-day surge since the 6.07% advance on November 5th, 2020. This early November surge led to a breakout and the advance extended until January 2022. The current surge also shows some serious short-term strength, but there are some key differences between now and November 2020. Let’s investigate.
The chart below shows SPY above its 200-day as it consolidated in September-October 2020. The Trend Composite (bottom) window was also bullish. Thus, the long-term trend was up. The middle indicator window shows the 3-day Rate-of-Change for reference. The top indicator window shows 20-day average of the High-Low Range percent, which is the high-low range as a percentage of the average price. This measures volatility and the indicator was below 2% at the time of the November surge (normal volatility). Thus, SPY was in an uptrend and volatility was normal as the ETF broke out of a triangle.
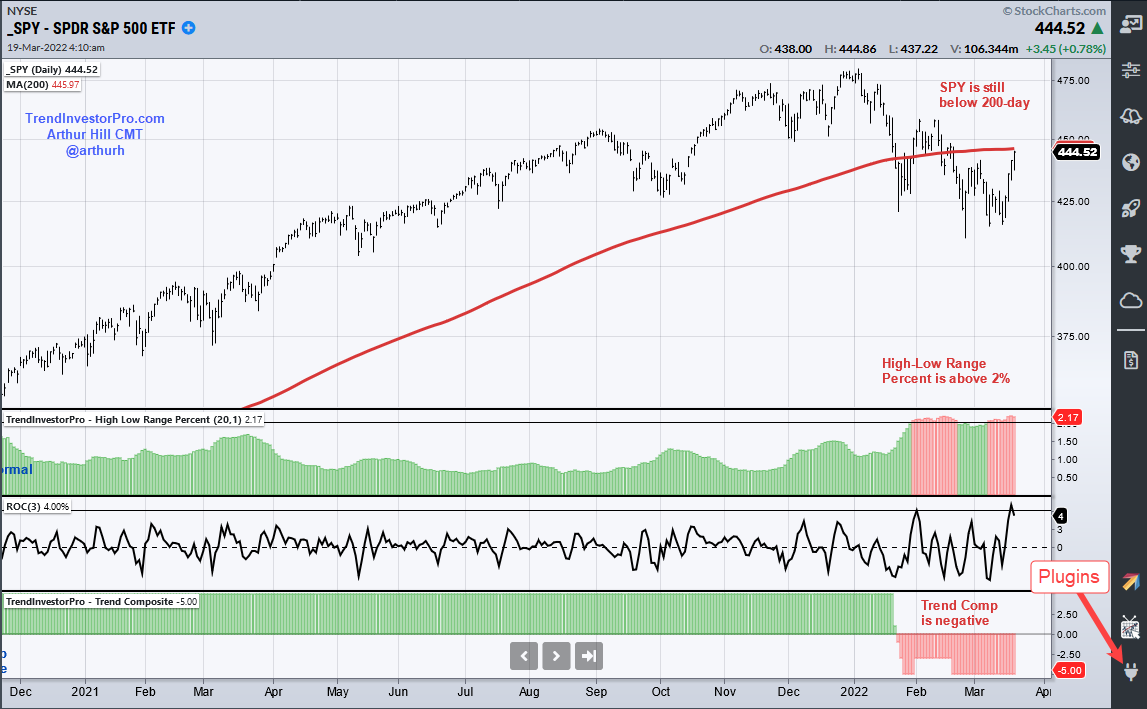
Now let’s look at March 2022. First, SPY is below its 200-day SMA and the Trend Composite is negative. Thus, the long-term trend is still down. Second, the High-Low Range percent indicator has been above 2% for nine days (red) and this shows above average volatility (risk). This week’s surge is impressive short-term, but SPY is still in a downtrend and volatility is above average. I would like to see a meaningful breakout and follow through before considering it as more than a bear market bounce.
This week at TrendInvestorPro I continued the Trend Composite trading strategy series with part five. This part tested a trend-momentum strategy using the 50 ETFs in the All Weather List. Click here for immediate access to this series and more. [1]
On this week’s video [2], I used the High-Low Range percent indicator to quantify volatility in the S&P 500 SPDR (SPY), DB Energy ETF (DBE) and Gold SPDR (GLD). The latter two are in uptrends and experienced short-term parabolic moves.
The Trend Composite and High-Low Range Percent are part of the TIP Indicator Edge Plugin for StockCharts ACP [3]. This plugin includes nine other indicators that help traders define the trend, identify tradable pullbacks and set stops.