The Russell 2000 ETF is finally showing signs of an uptrend with the first higher-low/higher-high sequence in six months. The chart below shows the Russell 1000 ETF (IWB), the Russell 2000 ETF (IWM) and the Russell Microcap ETF (IWC) to compare highs and lows. Chartists can use this technique to find the leader, avoid the laggard and identify the trend. A higher low shows buying pressure (demand) coming in above the prior demand point. A higher-high shows an increase in buying pressure because demand overcame supply at the prior high. The combination is what makes an uptrend.
Overall, large-caps (IWB) are still leading because IWB hit a new high and IWM remains below its May high. Notice that IWB formed an equal low in June, a higher low in August and another higher low in October. In between, the ETF recorded new highs in July and October. IWB is clearly the leader of this group.
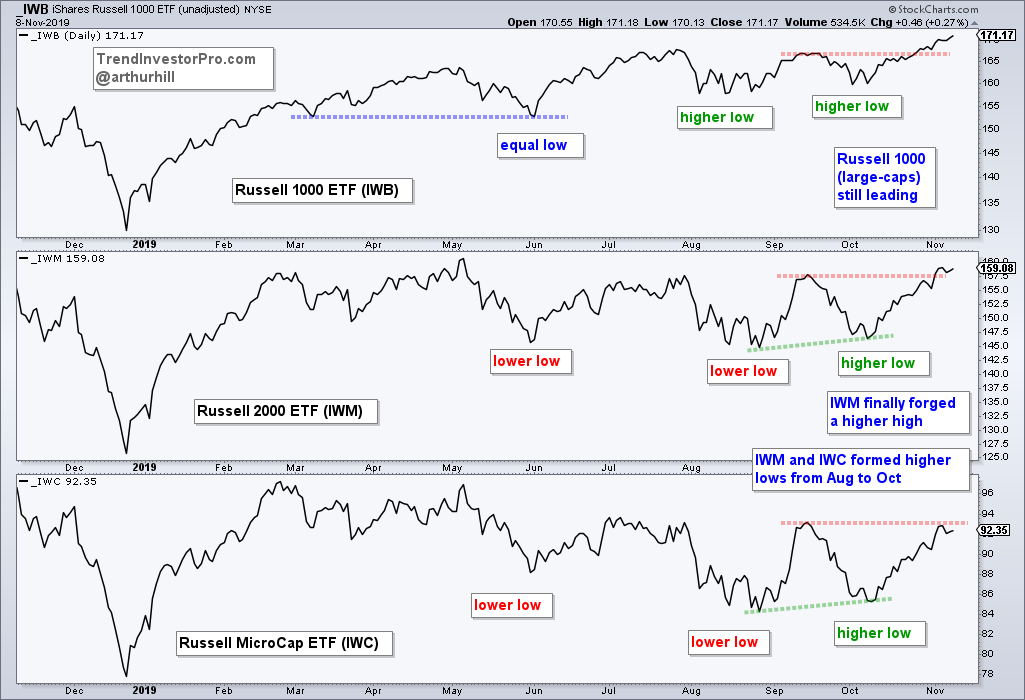
The higher-high/higher-low sequence is relatively new to IWM. Notice how IWM forged lower lows and lower highs when IWB was making higher lows and higher highs. This reflected a downtrend and relative weakness, which is a bad combination. IWM finally forged a higher low in October and moved above its September high in November. This means the trend is now up for IWM. Even so, the ETF is not leading because it remains below its May high.
The Russell Microcap ETF (IWC) has yet to fully turn the corner and reverse its downtrend, but it is close. Microcaps represent high beta stocks and the riskiest end of the stock market. IWC formed a higher low in October as buying pressure picked up. However, buying pressure has not been strong enough to push IWC past the last supply point (September high). A move above this level would forge a higher high and put IWC in uptrend mode. This would show a serious broadening of the bull market and the rise of animal spirits!
The breakouts we witnessed over the last few weeks are long-term bullish, but a few of the major index ETFs and key sectors are quite extended short-term. Even though the market is ripe for a pullback, a pullback or correction is not guaranteed. I am seeing signs of waning participation within the S&P 500 over the last three weeks and this could foreshadow a correction. Timing such a correction, however, is tricky. Friday’s report and Saturday’s video show what to look for short-term. Hint: it has something to do with volatility, the Rate-of-Change and ATR. Sign up today [1] and get immediate access to the commentaries, the ChartBook and the weekend video.