Healthcare Providers ETF Forms Double Bottom (IHF)
Medical Devices and Equipment ETFs Crater (IHI, XHE)
Stocks moved into pullback mode the last few weeks. It started with QQQ peaking on July 19th and SPY peaking on July 31st. It is way too early to call these “major” peaks. At present, these are just short-term peaks because both ETFs are pulling back after substantial advances. Within the ETF universe, we are seeing hard pullbacks in tech, clean energy and some healthcare related ETFs. ETFs related to housing, aerospace & defense and banking held up relatively well and formed bullish continuation patterns. Overall, I remain concerned with relative weakness in QQQ and the overbought readings in some breadth indicators (see below). SPY and QQQ are now in short-term downtrends and this means corrective mode for stocks.
Weight of Evidence Bullish
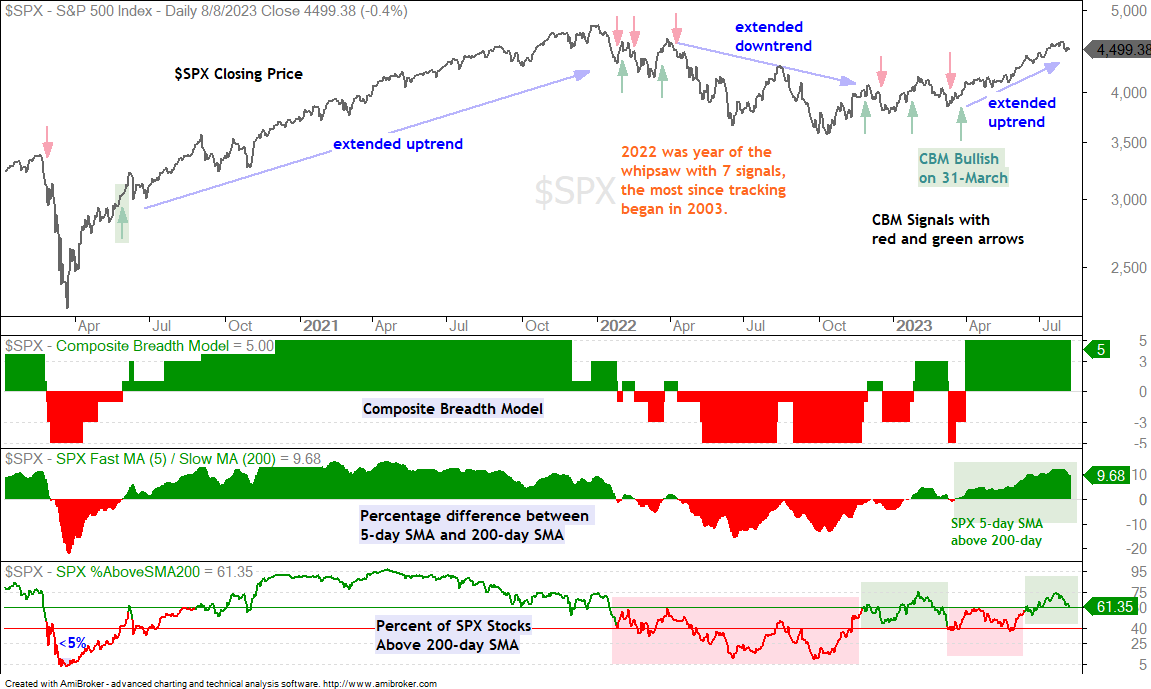
Overall, the weight of the evidence remains bullish for stocks. The Composite Breadth Model is positive (since March 31st), yield spreads show no stress and the 5-day SMA is above the 200-day SMA for $SPX.
SPX ADP50 Line Does Not Confirm M Top
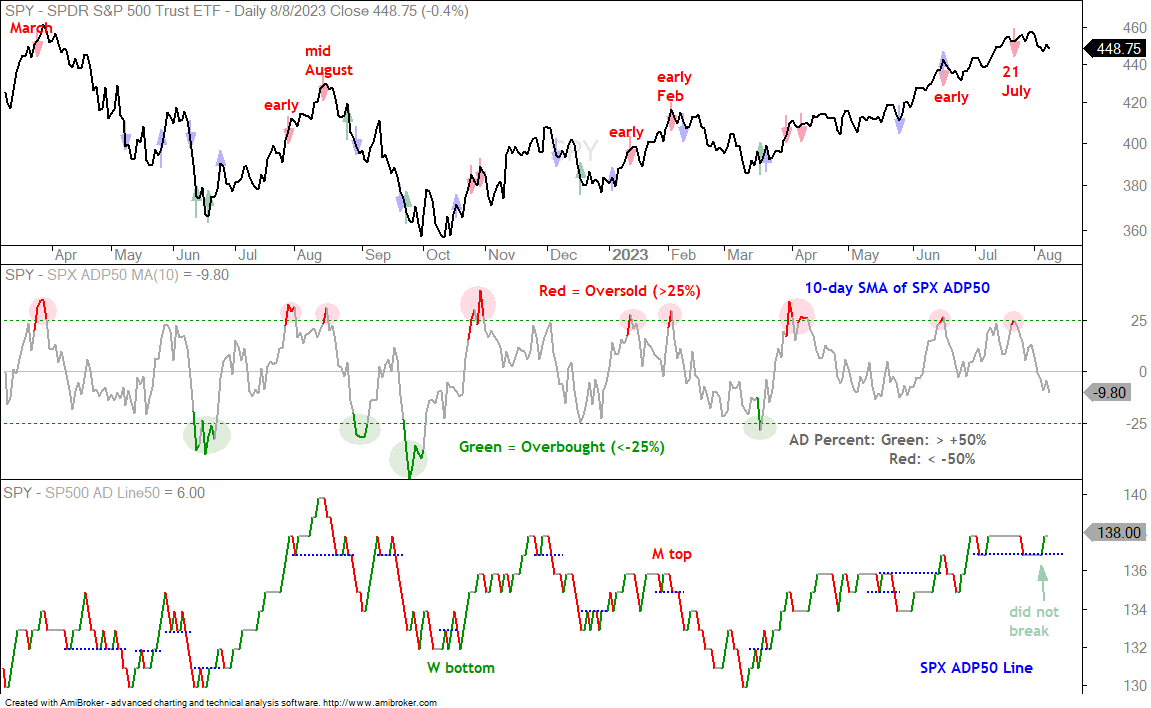
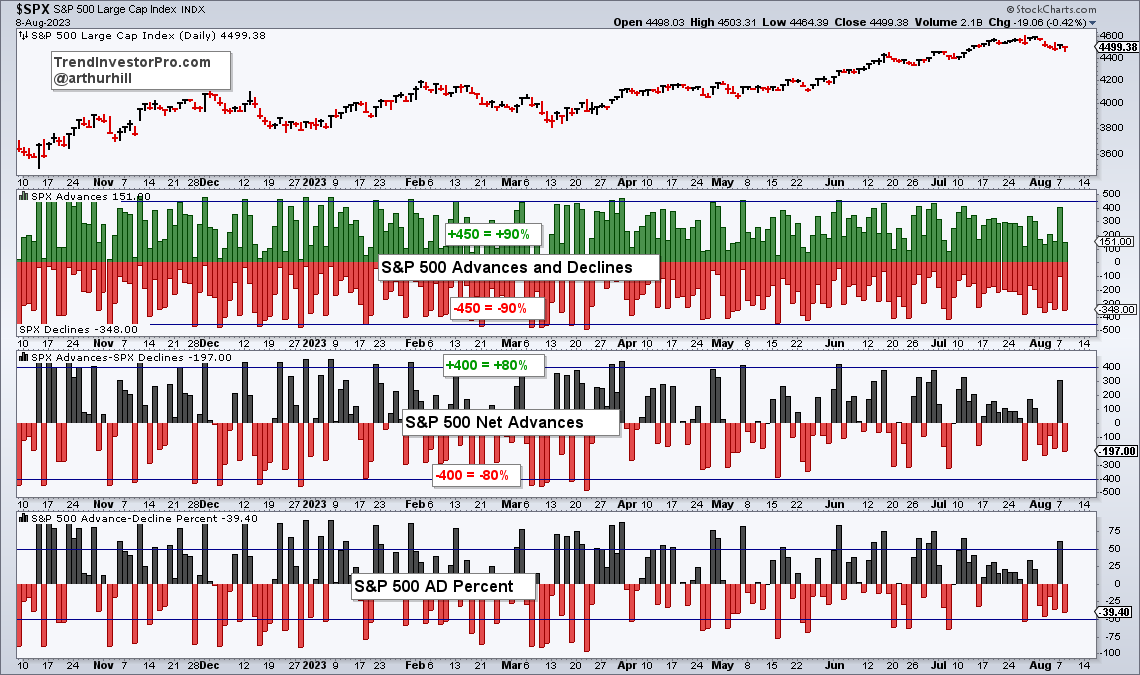
The 10-day SMA of S&P 500 ADP% became overbought (>25%) on July 21st (red oval) and SPY pulled back in August (middle window). The pullback is not that extreme because S&P 500 Advance-Decline Percent did not exceed -50% in early August. As a result, the SPX ADP50 Line did not break below the prior low to confirm the M top. See last week’s report for details on the M top[1]. The AD Line50 prints a -1 when SPX Advance-Decline Percent is below -50% and a +1 when above 50%. SPX AD% exceeded 50% on Monday and the SPX ADP50 Line ticked up (green arrow). At this point, SPX AD% would have to exceed -50% twice to break the prior low and confirm the possible M top.
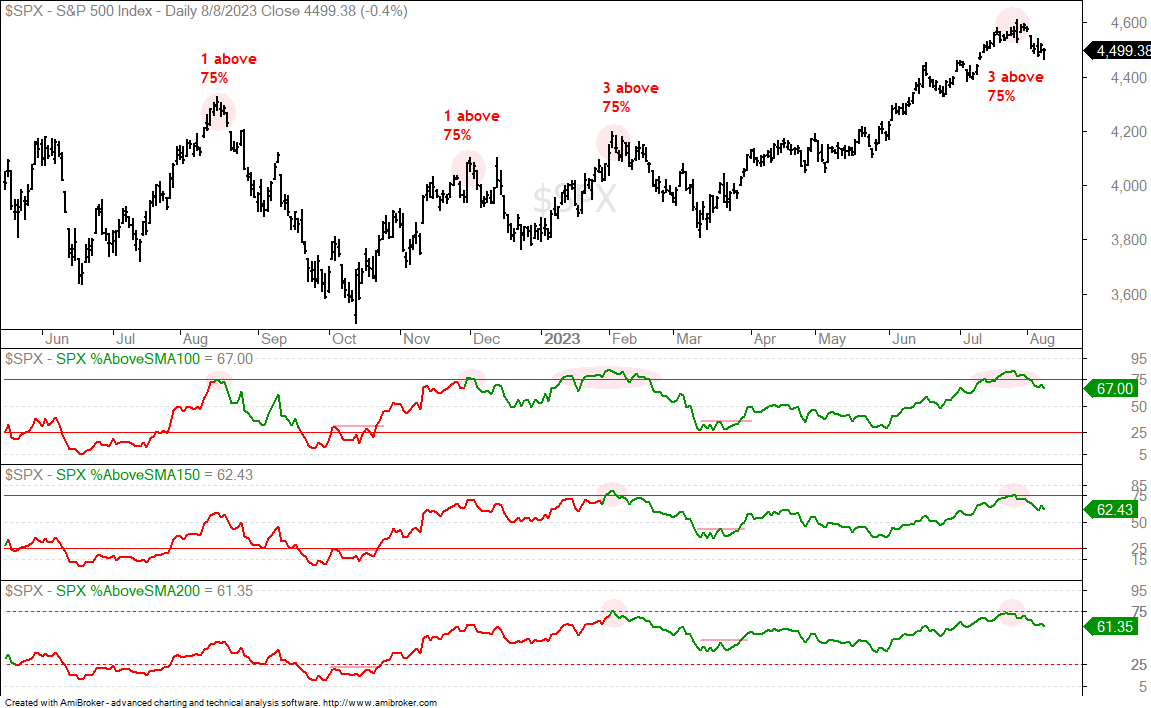
The next chart shows three indicators: the percentage of S&P 500 stocks above their 100, 150 and 200 day SMAs. The “subjective” green lines are set at 75% and the red lines at 25%. These indicators become overbought above 75% (red ovals) and recent overbought readings led to pullbacks in August, December and February. Note that overbought setups and signals do not work in strong trending markets, such as the period from June 2020 to June 2021. The $1,000,000 question: are we in a strong bull market or a swing market with short trends? Given performance since January 2022, I would suggest the latter. As the price chart shows, SPX %Above 100-day SMA became overbought in mid August and late November. All three indicators were overbought in early February. The market pulled back in each case. Most recently, all three indicators were overbought in late July. This suggests a pullback in the making.
SPY Forms Falling Flag
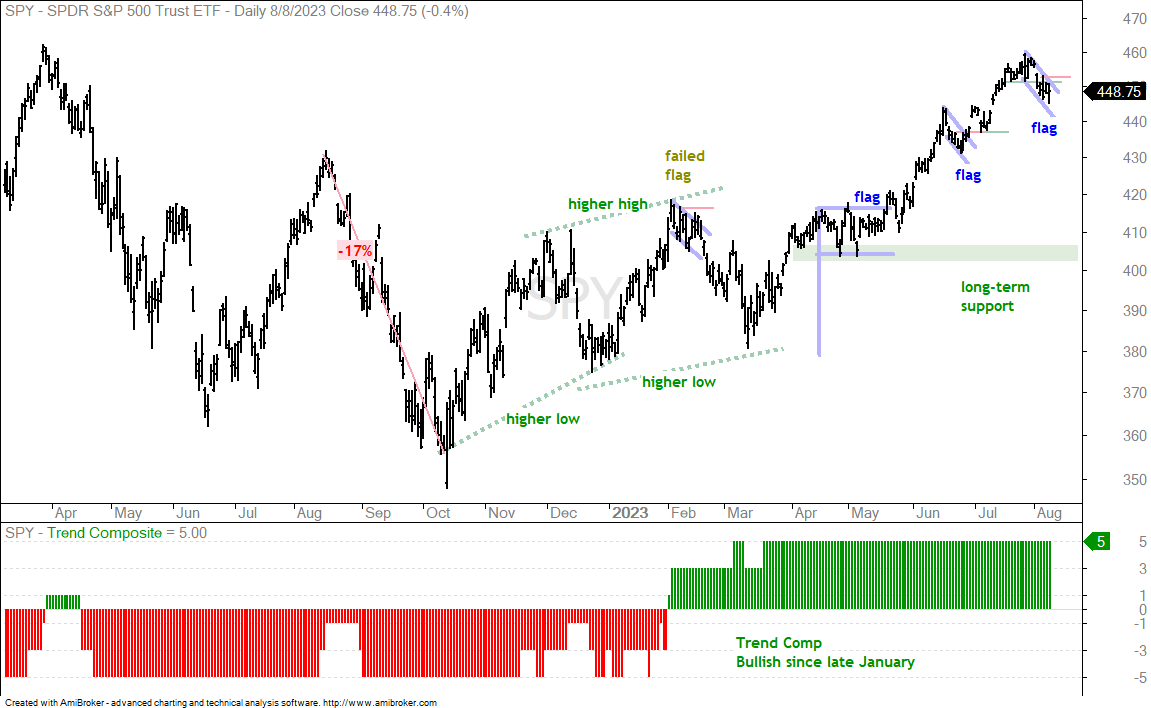
There is no change in the long-term trend. It is up. Short-term, SPY pulled back with a falling flag similar to the one in late June. SPY broke out of this flag on June 29th, fell back to the breakout zone and then surged into late July. SPY peaked in late July and fell back in August to firm the current flag. I am marking flag resistance with the 4-Aug high and a break above 453 would be short-term bullish. Until then, the short-term trend is down and SPY in is pullback mode.
The last two flag breakouts led to further gains, but the February flag failed. Notice that the February flag broke the upper line of the flag, but did not break the high in the middle of the flag (resistance). This is the break that produces a short-term higher high and it did not happen then.
Sharp Pullback for the S&P 500 EW ETF (RSP)
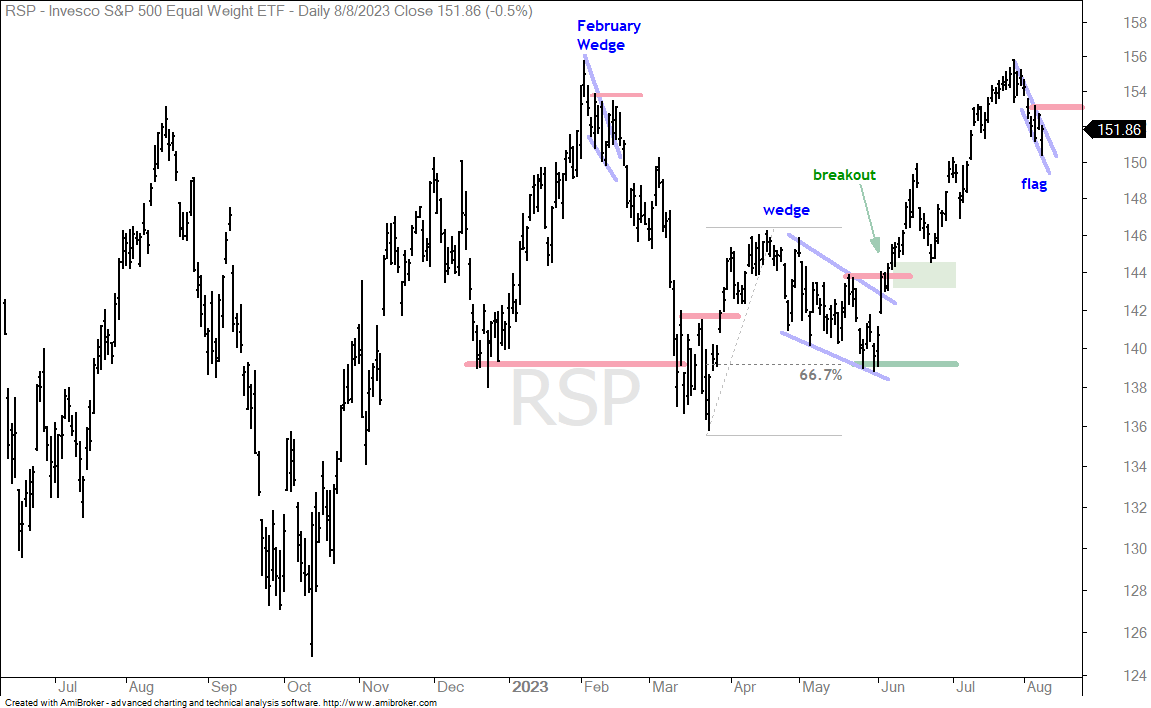
The next chart shows the S&P 500 EW ETF (RSP) with a surge to the February high and a sharp pullback the last two weeks. The pullback looks like a falling flag and a break above 153.2 would be short-term bullish. Failure to break out means the short-term trend is down and the market remains in pullback modus. Note the February wedge, which failed. RSP broke the upper line, but did not exceed the peak in the middle of the wedge (red line).
QQQ Forms Flag as RSI Tests Range Support
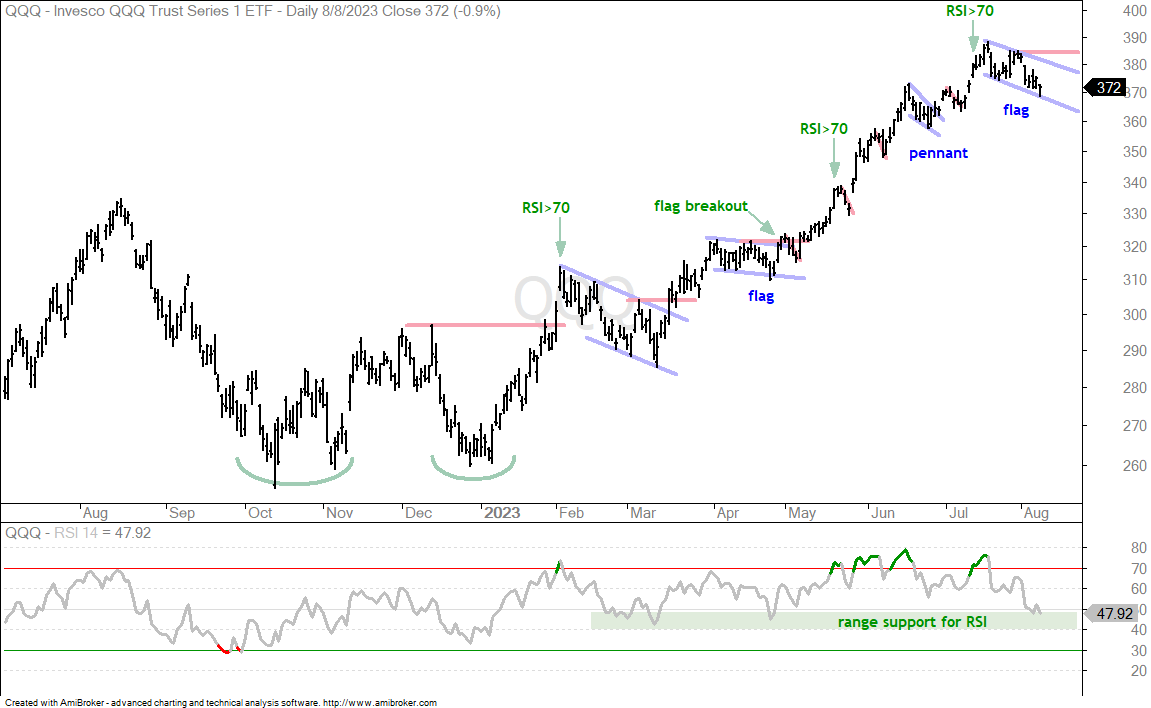
SPY recorded a closing high on July 31st, but QQQ peaked almost two weeks earlier with a closing high on July 19th. Thus, QQQ is showing relative weakness since the latter part of July. This is a concern because QQQ was powering the market higher from early May to mid July and the market is losing its leader. On the price chart, QQQ formed a falling flag over the last few weeks with flag resistance marked at 385 (red line). The short-term trend is down as long as the flag falls.
The indicator window shows RSI hitting a moment of truth. The bull range for RSI is 40 to 90. Notice that RSI exceeded 70 on February 2nd as QQQ broke above the December high. Since this price breakout and momentum surge, RSI found support in the 40-50 zone in February-March and again in April. RSI is currently in this zone and this is an area to watch for a bounce. Failure to bounce and a break below 40 would show the strongest downside momentum since the first week of January.
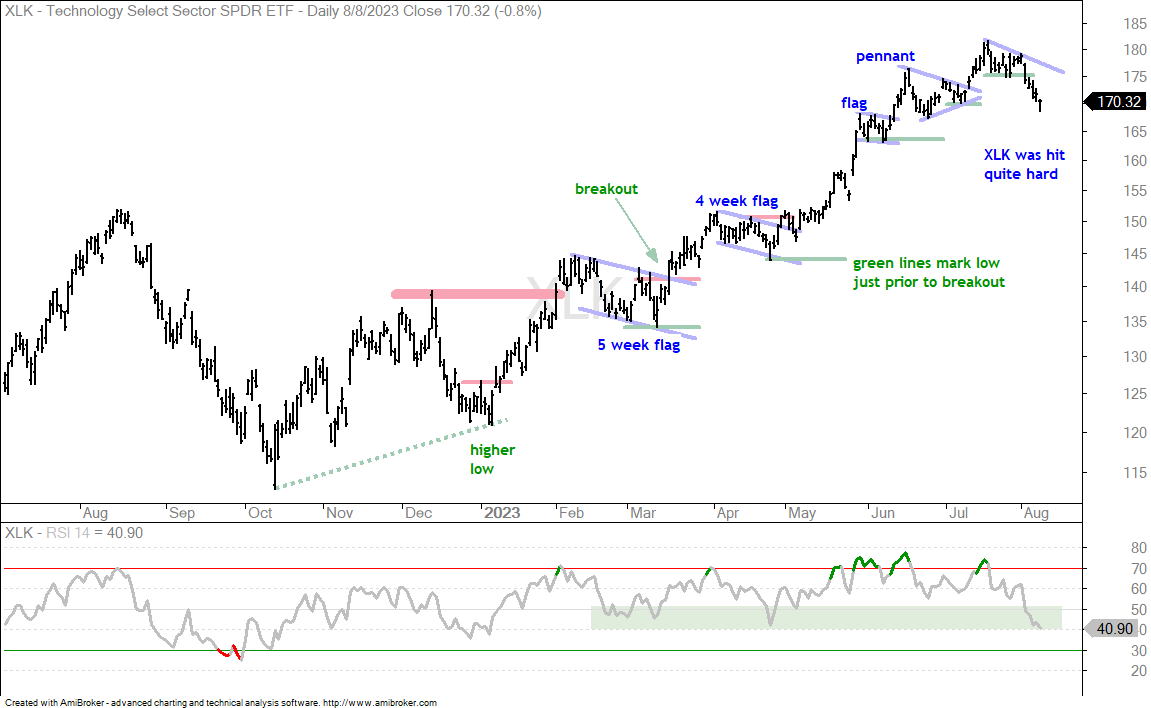
The next chart shows the Technology SPDR (XLK) with RSI hitting its support zone. XLK was hit quite hard the last five days as traders react to earnings reports, and these reactions have been brutal. XLK broke short-term support at 175 and this means the short-term trend is down. The tech sector is also in pullback modus.
Cloud and Software ETFs Fail to Hold Breakouts (SKYY, IGV)
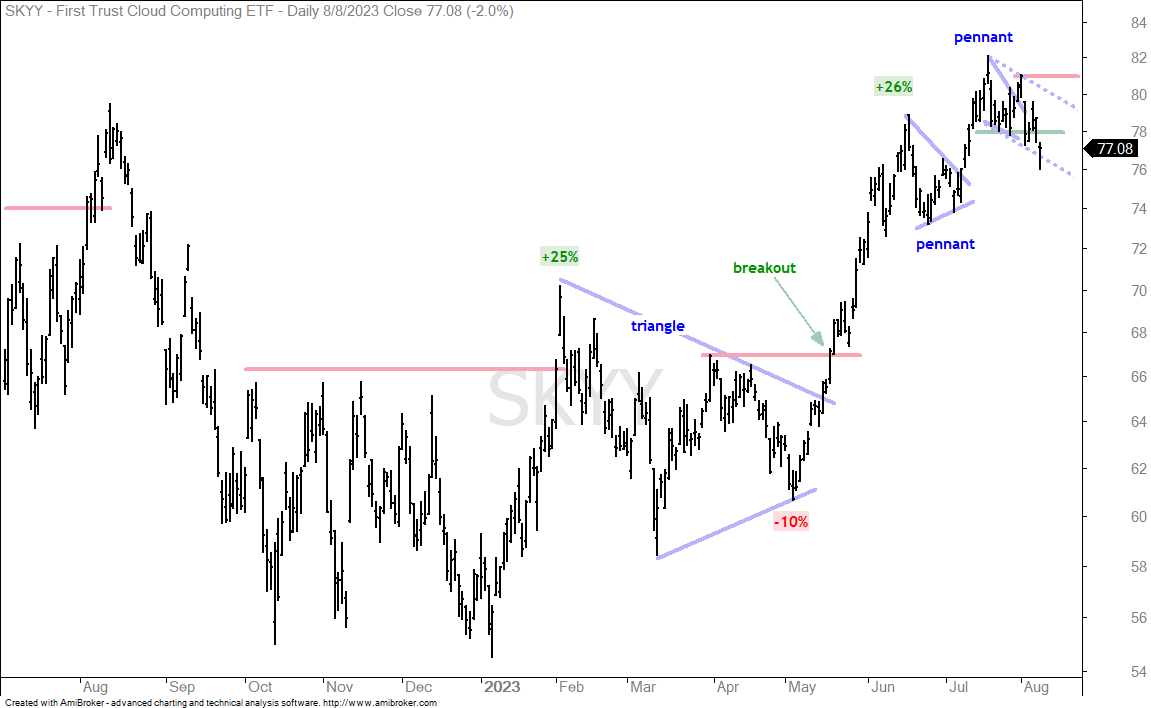
The next chart shows the Cloud Computing ETF (SKYY) with a pennant in late July, an early August breakout and a failed break. The decline over the last five days was exceptionally sharp and broke the pennant lows at 78. The dotted lines show a falling flag developing.
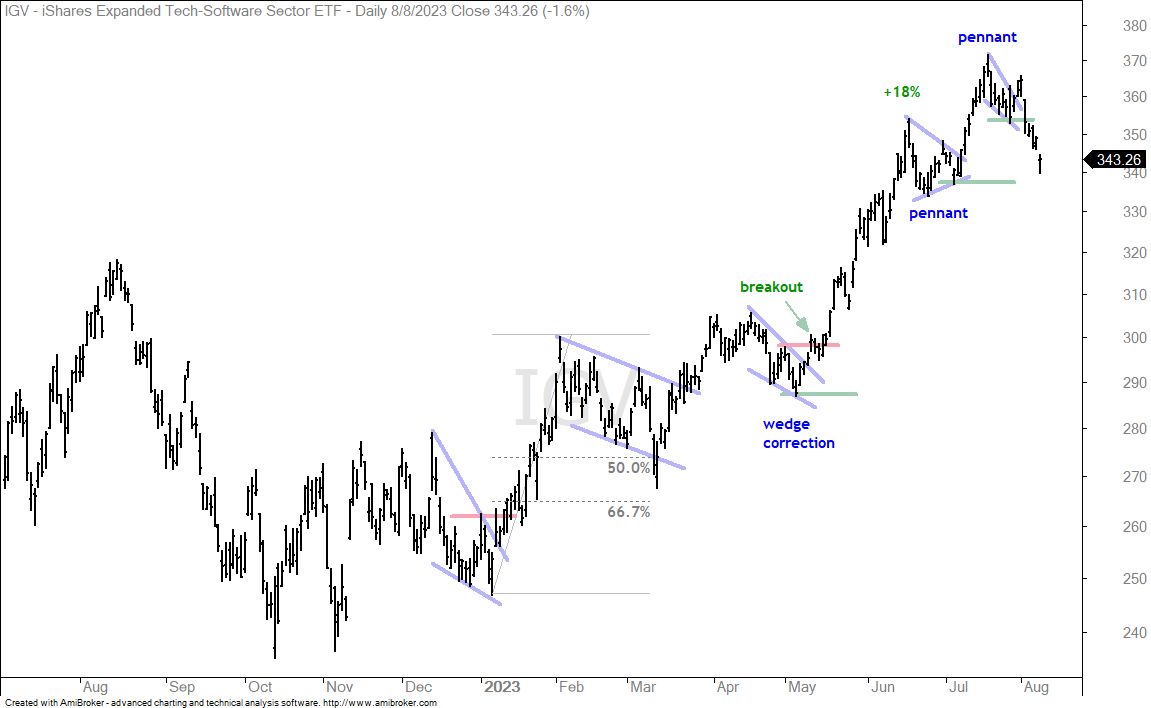
The next chart shows the Software ETF (IGV) with a failed breakout and a support break at 354 (green line).
Note that I am seeing lots of short-term support breaks in tech-related ETFs. The late July lows marked short-term support and several broke these lows over the last few days. These include the Cybersecurity ETF (CIBR), Internet ETF (FDN) and Mobile Payments ETF (IPAY). Many tech ETFs are short-term oversold after sharp declines and these conditions could give way to a mean-reversion bounce. See the ETF Mean-Reversion Table for Setups.[3]
Semiconductor ETF Holds Above Late July Low (SOXX)
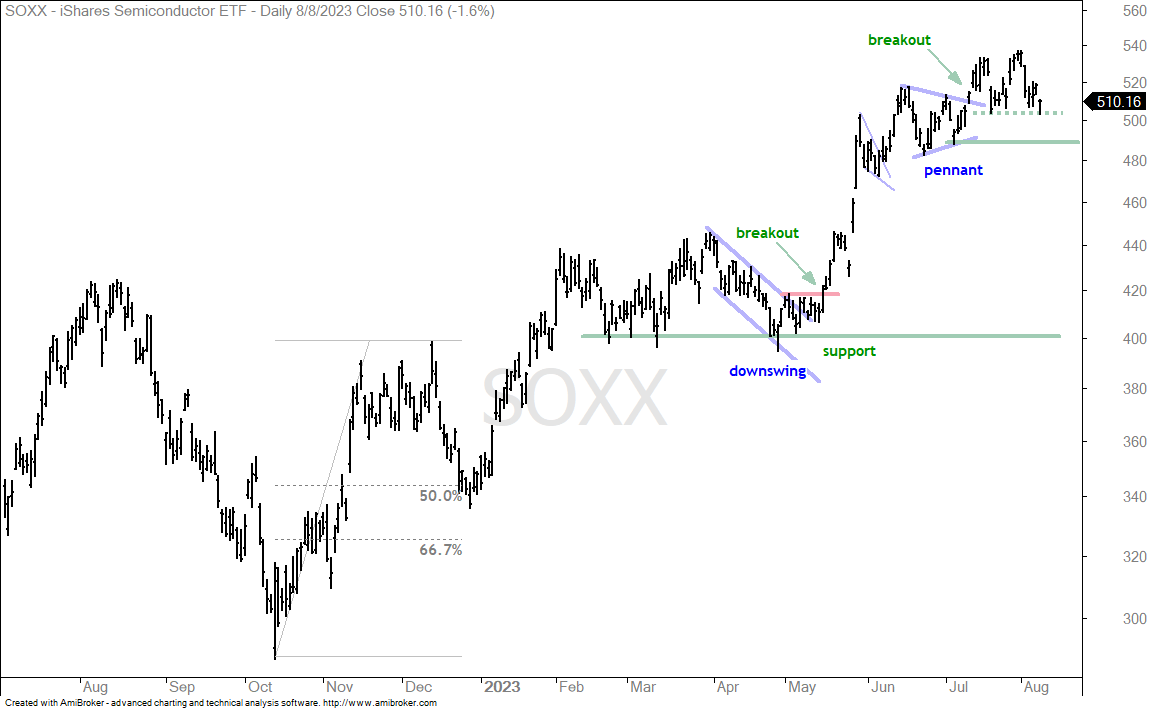
The Semiconductor ETF (SOXX) is showing relative strength because it has yet to break its late July low in the 503 area (green dotted line). Overall, SOXX broke out of a pennant and fell back to the breakout zone twice in the last few weeks. The breakout is still holding with the low just before the breakout marking support at 489.
Housing Holds Strong (ITB)
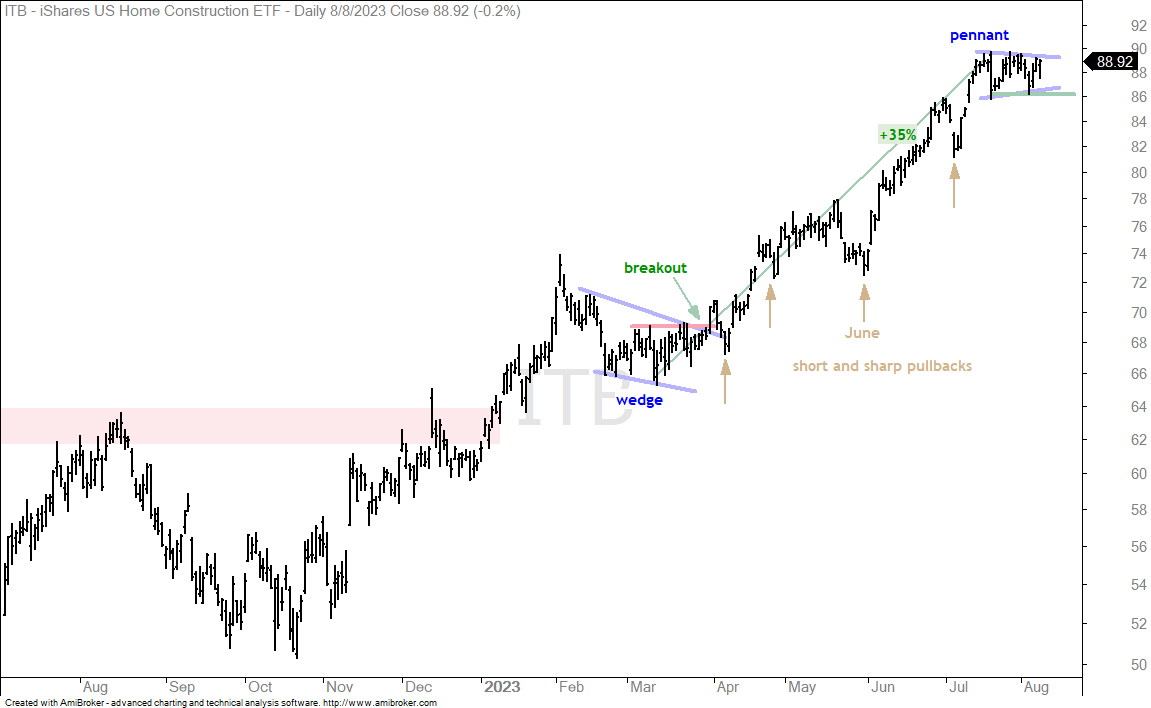
The market pulled back the last week or so, but the Home Construction ETF (ITB) held strong and simply consolidated. ITB formed a pennant over the last few weeks and this is a bullish continuation pattern. A break above 90 would signal a continuation higher. The pennant lows mark first support at 86 and a break here would argue for a correction.
Bank ETF Forms Small Flag (KRE)
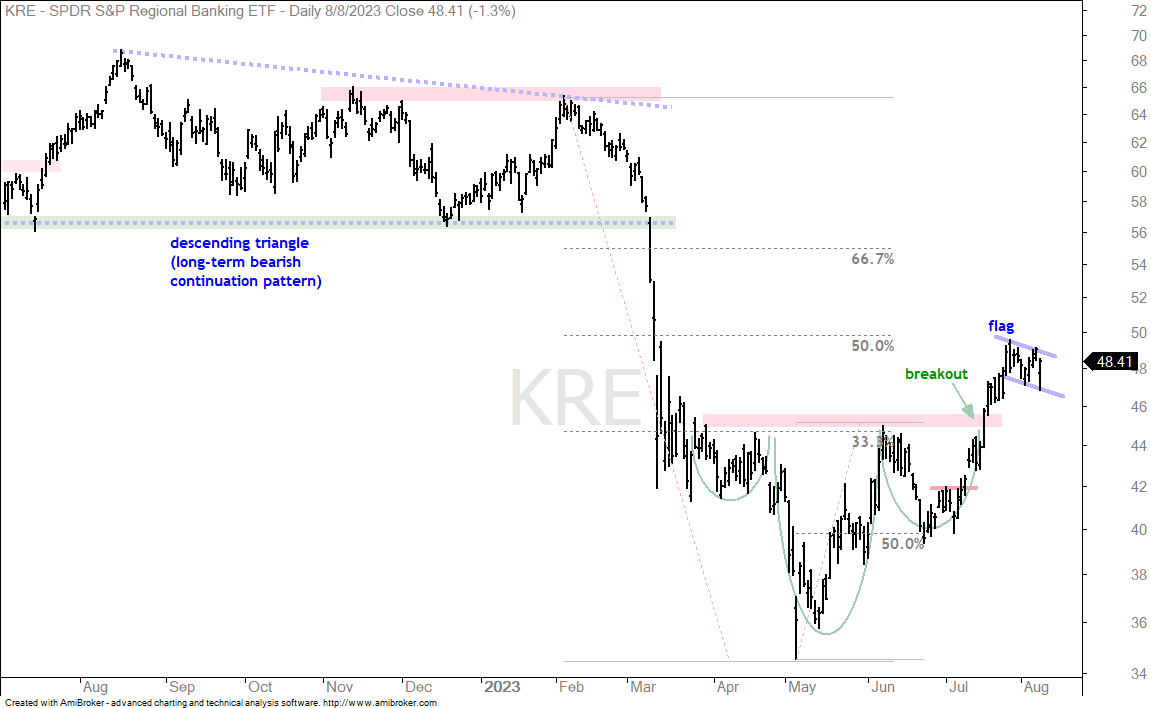
The Regional Bank ETF (KRE) also held up pretty good over the past week as it consolidated with a flag. Overall, KRE broke resistance with a surge in July and then consolidated with a flag in August. A flag breakout would signal a continuation higher and target a move toward the mid 50s.
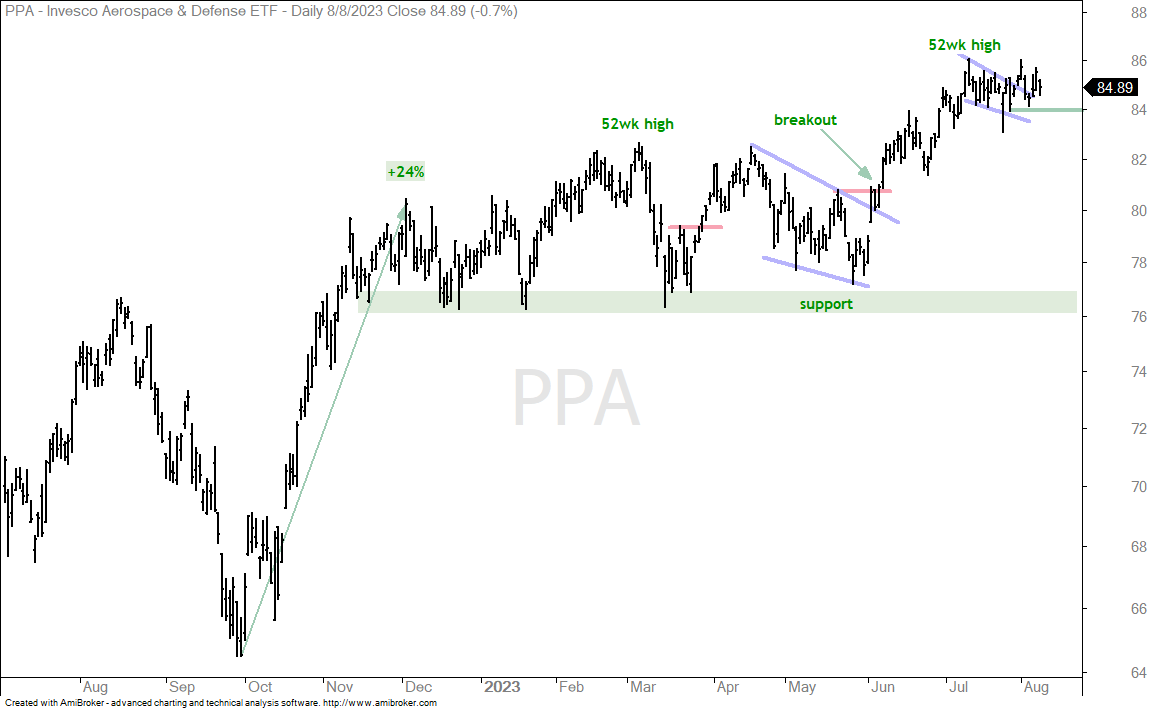
The Aerospace & Defense ETF (PPA) remains a leader overall and the ETF also held up well the last two weeks. PPA surged from early June to mid July and then corrected with a pennant. The ETF broke out of this pennant in early August and then tested the breakout with some choppy trading the last few days. Overall, the breakout is holding with short-term support marked a 84. While a break below 84 would reverse the short-term upswing, it would not affect the long-term uptrend.
Water Resources ETF Forms Bull Flag (PHO)
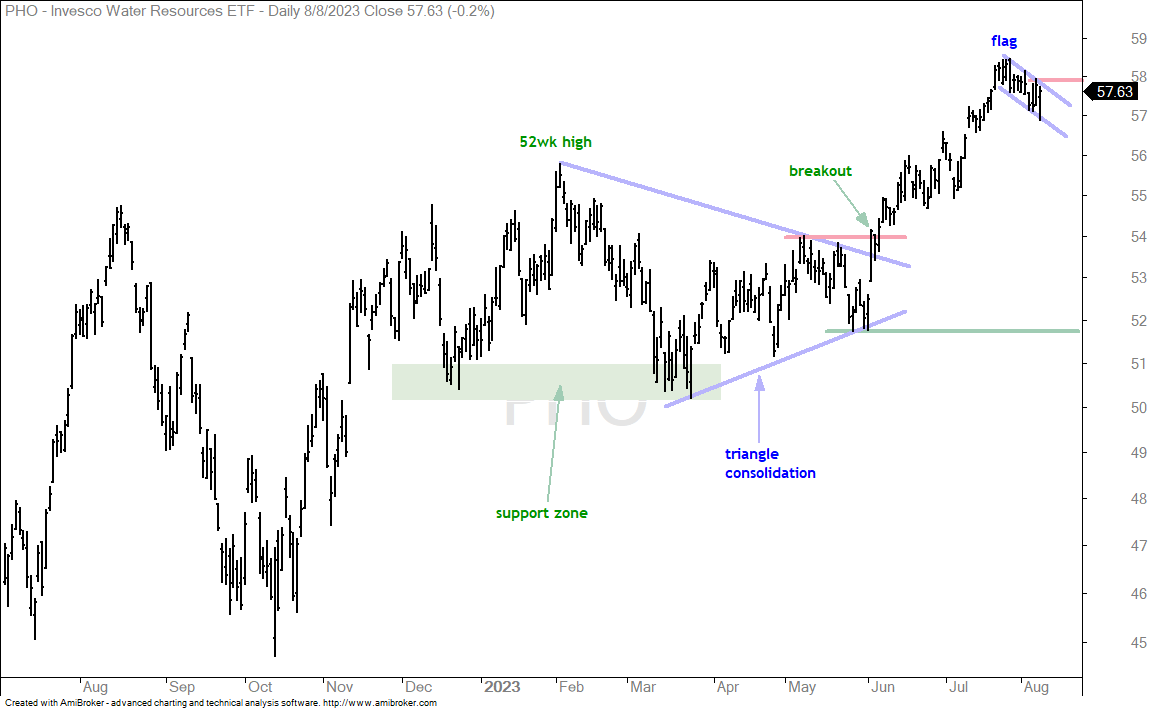
This chart does not need much explanation because we are seeing quite a few bull flags the last week or two. I am trying to separate the stronger bull flags from the weaker ones. A falling flag with a sharp decline shows more selling pressure than a falling flag with a modest decline. PHO sports a modest decline and a bull flag. A breakout at 58 would continue the uptrend.
Watching two Biotech ETFs (IBB, BBH)
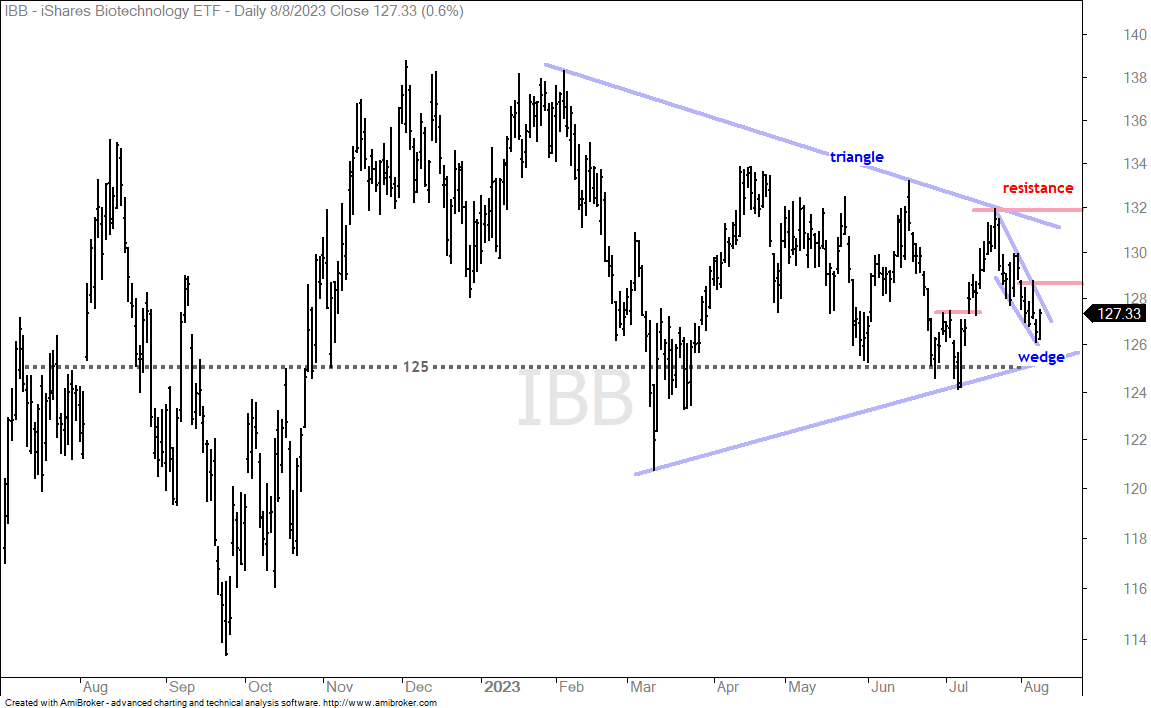
The Biotech ETF (IBB) remains on my radar because it is consolidating with a large triangle. I am watching the swings within this triangle for an upswing signal. The current swing is down with a falling wedge taking shape. A break above 129 would reverse this fall and increase the chances for a bigger breakout at 132.
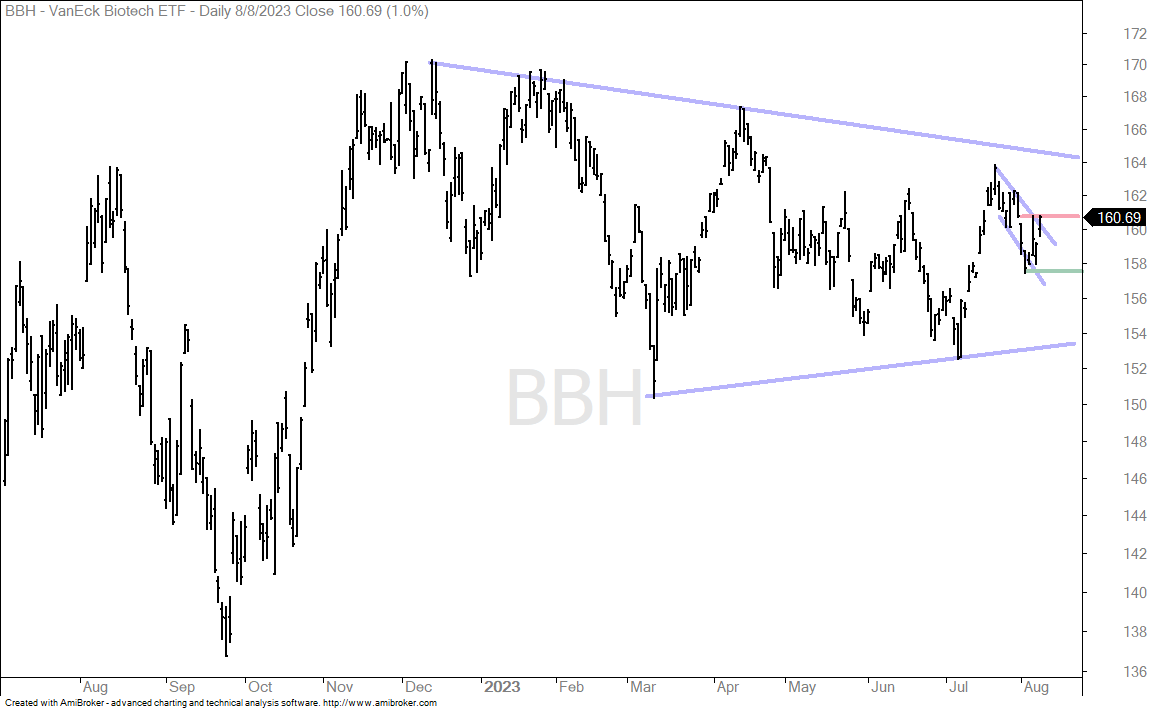
The next chart shows the Biotech ETF (BBH) with similar characteristics.
Healthcare Providers ETF Forms Double Bottom (IHF)
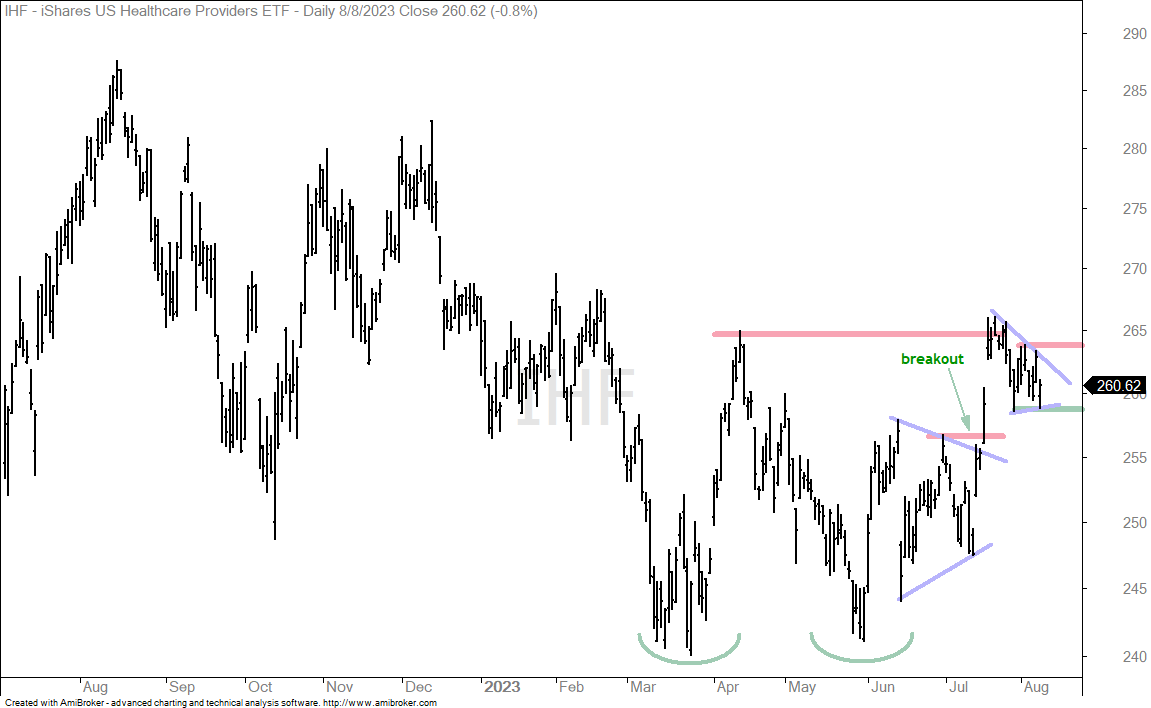
The next chart shows the Healthcare Providers ETF (IHF) with two lows in the 240 area (green arcs) and a break above the intermittent high in late July. This breakout did not hold, but the ETF formed a triangle-like consolidation the last few weeks. This looks like a consolidation after the July surge and a break above the early August highs (264) would signal a continuation higher.
Medical Devices and Equipment ETFs Crater (IHI, XHE)
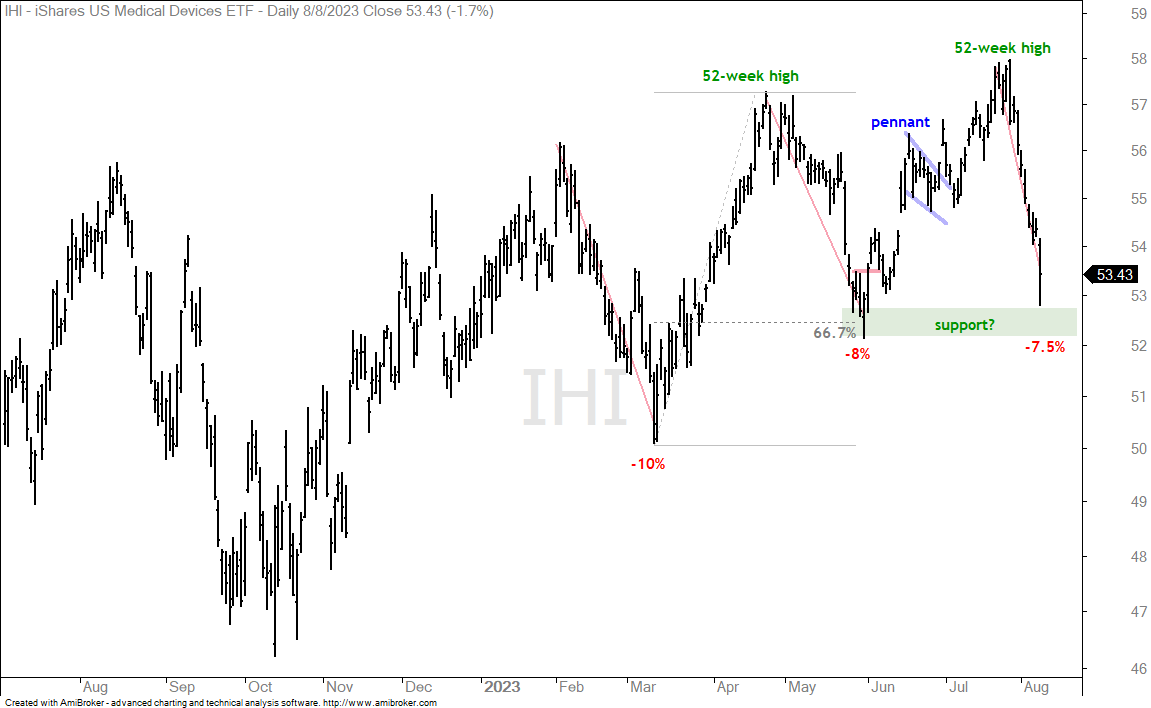
Recent swings in the Medical Devices ETF (IHI) and Medical Equipment ETF (XHE) reflect volatility and the lack of trends in certain groups. Think XLV, XLU, XLP and PBJ. IHI and XHE are down over 7% in the last ten days. These ETFs are very oversold and there are mean-reversion setups on this chart. However, my best efforts at chart analysis are not bearing fruit. It is frustrating and speaks to the challenges since January 2022. The chart below shows IHI tagging a new high in late July and then falling back to the June lows. An overall uptrend is still possible because IHI has yet to break the prior low. This area also marks potential support and the ETF is very oversold.
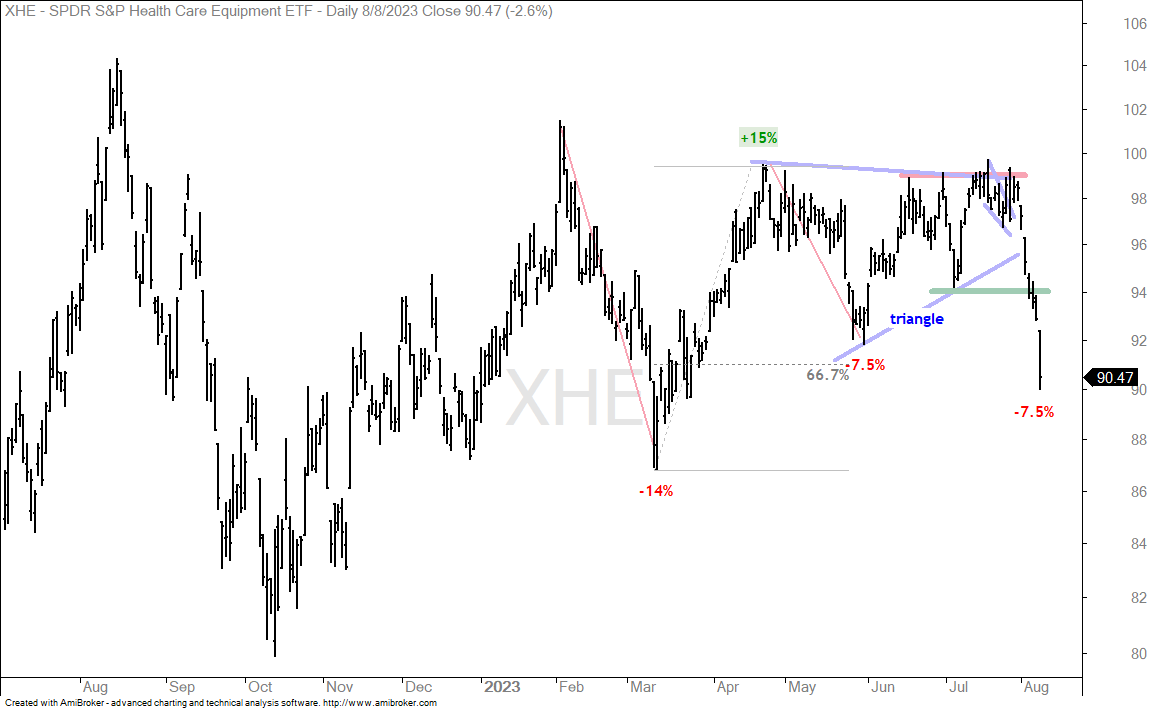
The next chart shows XHE with a triangle and pennant, both of which failed miserably. XHE fell 7.5% the last two weeks and broke its June low. The positive is the oversold condition that could give way to a mean-reversion bounce.