%Above 200-day SMA Indicators Reflect a Mixed Market
%Above 50-day SMA has Yet to Become Oversold
SPY Remains in Pullback Mode
QQQ Pops within Downswing
Mid-caps and Small-caps are Struggling (MDY, IWM)
Regional Bank and Retail ETFs Continue Lower (KRE, XRT)
Home Construction ETF Breaks Short-term Support (ITB)
Semis Sink (SOXX)
Software ETF Gets Oversold Bounce at Support (IGV)
Cybersecurity ETF Follows Other Tech ETFs (CIBR)
Aerospace & Defense ETF Fails to Hold Pennant Break (PPA)
Infrastructure ETF Returns to Broken Resistance (IFRA)
Energy ETFs Stall after Big Moves (XLE, XES)
Healthcare SPDR Battles Breakout Zone (XLV)
The S&P 500 SPDR and Nasdaq 100 ETF fell sharply in August, but these declines look like corrections within bigger uptrends. However, the S&P MidCap 400 SPDR and Russell 2000 ETF also fell. These two, in contrast, are in long-term trading ranges and immediate downtrends. We are also seeing material weakness in Regional Banks and Retail. Even though the Composite Breadth Model remains positive, the negatives are building and September is around the corner. Historically, September is the weakest month of the year. I do not trade off fundamentals, but is also worth noting that the 10-yr Treasury Yield is above 4% and the Fed is in quantitative tightening mode. This is not a good combination.
The next report will be posted on Thursday, August 24th.
Weight of Evidence Bullish but CBM Slips
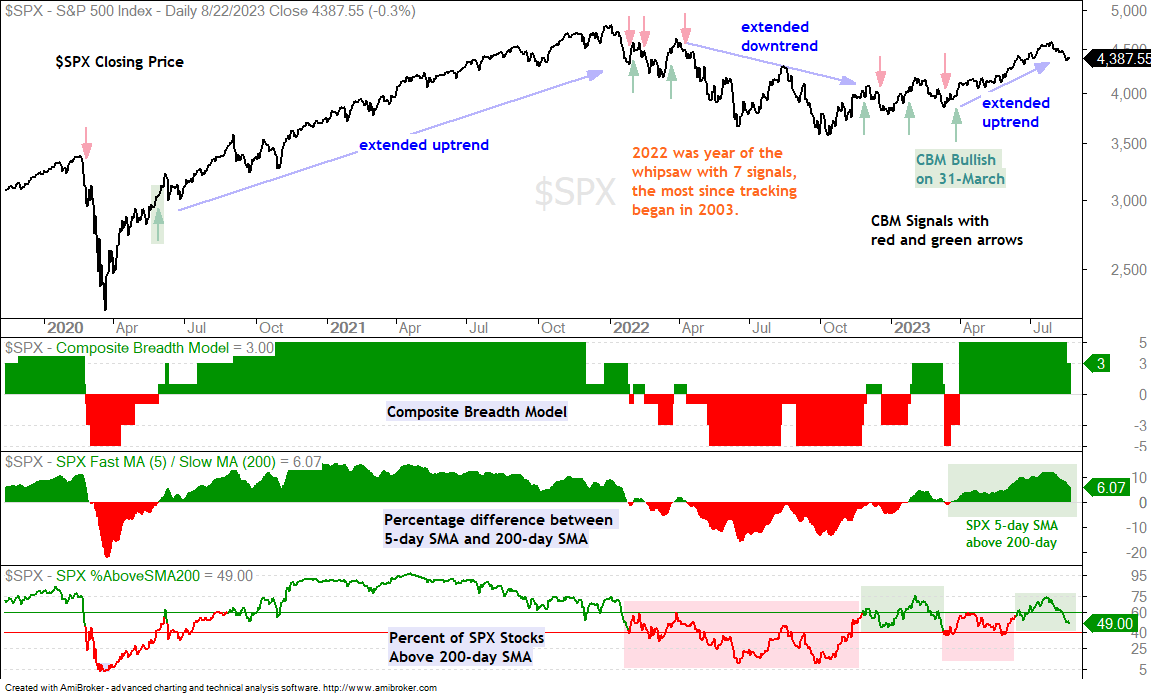
The weight of the evidence remains bullish for stocks, but the CBM slipped to +3 as the S&P 500 Thrust Model turned bearish. Also note that only 49% of S&P 500 are above their 200-day SMAs.
%Above SMA Indicators Reflect a Mixed Market
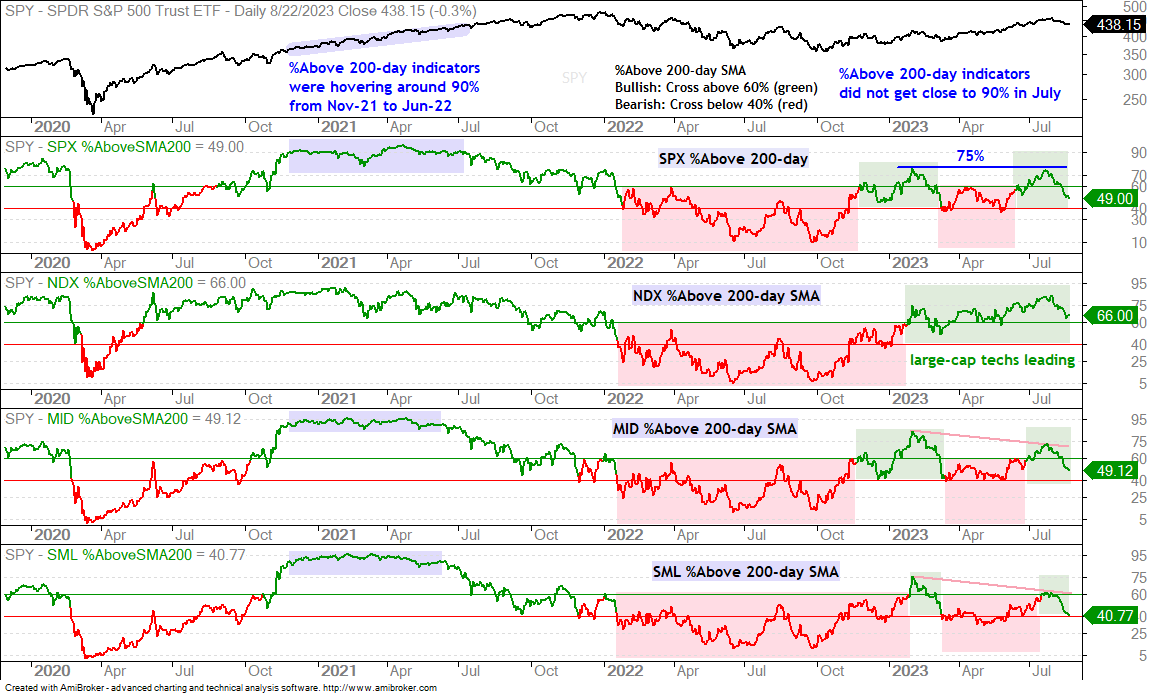
The market has gone from a selective bull market to a mixed market. The percentage of stocks above the 200-day SMA indicators were above 60% in July. NDX %Above 200-day, SPX %Above 200-day and MID %Above 200-day were even above 70%. All fell in August and only one is above 50% (NDX %Above 200-day is at 66%). S&P 500 (49%) and S&P MidCap 400 (49%) stocks are mixed. Small-caps (40.77%) are the weakest with some 60% of components below their 200-day SMAs. Also notice that MID %Above 200-day and SML %Above 200-day formed bearish divergences from January to July (red lines). There are clear signs of deterioration within the stock market and this is not a good sign as we head into September. See here for Friday’s report on seasonal patterns.[1]
%Above 50-day SMA has Yet to Become Oversold
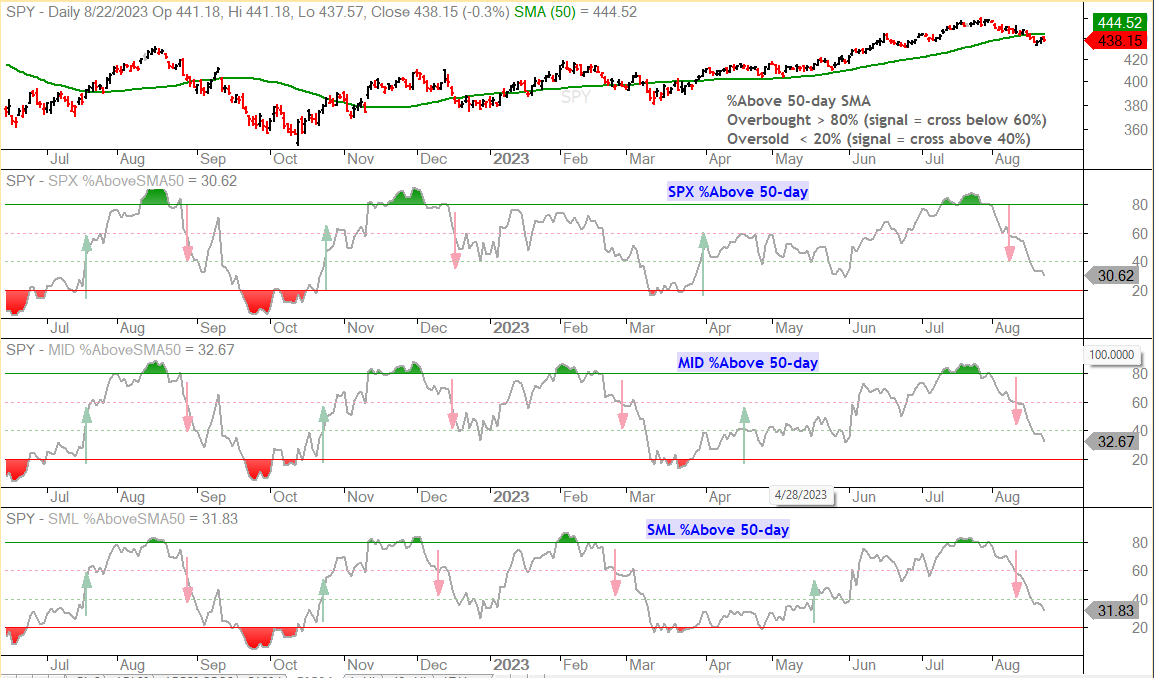
The next chart shows the percentage of stocks above the 50-day SMA for the S&P 500, S&P MidCap 400 and S&P SmallCap 600. I am not showing NDX %Above 50-day SMA because this index has only 100 stocks and they are homogenous. The S&P 500, in contrast, is a diverse index with representatives from every sector. %Above 50-day becomes oversold with a move below 20% and triggers bullish with a subsequent move above 40% (green arrows). The indicator becomes overbought with a move above 80% and triggers bearish with a move below 60% (red arrows). The signals are fairly good and the current signal is bearish. These indicators have yet to become oversold. And SPY remains below its 50-day (green line on chart).
SPY Remains in Pullback Mode
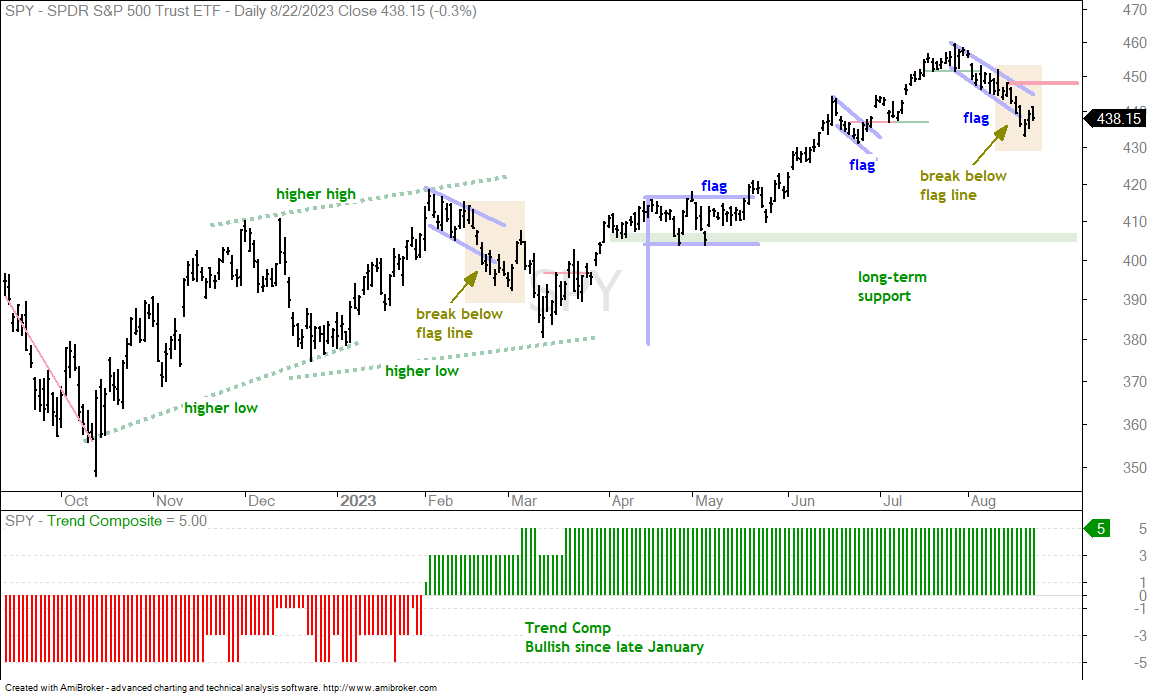
I am seeing some parallels between the current pullback and the February-March pullback. SPY started down in February and it looked like a falling flag was forming. SPY then fell sharply, broke the lower line of the flag and rebounded with a three day pop in March (yellow shading). This pop did not last long as SPY fell into mid March. The current flag looked normal until SPY fell sharply and broke the lower line on 17-Aug. The four day decline (15-18 Aug) created a short-term oversold condition and SPY popped the last three days. This could be an oversold pop before another leg lower. Note that another leg lower would likely push the %Above 50-day SMA indicator into oversold territory. Overall, the short-term trend remains down for SPY and I am marking resistance at 448. A close above this level would reverse the downswing.
QQQ Pops within Downswing
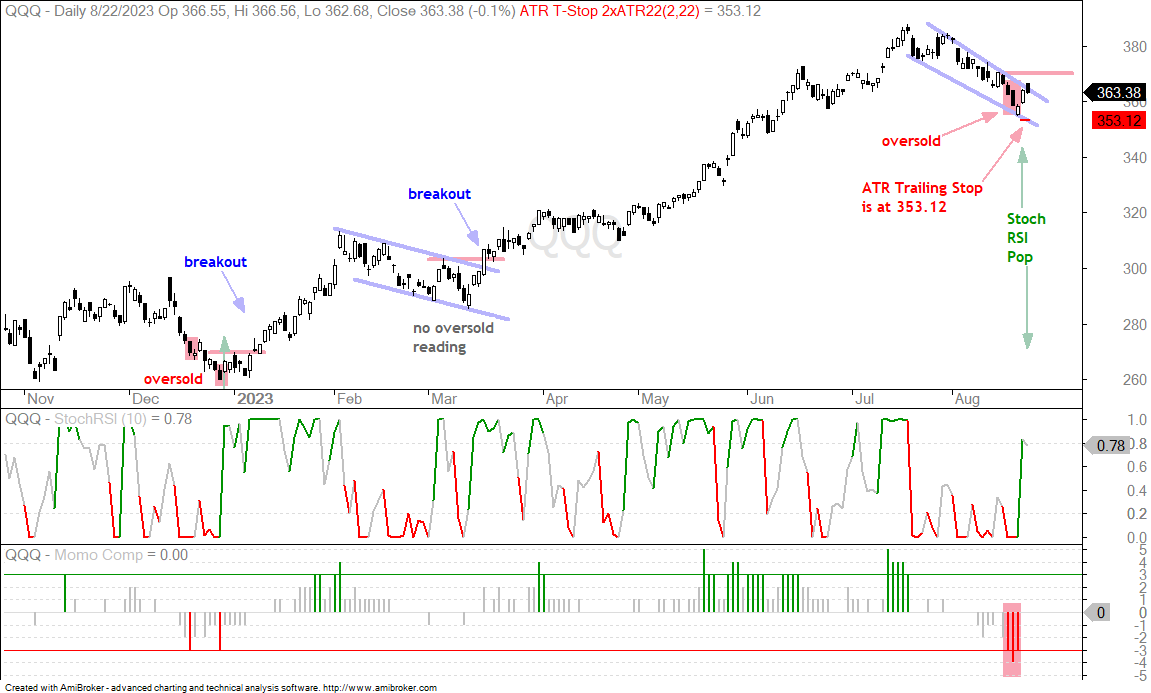
The next chart is from Tuesday’s report[2] where I used the Momentum Composite, StochRSI and the ATR Trailing Stop. The Momentum Composite identified oversold conditions with a move to -3 or lower. StochRSI signals a short-term momentum pop with a surge above .80. The ATR Trailing Stop is part of the trade management. Note that the StochRSI pop is often the early signal and this means it is also the most prone to whipsaws (bad signals). QQQ is still in a short-term downtrend and has yet to follow through on the StochRSI pop. The ETF surged 1.6% on Monday, but did the old pop and drop on Tuesday early gains faded. Short-term resistance is set at 371 and a close above this level is needed to fully reverse the short-term downtrend.
Mid-caps and Small-caps are Struggling
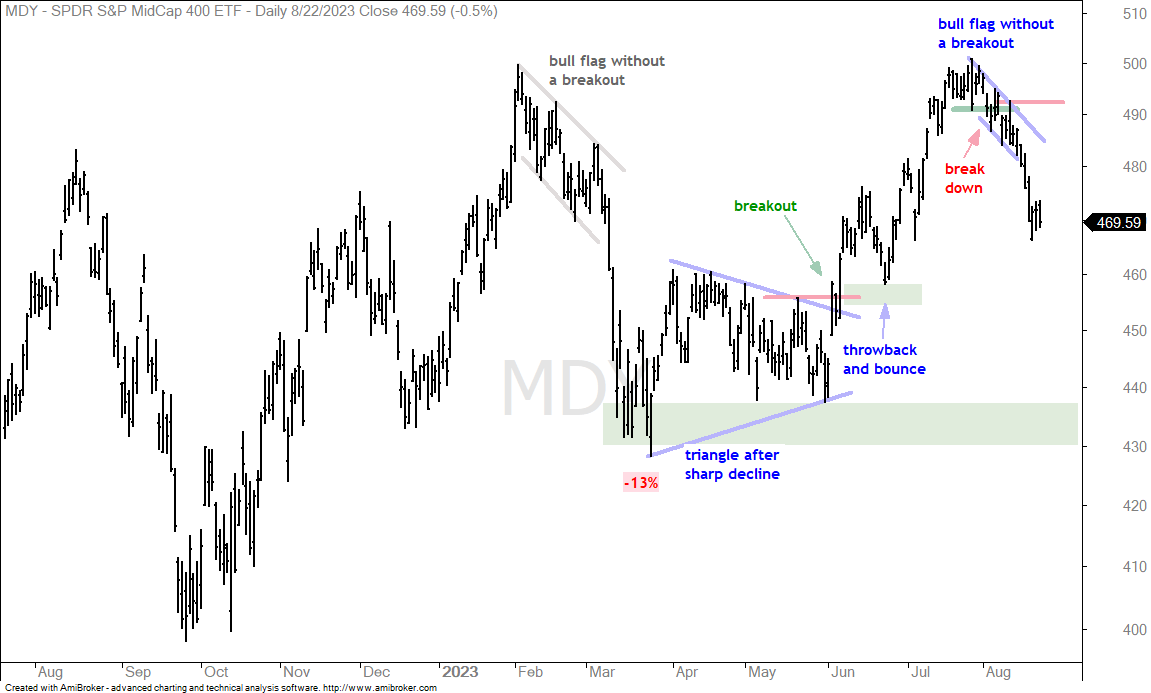
The next chart shows the S&P MidCap 400 SPDR (MDY) with four double digit swings since mid August 2022. The ETF is flat over the last 12 months and up slightly year-to-date. There is perhaps an upward bias since the September-October lows, but the swings really matter. The current swing is down with the support break in early August. A bull flag took shape into early August, but MDY never broke out (just as in February-March). The decline accelerated from August 10th to 17th and the March-June lows mark the next support zone.
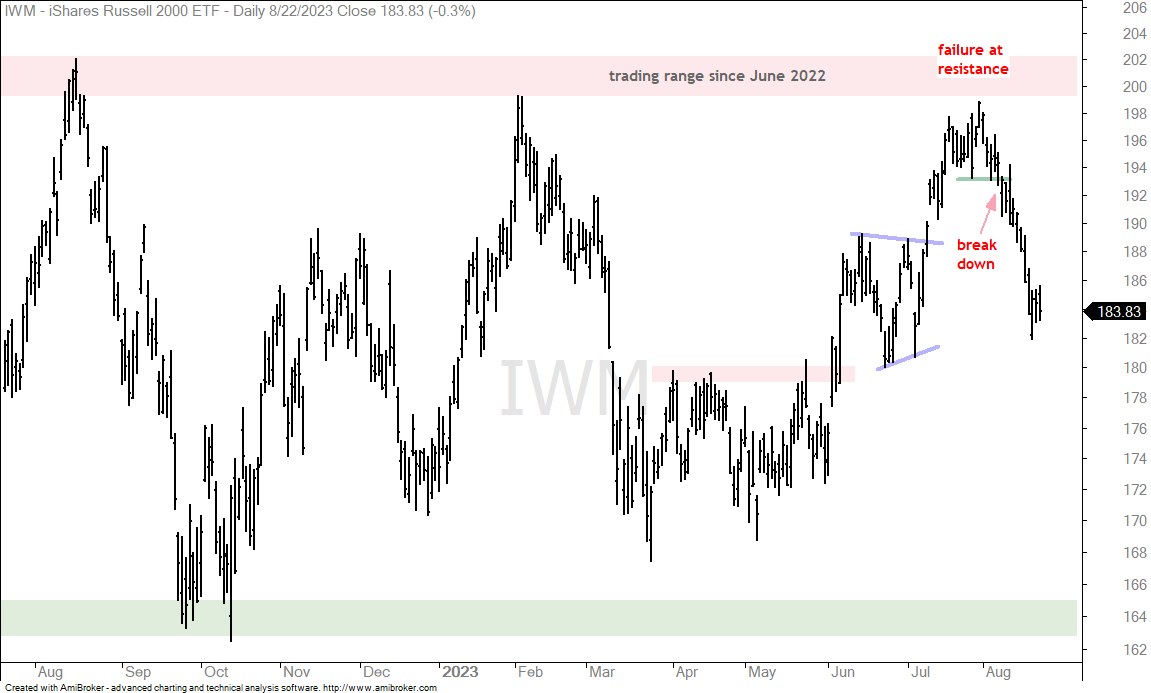
The next chart shows the Russell 2000 ETF (IWM) hitting resistance in early August and breaking short-term support a week later. There is no long-term trend on this chart and the short-term swing is clearly down. IWM became oversold last week and firmed the last few days, but is struggling to bounce.
Regional Bank and Retail ETFs Continue Lower (KRE, XRT)
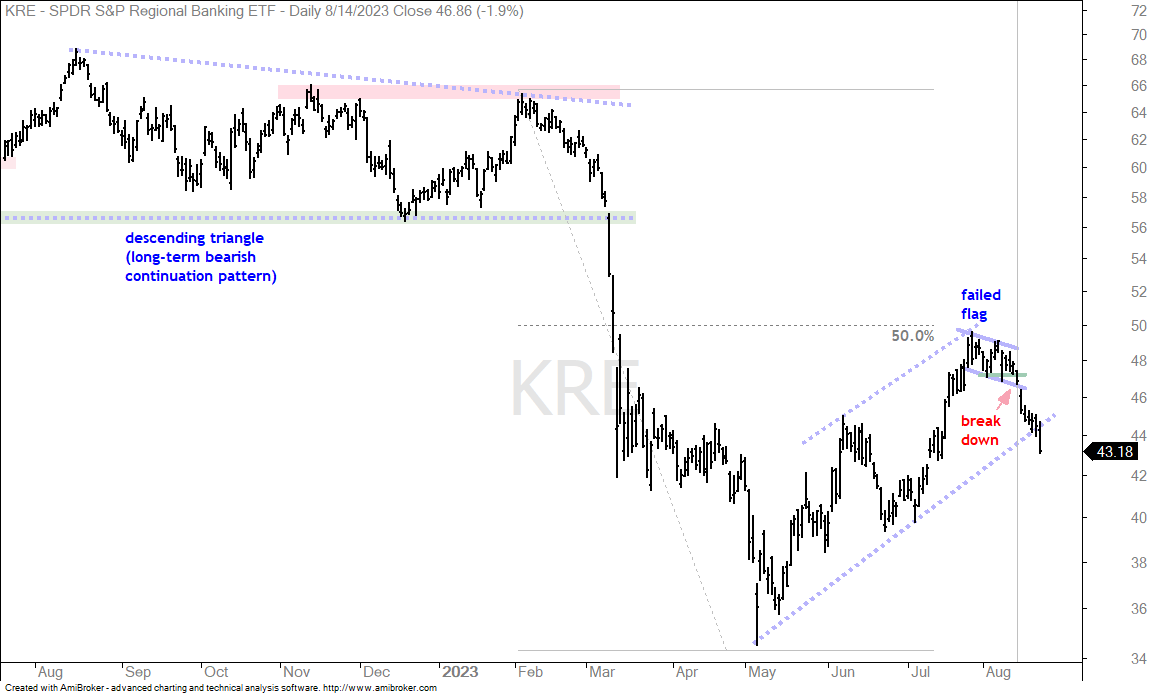
The Regional Bank ETF (KRE) provides clues on the state of the domestic (US) financial system and the Retail SPDR (XRT) reflects retail spending. These two groups are associated with mid-caps and small-caps, which also reflect the domestic (US) economy. The first chart shows KRE hitting the 50% retracement and breaking short-term support on August 14th. The ETF continued lower and broke the channel line this week. Overall, the bounced from May to July looks like a counter-trend move and the channel break signals a continuation of the bigger downtrend. No good.
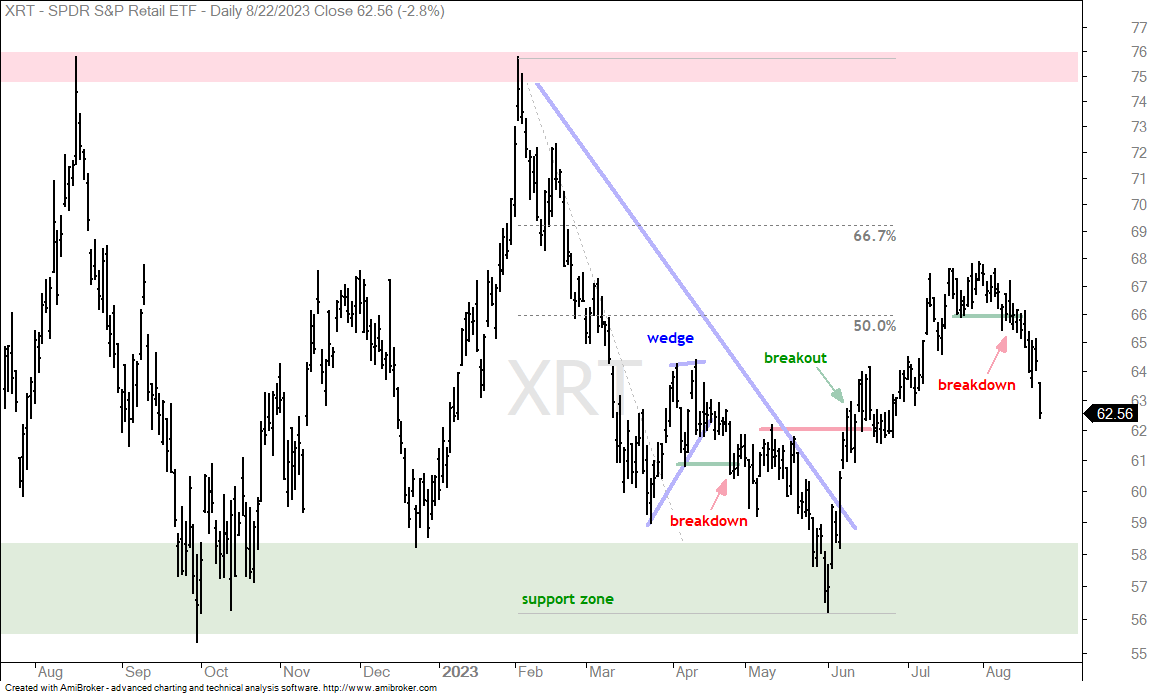
The next chart shows XRT retracing 50-67% of its prior decline, stalling and breaking short-term support in early August. Again, it is a market of swings, not trends. This breakdown reverses the upswing and next support is in the upper-mid 50s. Note that XRT fell sharply the last five days and this is also a negative for the broader market.
Home Construction ETF Breaks Short-term Support (ITB)
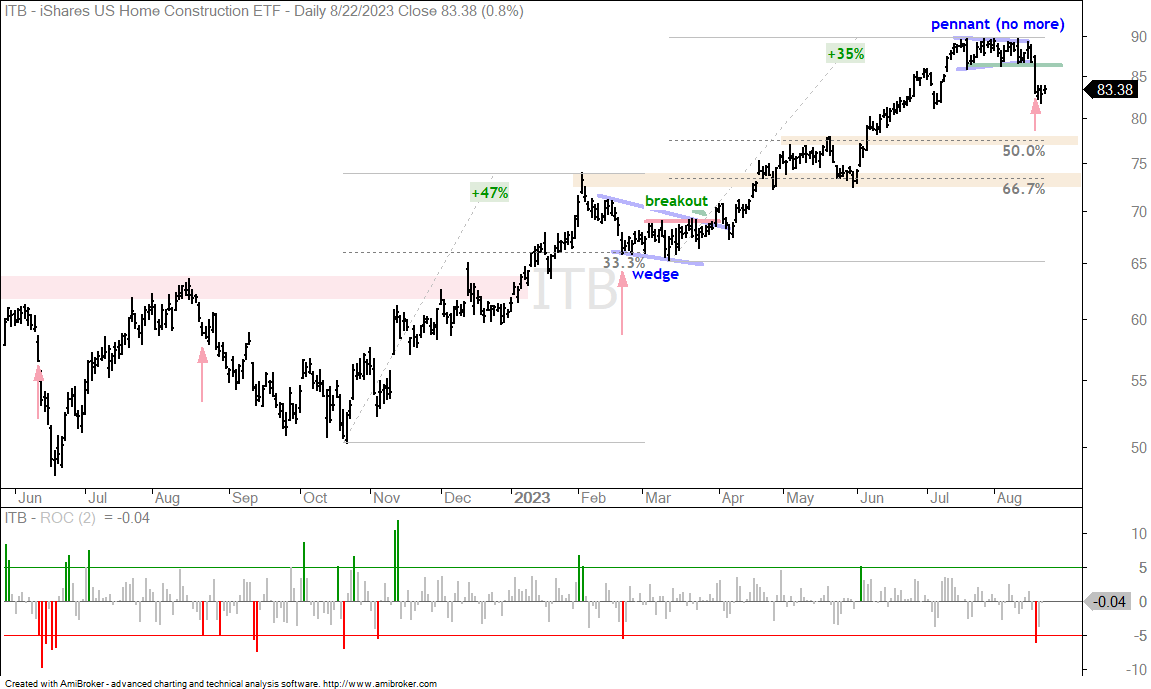
The Home Construction ETF (ITB) broke short-term support with a 5+ percent decline in two days. The long-term trend is still up, but similar declines marked the beginning of a pullback or corrective period. The red arrow in mid August 2022 shows a 2 day 5+ percent decline starting the pullback into September. The 2 day 5+ percent decline in late February (red arrow) preceded a correction into mid March. Should the current outsized decline signal the start of a correction, I would target a move to the 50-67% retracement zone (mid 70s)
Semis Sink (SOXX)
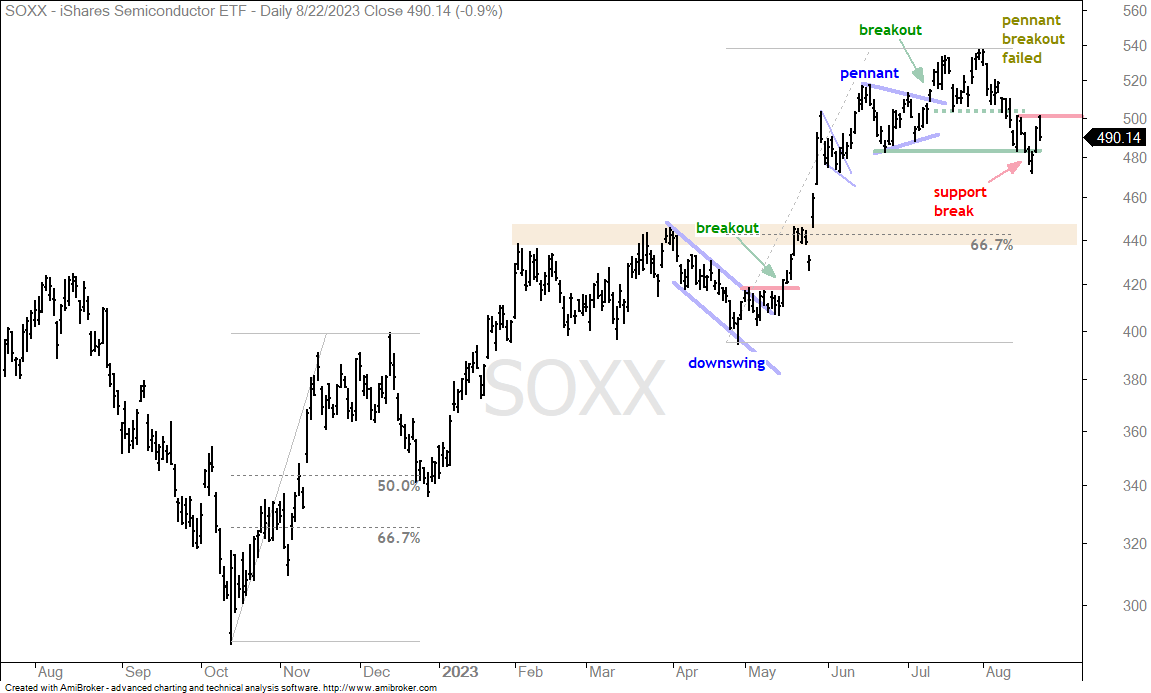
The next chart shows the Semiconductor ETF (SOXX) with a failed pennant and a support break. The ETF broke pennant resistance in mid July and stalled above the breakout zone for a few weeks. It then fell sharply in August and broke the July low. There was an oversold bounce the last three days, but SOXX failed at 501 with a pop and drop on Tuesday. A close above 501 is needed to reverse the short-term downtrend. Barring a breakout, the next target is the 440 area. Broken resistance, which turns next support, and the 67% retracement line mark this zone.
Software ETF Gets Oversold Bounce at Support (IGV)
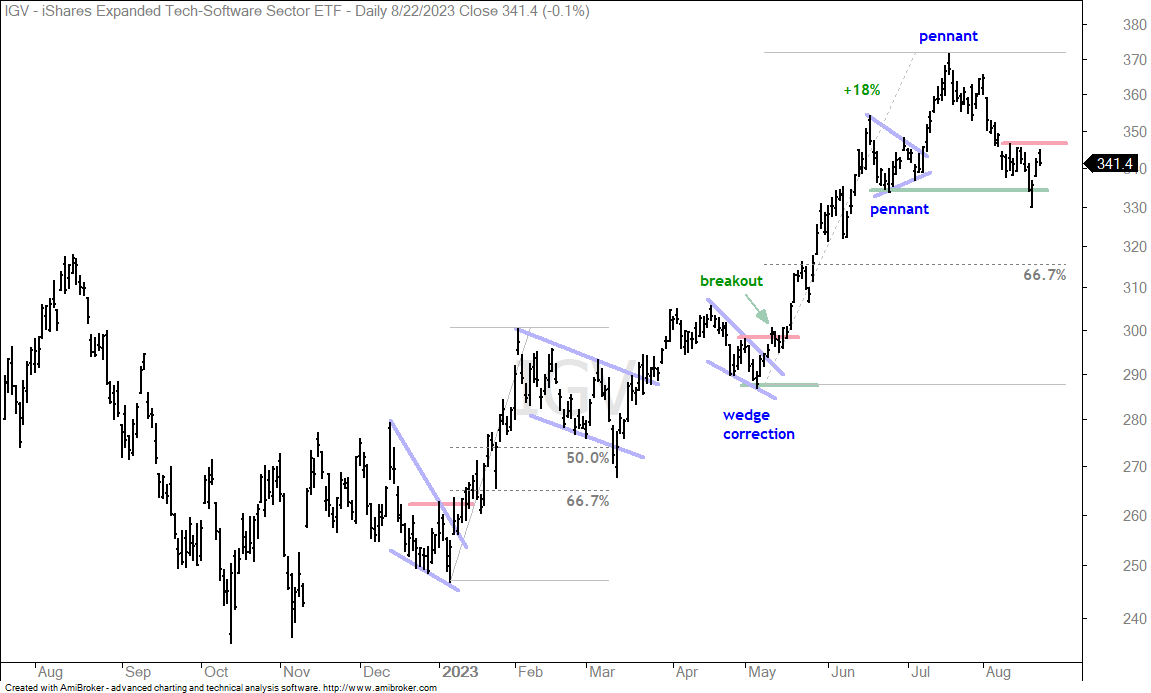
The next chart shows the Software ETF (IGV) falling to support from the pennant low and getting an oversold bounce. IGV also did the pop and drop on Tuesday and this affirms short-term resistance at the mid August highs (347). A follow through breakout is needed to reverse the short-term downtrend. Barring a breakout, the next stop is the 67% retracement line around 315.
Cybersecurity ETF Follows Other Tech ETFs (CIBR)
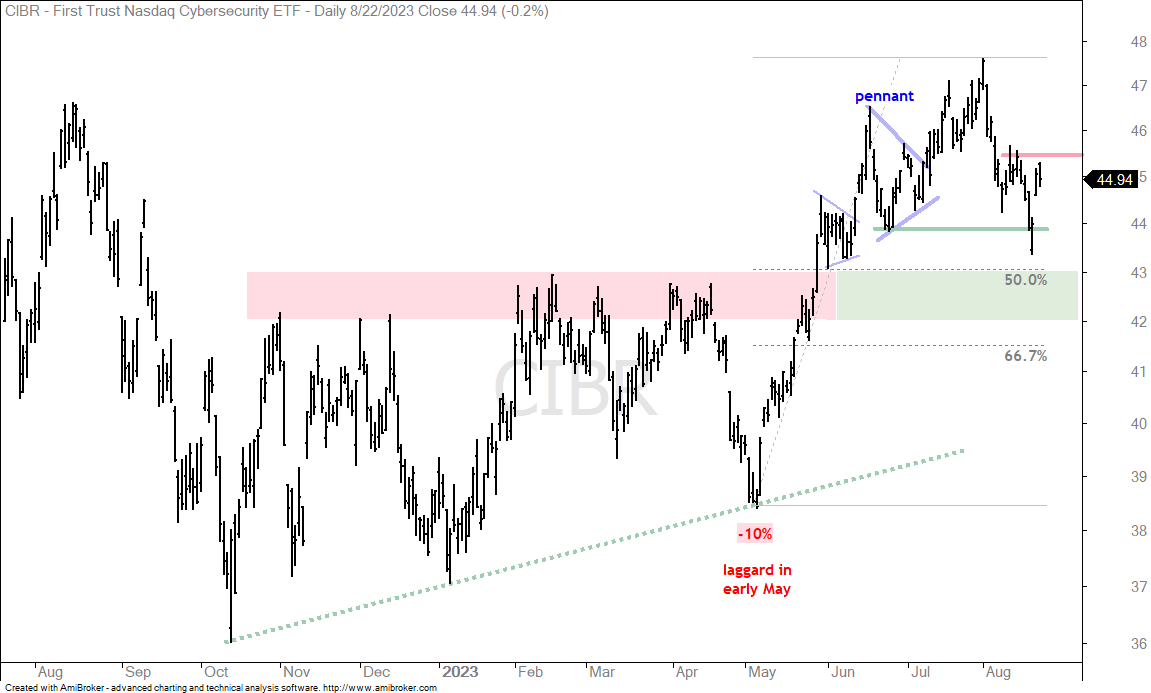
The next chart shows the Cybersecurity ETF (CIBR) with a 52-week high on August 1st and a 7.5% decline the next 12 days. The depth and speed of the decline is a concern because it shows strong selling pressure and downside momentum. A normal correction or pullback would be less volatile and steep. CIBR also got an oversold bounce, but the short-term downtrend remains and a follow through breakout at 45.5 is needed for a reversal. Barring a breakout, the next support zone is in the 42-43 area.
Aerospace & Defense ETF Fails to Hold Pennant Break (PPA)
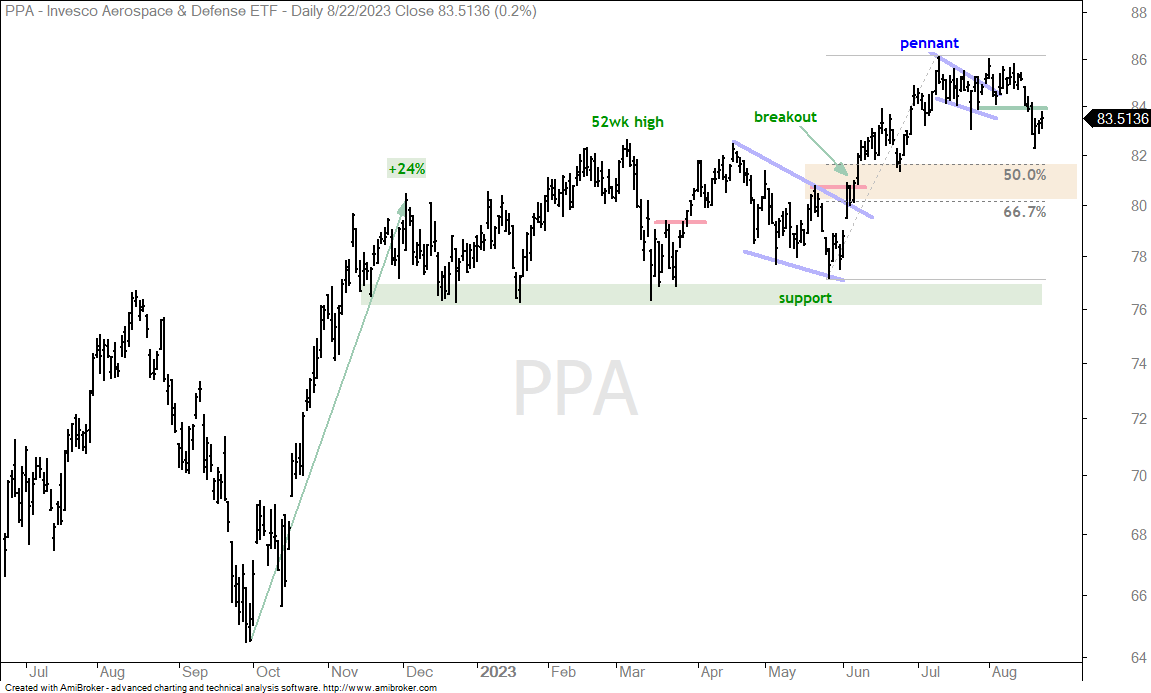
Very few stocks and stock-related ETFs are immune to broad market weakness. The Aerospace & Defense ETF (PPA) is less correlated to the economy than the Retail SPDR (XRT), but it is still part of the stock market. PPA is still in a long-term uptrend. The pennant breakout failed to hold as PPA fell below the pennant lows. I still consider this a pullback within a bigger uptrend. The breakout zone and 50-67 percent retracements mark next support in the 80-82 area.
Infrastructure ETF Returns to Broken Resistance (IFRA)
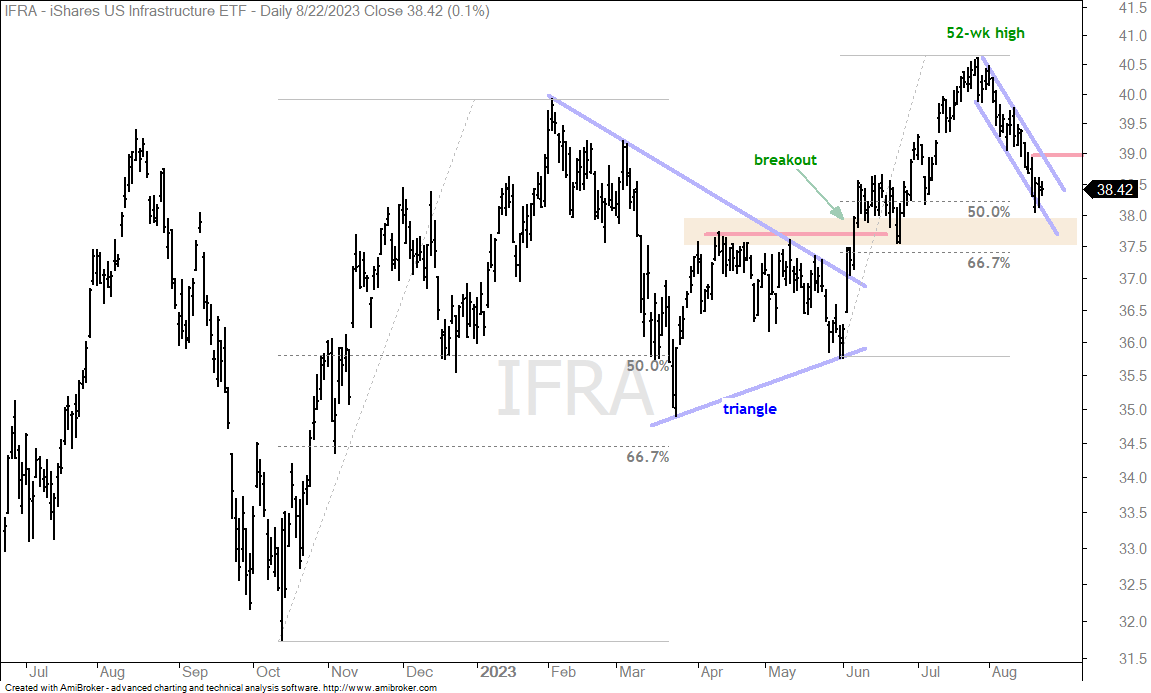
The Infrastructure ETF (IFRA) comprises Utilities (37.4%), Industrials (32.81%), Materials (19.48%) and Energy (8.71%). Utilities are in the dumps, while Materials and Industrials pulled back with the market in August. Energy held up relatively well. The chart shows IFRA with a 52-week high in late July and a 6% decline the next few weeks. This decline returned to broken resistance, which turns first support. The decline also retraced 50-67 percent of the prior advance. These are normal characteristics for a pullback within an uptrend. I am marking short-term resistance at 39 and a breakout here would be bullish.
Energy ETFs Stall after Big Moves (XLE, XES)
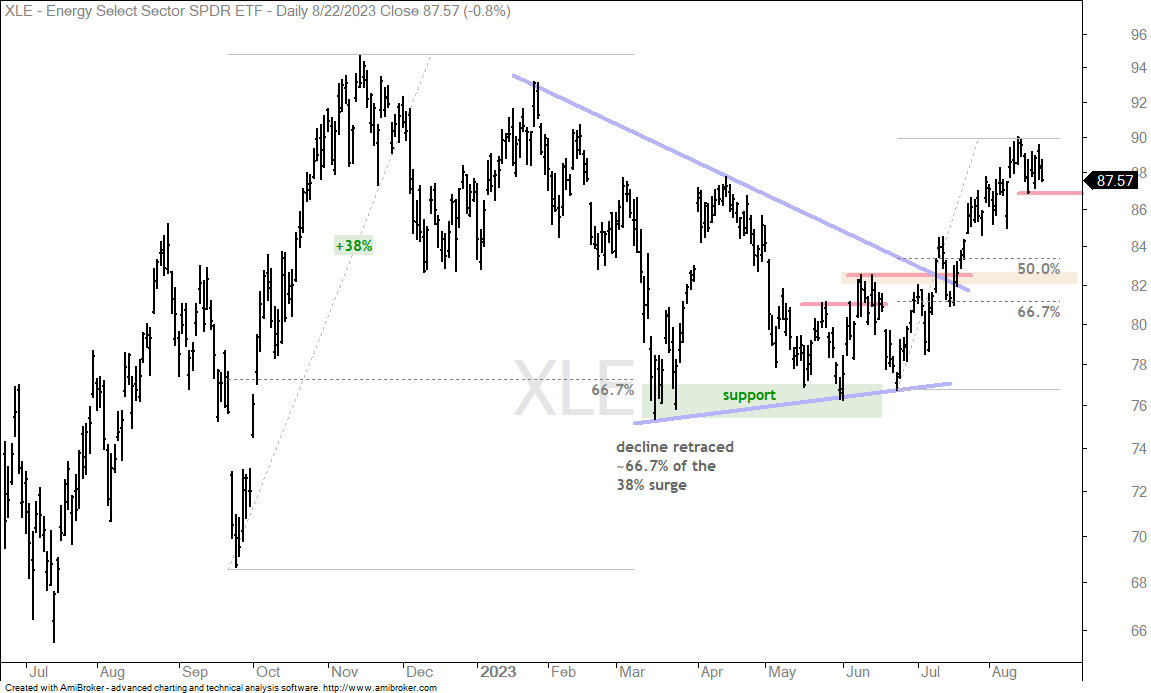
The next chart shows the Energy SPDR (XLE) breaking out of a large triangle and advancing to around 90. The breakout is bullish, but XLE is looking extended short-term. Note that XLE is the only sector SPDR showing a gain here in August. The ETF stalled for a week or so and established short-term support at 87. A close below this level would reverse the short-term upswing and argue for at least a retracement of the June-August advance. The target zone is 82.
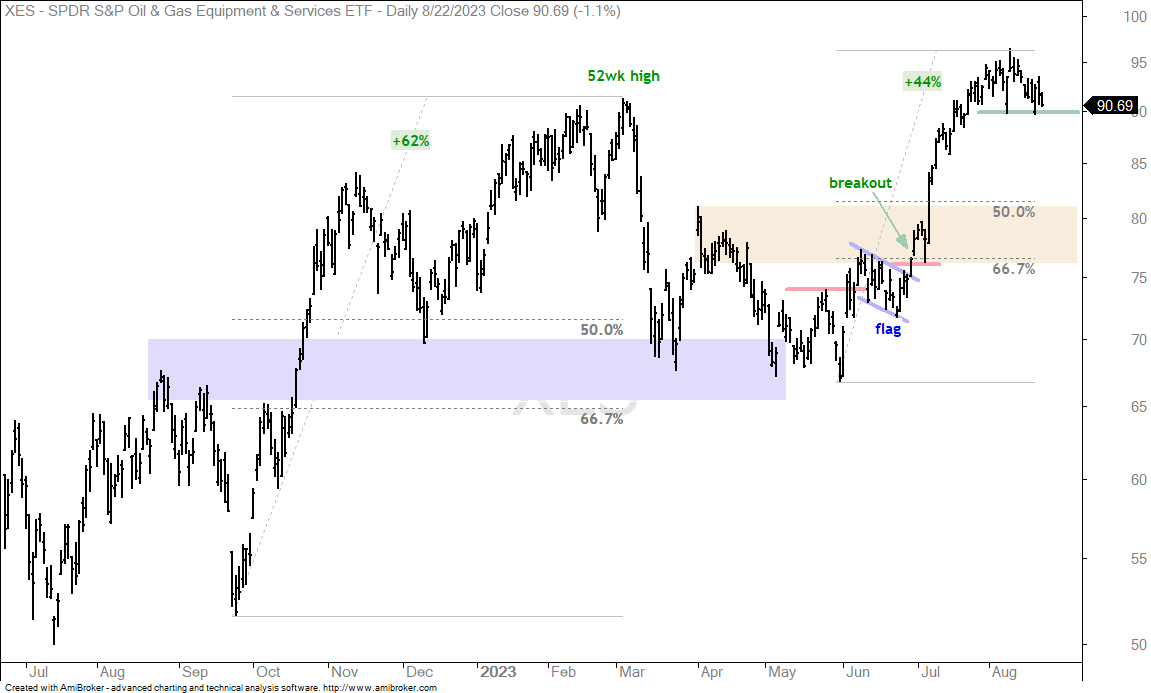
The next chart shows the Oil & Gas Equipment & Services ETF (XES) with a 44% surge and a stall above 90. A close below support at 90 would argue for a pullback with the target zone in the 75-80 area.
XLV Battles Breakout Zone
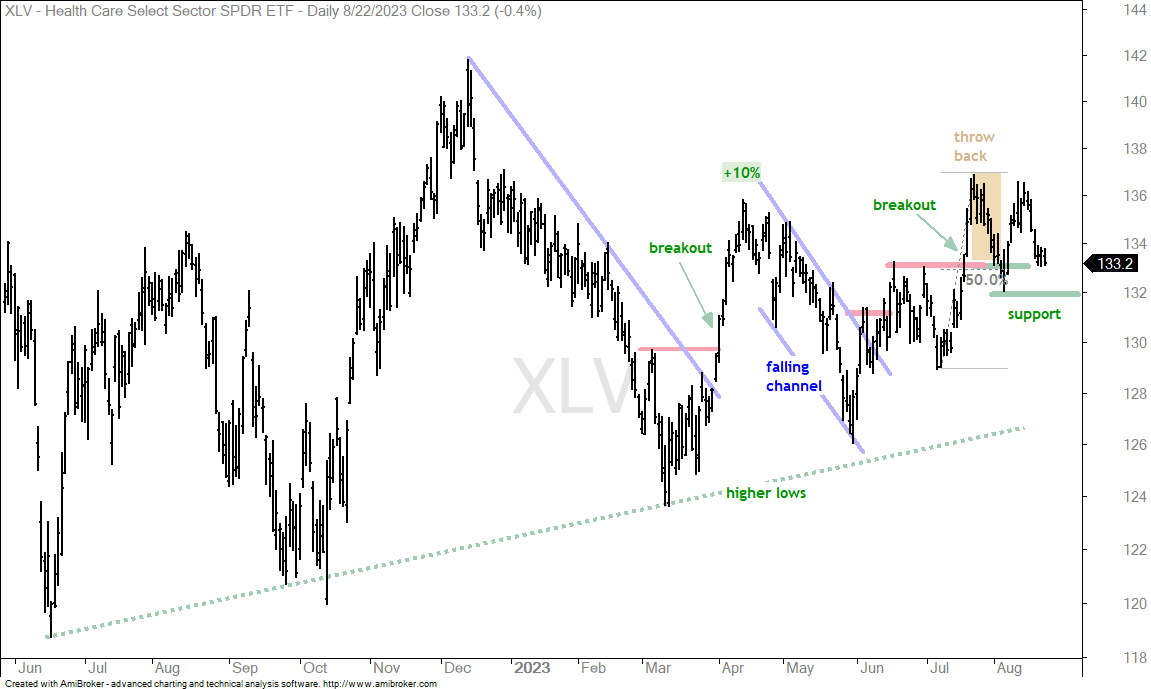
The Healthcare SPDR (XLV) is the second best performing sector in August (smallest loss). It is only down .71% month-to-date. Note that the Technology SPDR (XLK) and Consumer Discretionary SPDR (XLY) are down over 5% in August and showing relative weakness. XLV shows relative strength, but it is not always immune to broad market weakness. The chart shows XLV with a choppy upward sloping range since June 2022. The swing within this range is up after the breakouts in June and July. Broken resistance turns into support and the ETF affirmed support with a bounce in mid August. I am leaving support at 132 and a break here would reverse the upswing.