Stocks became quite oversold in mid June and bounced over the last five days. These bounces are strong in percentage terms, but still considered bear market bounces. Today’s report will start with the Composite Breadth Model and BBB spreads. We will then put the SPY bounce into perspective and identify the resistance-reversal zone ahead. Attention then turns to oil and related ETFs as they setup bullish. Agriculture ETFs bore the brunt of recent selling pressure and DBA broke down. We close with an update and ATR Trailing Stop for the oversold bounces in XBI, ICLN and LIT.
About the ETF Trends, Patterns and Setups Report
This report contains discretionary chart analysis based on my interpretation of the price charts. This is different from the fully systematic approach in the Trend Composite strategy series. In this ETF Trends, Patterns and Setups report, I am looking for leading uptrends and tradable setups within these uptrends. While I use indicators to help define the trend and identify oversold conditions within uptrends, the assessments are mostly based on price action and the price chart (higher highs, higher lows, patterns in play). Sometimes the chart assessment can be at odds with the indicators.
This Week's Commentary Schedule
Tuesday – 29 June: Market-ETF Report and Signal-Rank Table Update
Wednesday – 30 June: Market-ETF Video and Market Regime Update
Thursday – 1 July: Market-ETF Report and Signal-Rank Table Update
Saturday – 3 July: ETF Signal and Rank Table
Breadth Model Negative and Yield Spreads Elevated
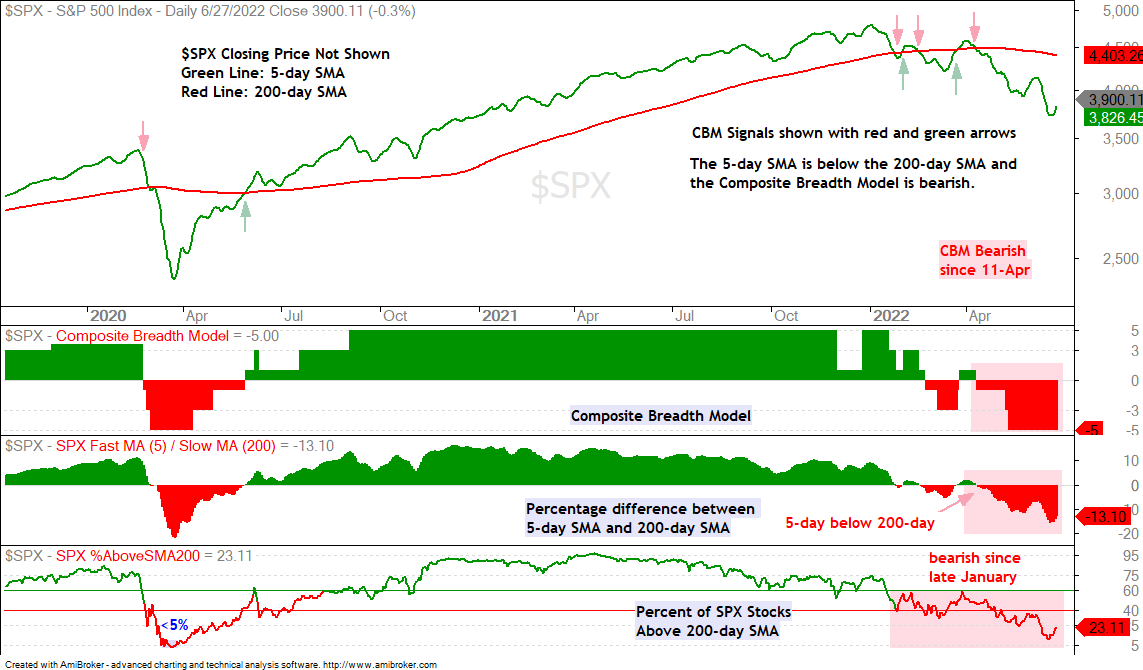
Stocks bounced the last five days, but these bounces are considered counter-trend moves within bigger downtrends. One of these counter-trend moves will result in a trend reversal, but this is not the case yet because the weight of the evidence remains bearish for stocks. The first indicator window below shows the Composite Breadth Model at -5 (bearish), the middle window shows the S&P 500 5-day SMA well below the 200-day SMA and the bottom window shows fewer than 25% of S&P 500 stocks above their 200-day SMAs. This is not a bullish configuration.
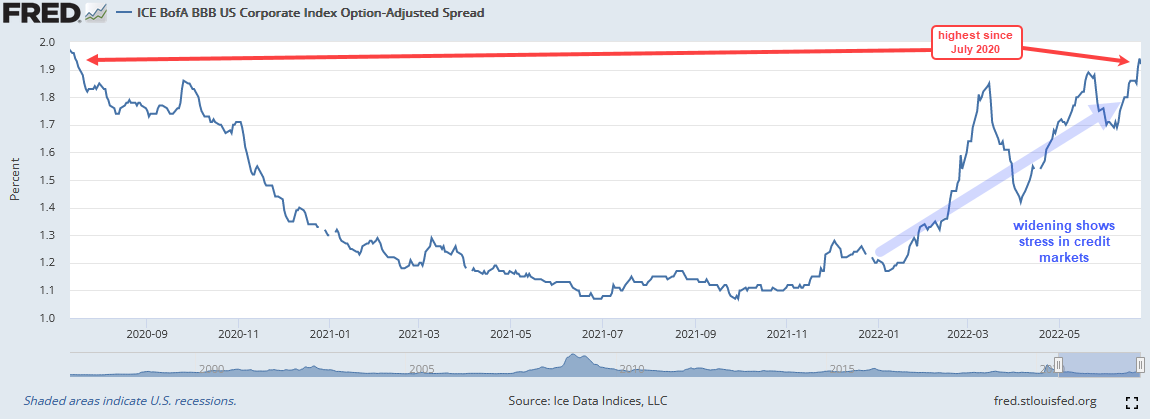
Further more, yield spreads remain elevated. In fact, the second chart shows the BBB spread exceeding its March high last week with a move above 1.9, the highest level since July 2020. The Market Regime charts will be updated tomorrow.
Bear Market and Above Average Volatility
The Market Regime is bearish and this means risk is above average in the stock market. Risk is also above average elsewhere because volatility is high across the board, especially in commodities. Some stocks and stock-based ETFs may hold up or even buck the bear market, but it is difficult to pick winners when the majority of stocks are in downtrends. As such, exposure to stocks should be greatly reduced in a bear market. The preference is for stock alternatives that are in uptrends or that have bullish setups, but the picking here are also slim and volatility remains above average.
Big Bounces in High Beta ETFs
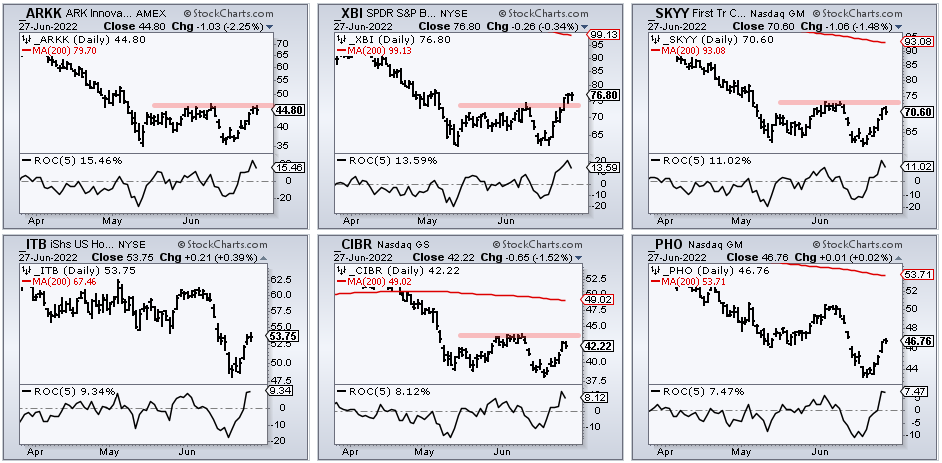
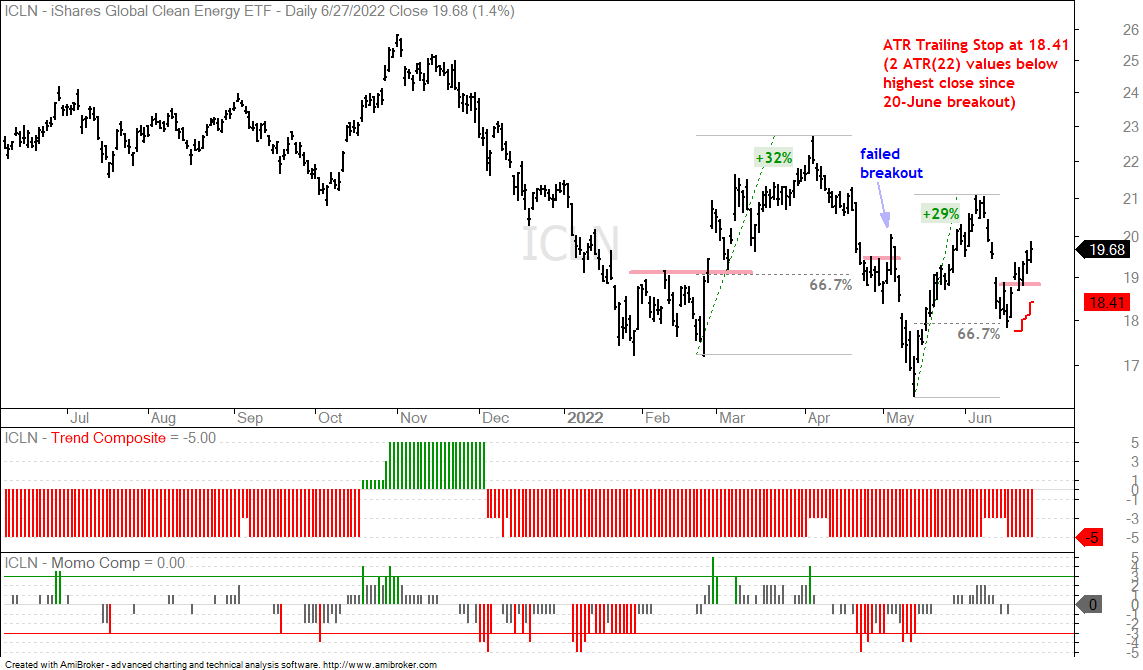
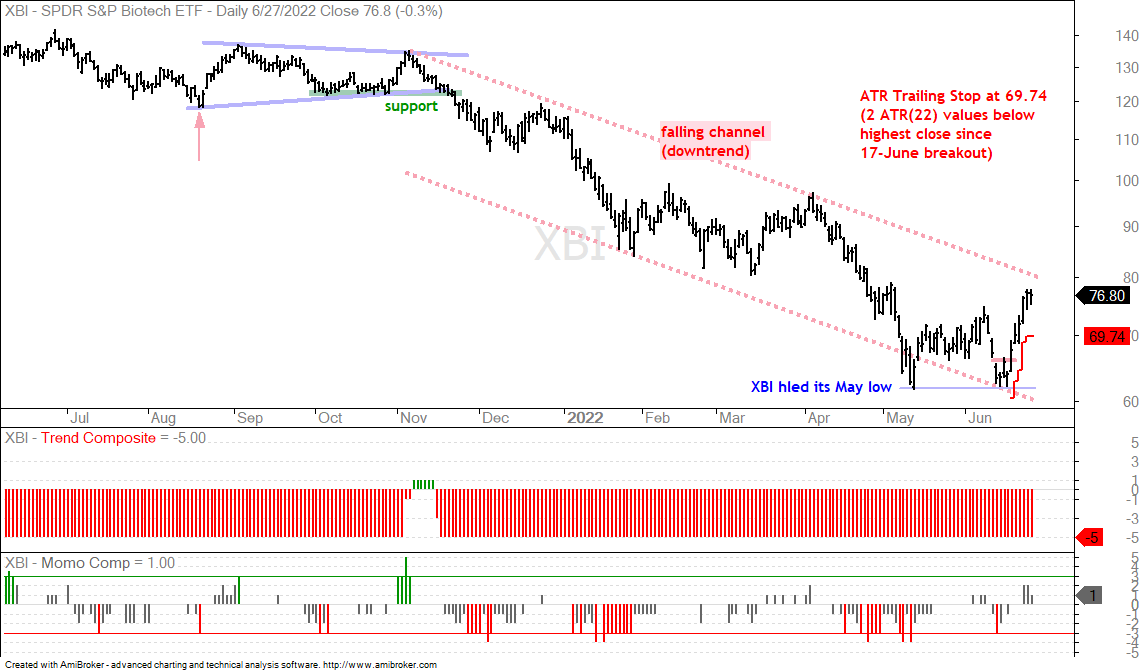
High-beta and tech-related ETFs led the oversold bounce with 10+ percent gains in ARKK, XBI and SKYY. We also saw some big bounces in housing (ITB +9.34%), cyber security (CIBR +8.12%) and water resources (PHO +7.47%). These are impressive moves, but they started at or near 52-week lows and the bigger trends are still down. The three month charts below show the 200-day SMA (red line) and 5-day Rate-of-Change in the indicator window. The 200-day is not visible on ARKK and ITB because it is well above the three month high. XBI is the leader of this group because it is the only one to break above its mid June high.
SPY Enters Resistance-Reversal Zone
SPY, QQQ, IWM
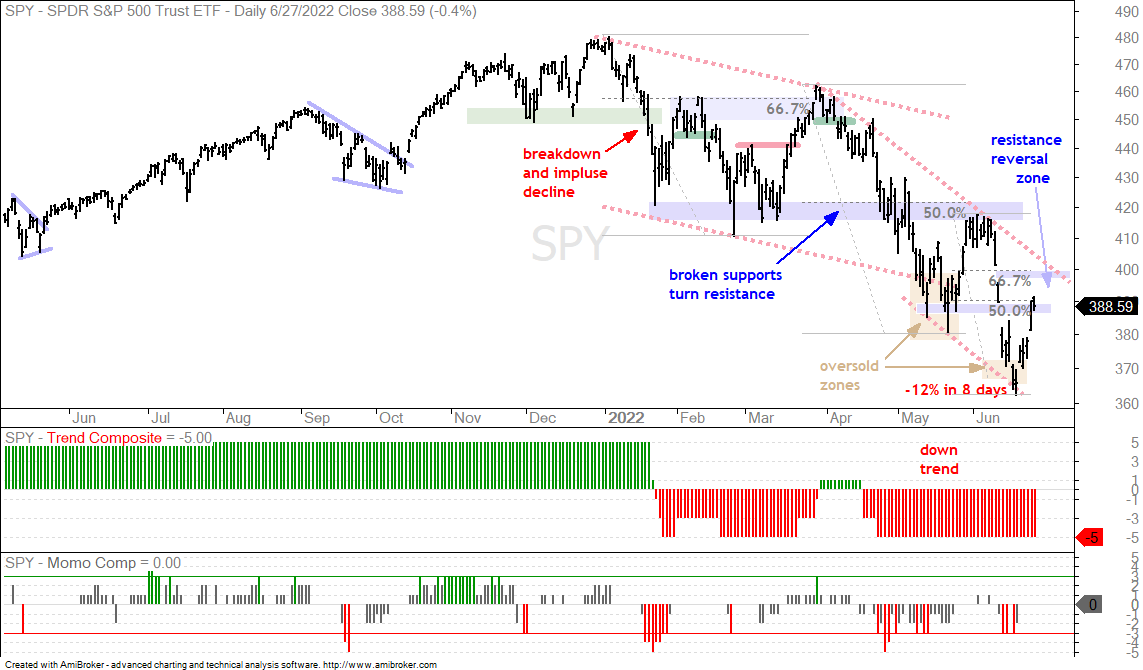
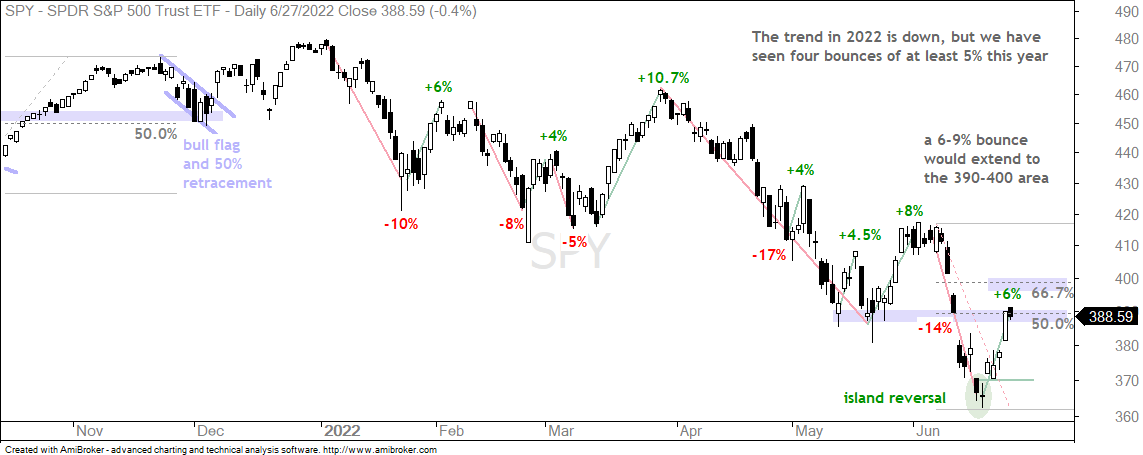
SPY surged some 6% the last five days, but is still down around 18% year-to-date (121 days). Picking the next resistance-reversal zone involves some educated guessing and this is not a precise science. Typically, a counter-trend move retraces 33 to 67 percent of the prior decline with 50% representing the base case. SPY has currently retraced 50% this is a potential reversal area.
Next, broken supports turn into resistance. SPY broke support in the 390 area and returned to this area with the current bounce. There is also the upper line of the falling channel, which is around 400 and the 67% retracement. All told, the 390-400 area represents a resistance-reversal zone for SPY. The candlestick chart below shows four 5+ percent bounces in 2022. Bear market bounces are often swift and sharp, which makes it difficult to make money shorting stocks. QQQ and IWM are also in the midst of counter-trend bounces after becoming oversold.
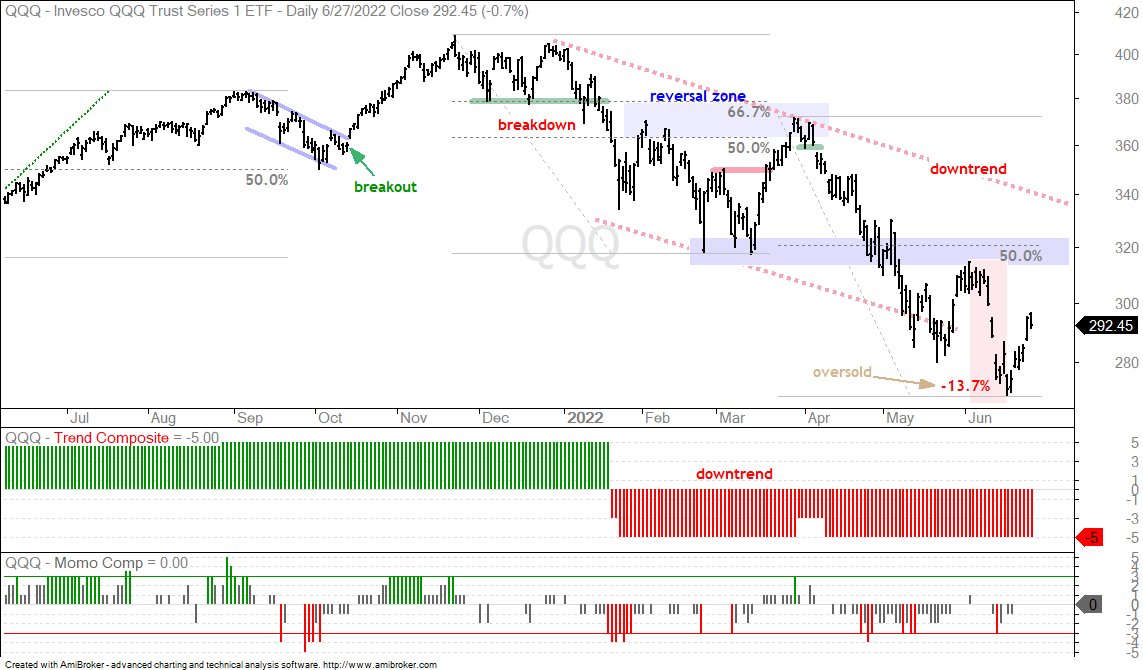
QQQ is also getting a bounce after a 13.7% decline in ten days (3 to 16 June).
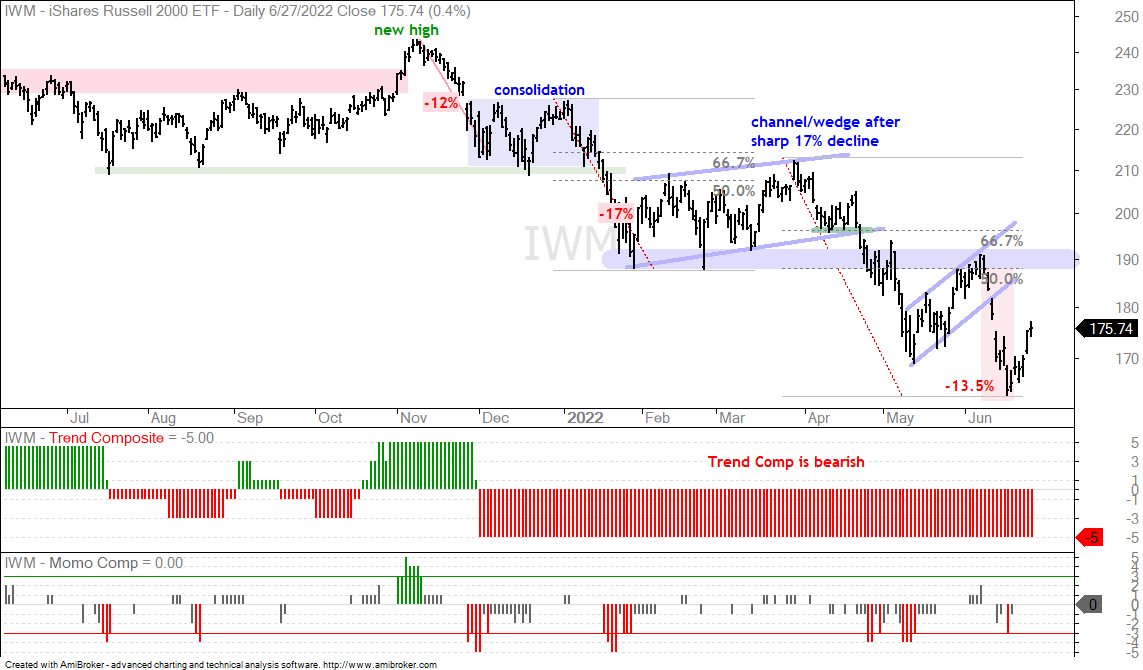
IWM is also getting a bounce after falling 13.5% the last eight days.
You can learn more about my chart strategy in this article[1] covering the different timeframes, chart settings, StochClose, RSI and StochRSI.
Oil Bounces off Support-Reversal Zone
$WTIC, DBE
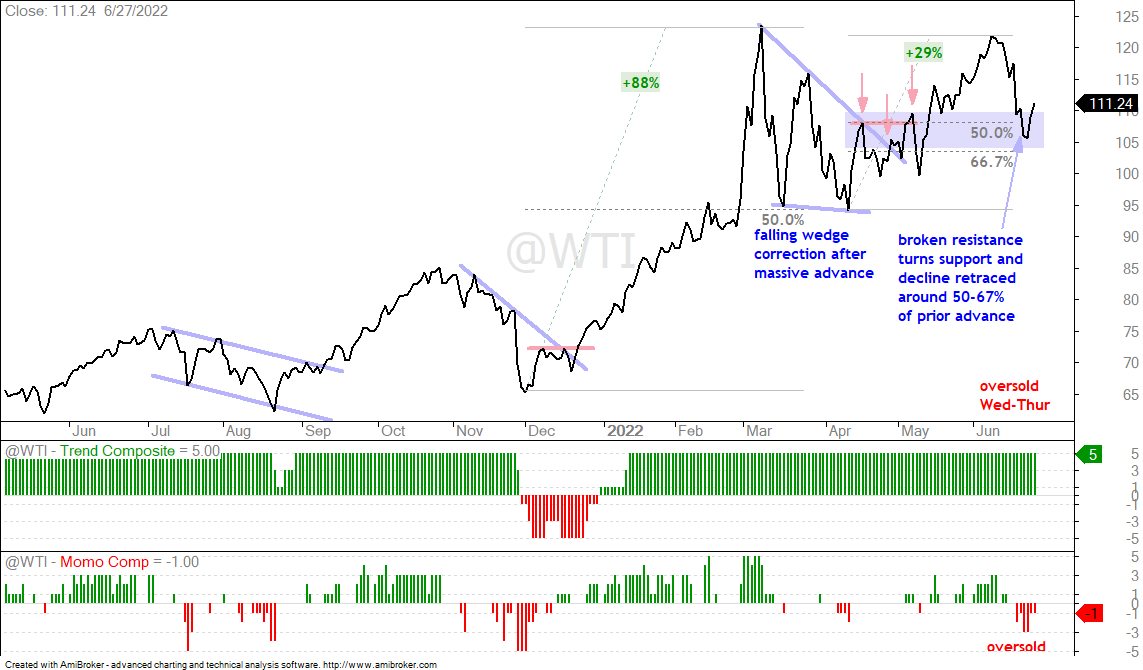
A support-reversal zone is the opposite of a resistance-reversal zone, but they have similar characteristics. A pullback after a big move higher is expected to retraced 33 to 67 percent of the prior advance with 50% representing the base case. The chart below shows West Texas Intermediate ($WTIC) surging 29% and then retracing 50 to 67 percent with the decline to around 105.
Broken resistance levels turn into support and sometimes there are multiple resistance levels. For example, the red arrows show the mid April high, the wedge line breakout and the early May high. These resistance levels combine to form a zone that marks future support and this support zone lines up with the 50-67 percent retracement zone. WTI hit this zone on Thursday and the Momentum Composite became oversold at -3. WTI surged on Friday-Monday and it looks like the pullback is ending.
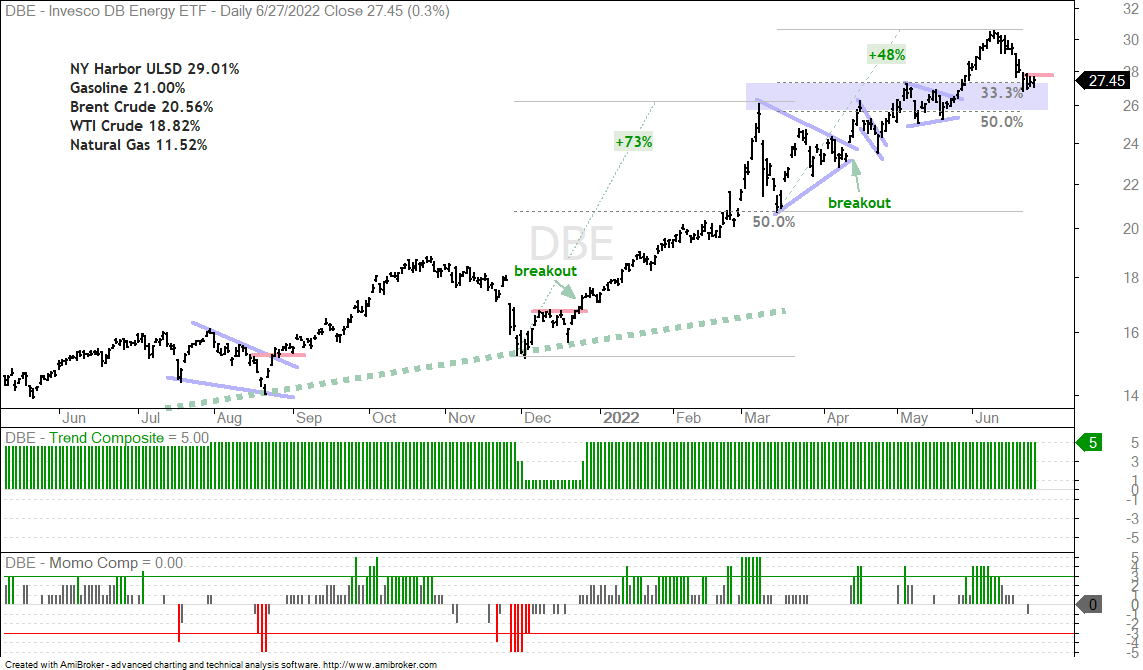
The next chart shows the DB Energy ETF (DBE) falling to the top of its support-reversal zone and firming the last few days. The ETF is not yet oversold, but this is the first area to expect a bounce. A short-term breakout at 28 would be bullish.
Nat Gas Hits Support-Reversal Zone
!NG)
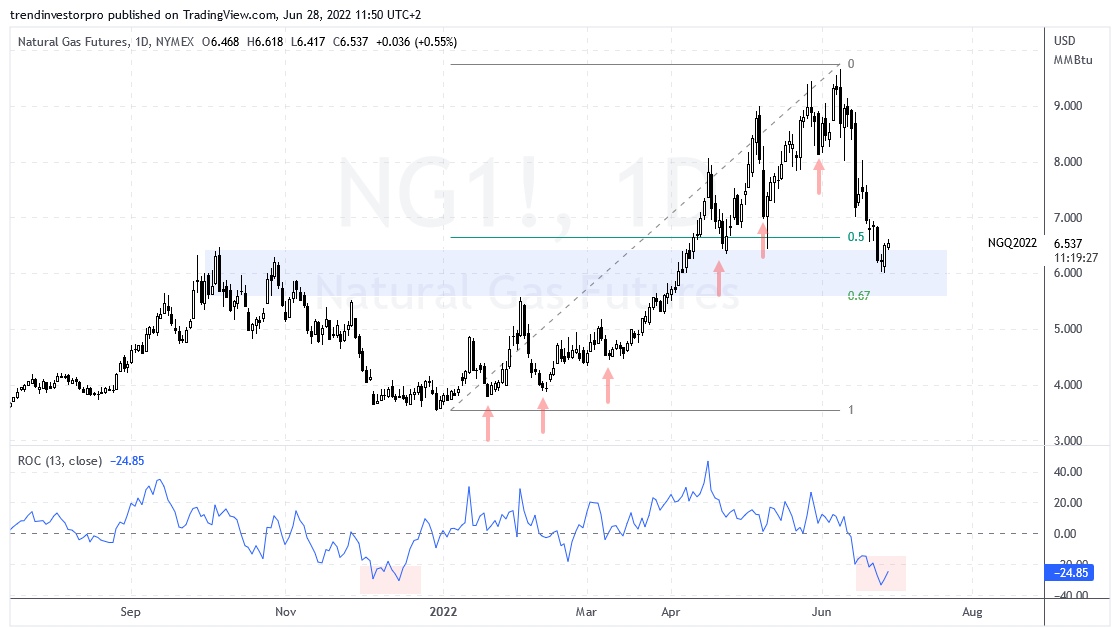
The concern here is with Natural Gas, which accounts for 11.5% of DBE. There are dozens of macro and fundamental factors affecting natural gas, and many other commodities as well. I am not going to get into these because it would take some time to analyze and weigh these factors correctly. On the TradingView chart, Nat Gas Futures more than doubled from late December to early June and then fell over 30% the last few weeks. Check out the long black candlesticks since January and you can spot at least six double digit pullbacks from January to May (red arrows). Natty also fell over 20% in November-December. The current decline, while deep, retraced 50 to 67 percent of the prior advance and returned to a prior resistance zone, which turns support. Overall, the 6 area is a support-reversal zone to watch.
Energy SPDR Becomes Oversold at Support
XLE
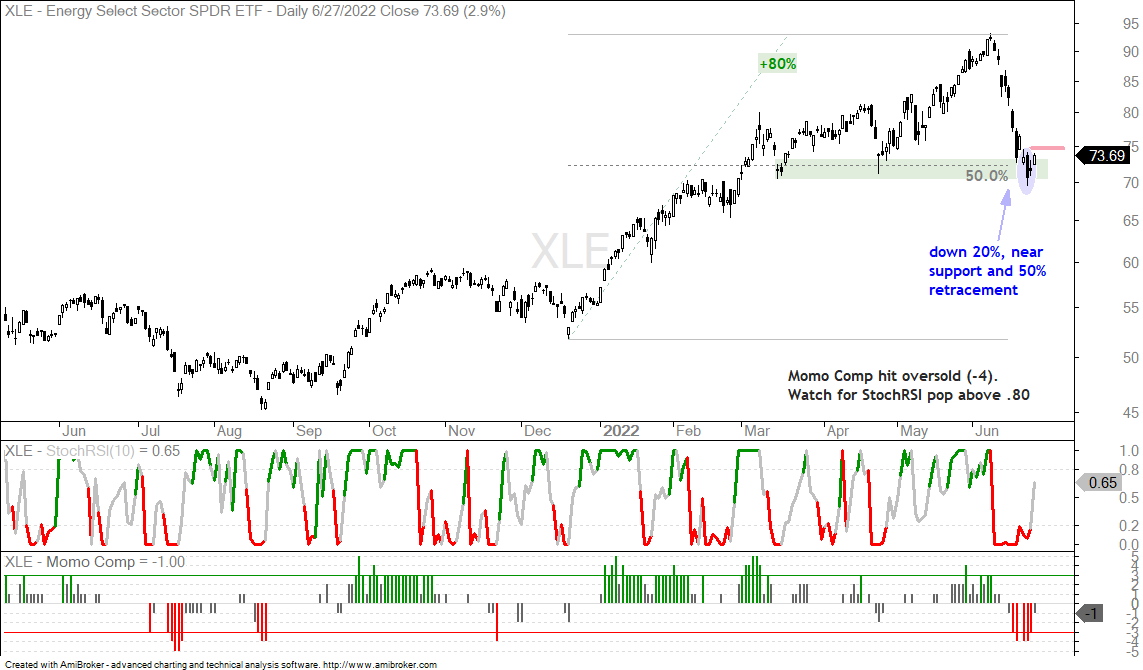
The Energy SPDR (XLE) extended its decline with a long black candlestick on Thursday and then firmed with a inside day on Friday (blue oval). This is a harami pattern that marks indecision after a sharp decline. Indecision alone is not enough to turn short-term bullish because harami require follow through for confirmation. A break above 75 would do the trick. Overall, XLE is in a long-term uptrend and trading in a potential support-reversal zone (50% retracement line and March-April lows). The Momentum Composite became oversold last week and I am also watching for a StochRSI pop above .80 to signal a short-term bullish up thrust.
The Momentum Composite aggregates signals in five momentum-type indicators to identify short-term overbought and oversold conditions. This indicator is part of the TIP Indicator Edge Plugin for StockCharts ACP[2]
Pullbacks, Falling Knives and Overshoots
XES
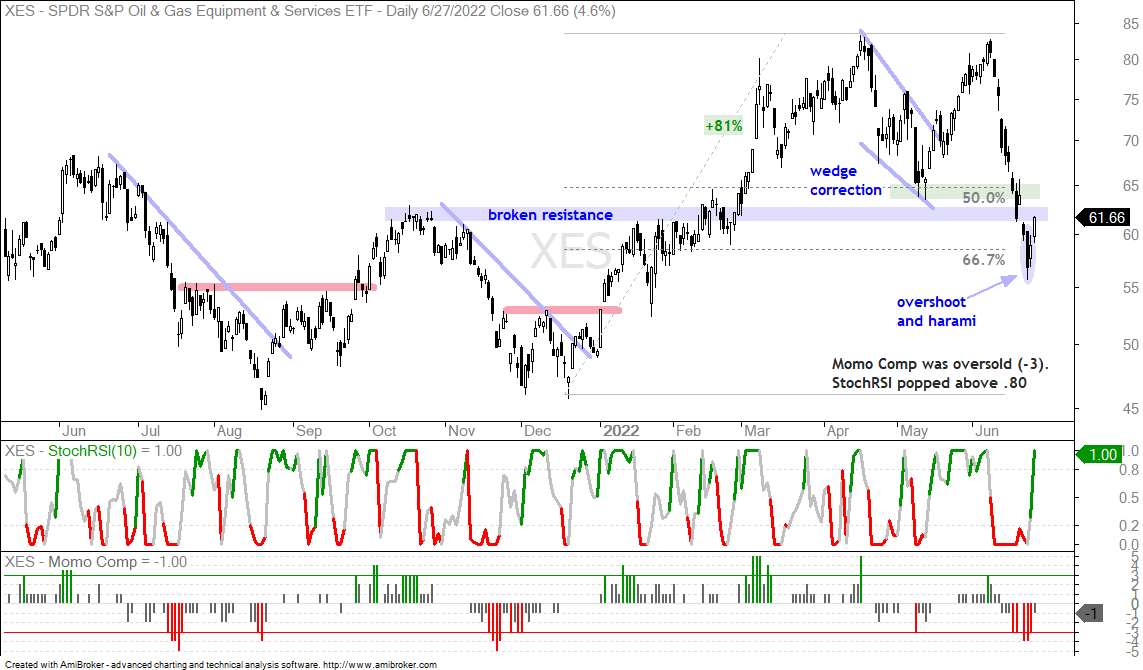
Oil pulls back, XLE catches a cold and the Oil & Gas Equipment & Services ETF (XES) gets the flu. XES is the wild west (literally) of the oil market and this means it is the most volatile. This makes it an even bigger challenge to guesstimate support-reversal zones. The May low (green shading), broken resistance from the October high (blue shading) and the 50% retracement did not hold. XES ploughed through the 67% retracement with a long black candlestick on Thursday, but then firmed on Friday and popped on Monday. Thus, we have an overshoot, a harami and a confirmation of the harami. A short-term reversal.
The bottom windows show StochRSI and the Momentum Composite. The Momentum Composite identifies oversold conditions with a move below -3. Once oversold and/or at a support-reversal zone, StochRSI tells us when the falling knife has turned. A StochRSI pop above .80 is a short-term RSI thrust (momentum pop) that can signal a short-term bottom. The harami confirmation can also be used. This setup is valid as long as XES holds last week’s low (55.61), which is some 10% below Monday’s close. Plan the trade and trade the plan.
Wheat ETF Plunges to Prior Uptrend
WEAT
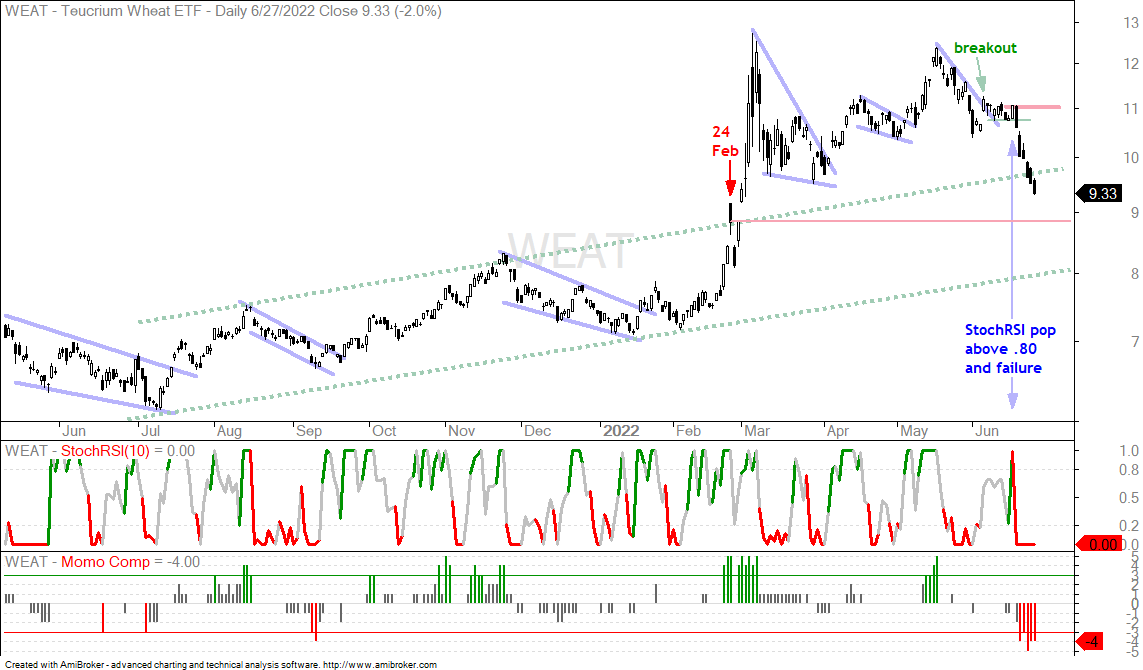
The Wheat ETF (WEAT) was also on the radar as it pulled back within an uptrend, broke a trendline on 6-June and had a StochRSI pop on 16-June. There was no follow through and the ETF plunged 15.72% the last six days. These signals failed and it is back to the drawing board. The red arrow marks February 24th, which is when Russia invaded Ukraine. WEAT went ballistic into early March and then turned volatile. Note that the ETF was in an uptrend prior to this surge and fell back below the upper line of the rising channel (green dotted lines). The red line marks the 24-Feb close for reference. Technically, the bigger trend is still up and WEAT is oversold as the Momentum Composite dipped to -3 or lower the last five days. The ETF, however, is still in the falling knife stage and has yet to firm.
Big Three Drag Down the DB Agriculture ETF
DBA
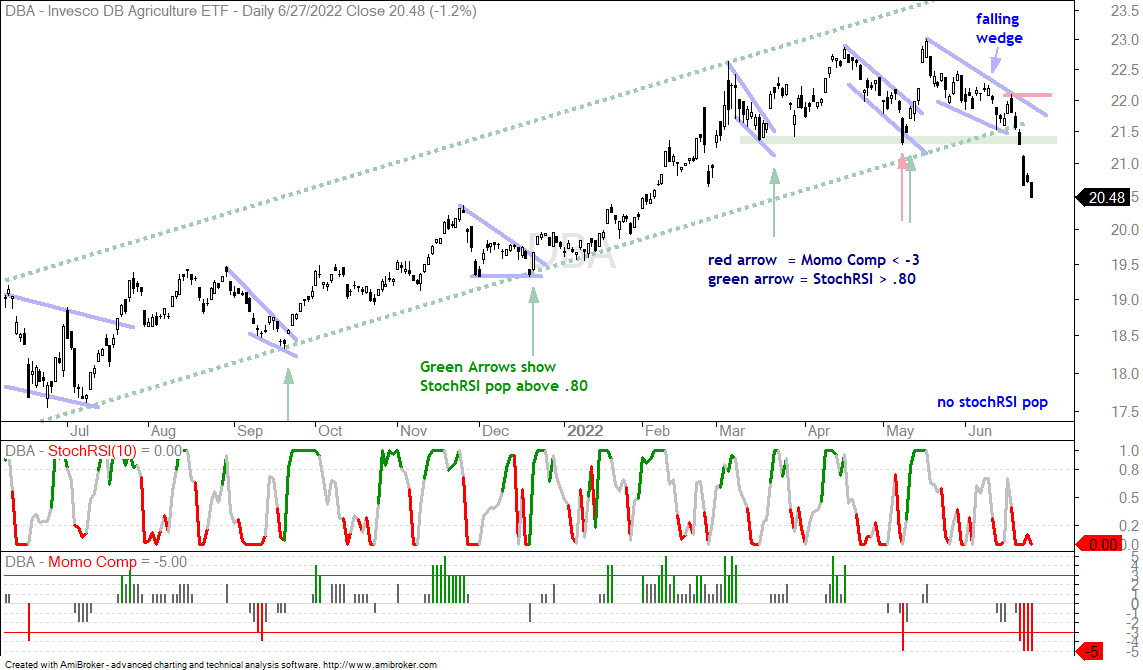
The DB Agriculture ETF (DBA) was hit hard as its top three components fell sharply the last six days (CORN, SOYB, WEAT). DBA broke the rising channel line, support from the March-May lows and the Trend Composite turned negative (not shown). Technically, this is a breakdown and trend reversal. Prior to this breakdown, DBA was setting up with a falling wedge correction within a bigger uptrend. There was no breakout and no StochRSI pop to signal that the wedge stopped falling. Instead, the wedge did not work and the bigger trend reversed.
Sugar ETF Enters Support-Reversal Zone
CANE
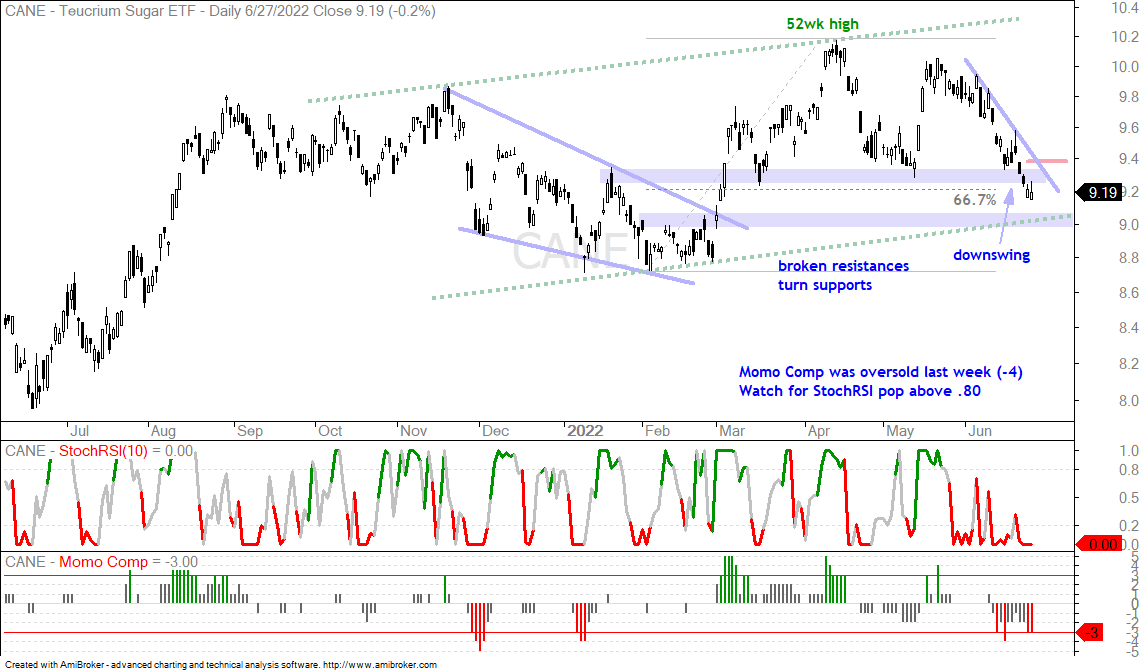
The Sugar ETF (CANE) is still in an uptrend with a positive Trend Composite (not shown) and a 52wk high in April. CANE fell with the rest of the commodity world in June and is trading in a potential support-reversal zone marked by broken resistance levels and the 67% retracement. The swing since early June is down and the ETF became oversold for a few days, but we have yet to see a breakout or StochRSI pop. Watch for a break above 94 or StochRSI pop above .80 to reverse the short-term downswing.
Coffee ETF Fails to Follow Through
JO
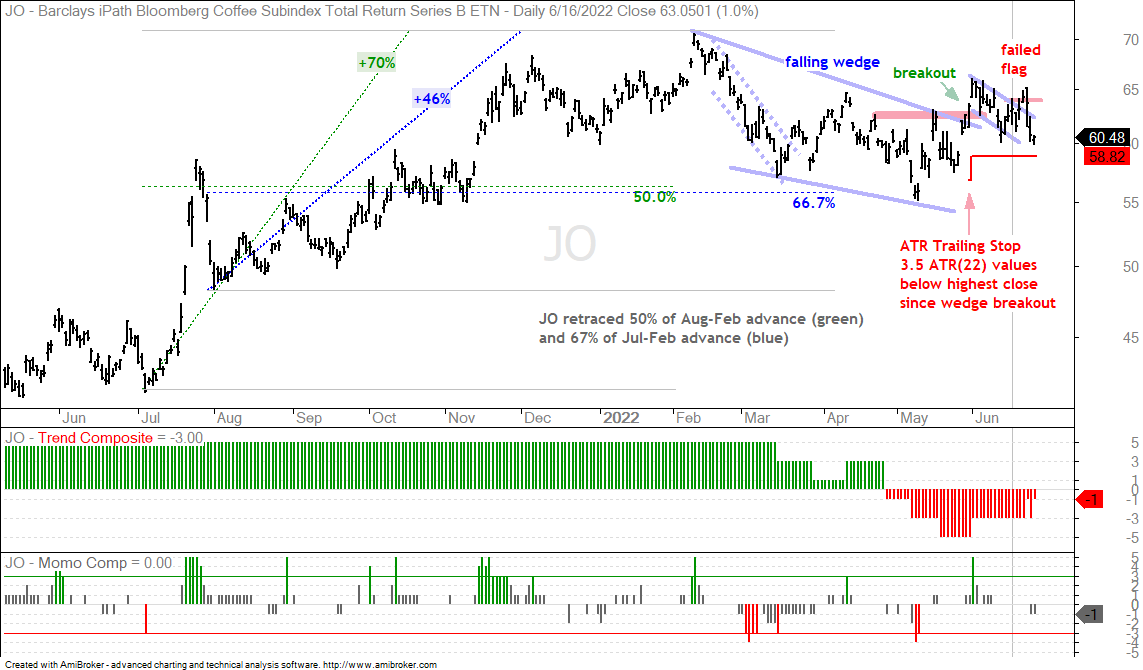
The Coffee ETF (JO) has a wedge breakout working since early June, but last week’s flag breakout failed as the ETF fell with the other agricultural commodities. The flag failure is a short-term negative, as is general weakness in agriculture commodities. Even though the larger wedge breakout in early June is still active, the ETF is not following through on the upside and this is a concern. The red line marks the ATR Trailing Stop at 58.82. This stop is 3.5 ATR(22) values below the highest close since the wedge breakout. I chose 3.5 at the multiplier because this value set the initial stop just below the late May low. I try to set initial stops at or just below a prior low. A close below 58.82 would trigger this stop.
You can learn more about the ATR Trailing Stop and exit strategies in this post[3], which includes a video and charting options for everyone.
Follow Through on Short-term Breakouts
ICLN, LIT, XBI
I covered the Biotech SPDR (XBI), Global Clean Energy ETF (ICLN) and Lithium Battery Tech ETF (LIT) last Tuesday because they showed relative chart strength[4] and had short-term breakouts working. These three followed through with further gains the last five days and I am updating these charts with the ATR Trailing Stop for reference. These stops are 2 ATR(22) values below the highest close since the short-term breakouts. Notice that the initial stops align with the mid June lows and the stops rose as prices rose after the breakout. These are still breakouts within bigger downtrends and breakouts within a bear market so risk remains above average. Chasing after big moves is also not a good idea in such environments.