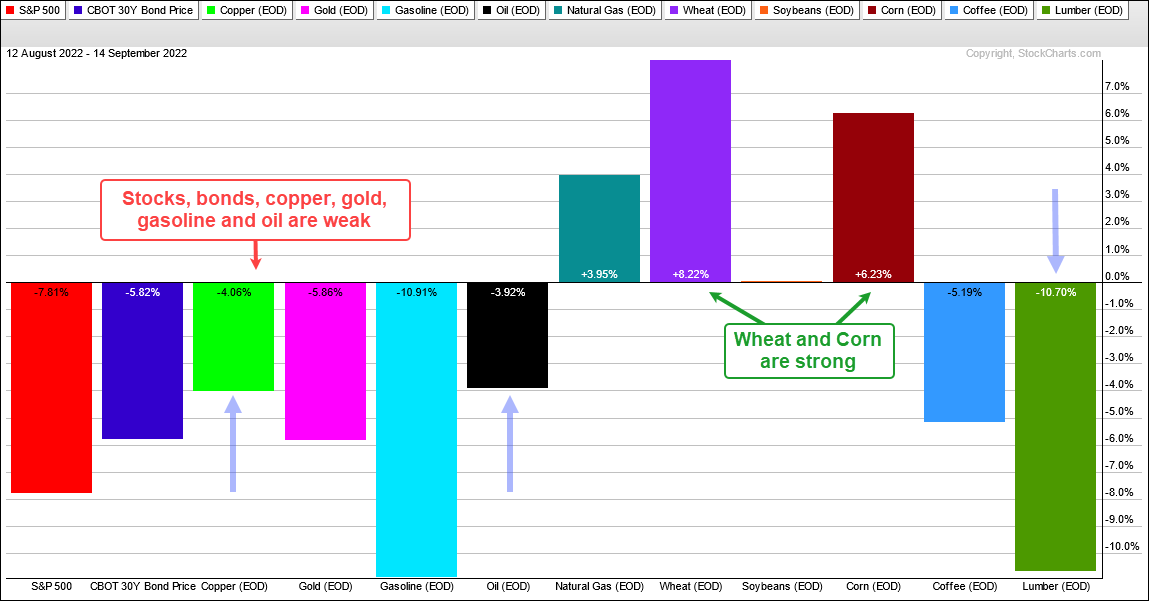
This is one tough market, and I am not just talking about stocks. Non-stock alternatives usually emerge during bear markets, but we are seeing weakness in oil, copper, gold and “safe-haven” Treasury bonds. The PerfChart below shows one month performance for 12 assets. Stocks ($SPX), bonds ($USB), copper ($COPPER), gold ($GOLD), gasoline ($GASO) and oil ($WTIC) are down between 4 and 11 percent.
On the plus side, we are seeing strength in natural gas ($NATGAS), wheat ($WHEAT) and corn ($CORN). Soybeans ($SOYB) are flat. The right side of the chart shows two more losers, coffee ($COFFEE) and lumber ($LUMBER). Weakness in stocks, copper, oil and lumber (blue arrows) speaks to demand destruction (slowing economy). Strength in grains suggests a possible supply crunch due to a weak harvest (dry conditions). Whatever the reasons, stocks and commodities tied to economic performance are weak. We are in a bear market and the pickings are slim.
About the ETF Trends, Patterns and Setups Report
This report contains discretionary chart analysis based on my interpretation of the price charts. This is different from the fully systematic approach in the Trend Composite strategy series. In this ETF Trends, Patterns and Setups report, I am looking for leading uptrends and tradable setups within these uptrends. While I use indicators to help define the trend and identify oversold conditions within uptrends, the assessments are mostly based on price action and the price chart (higher highs, higher lows, patterns in play). Sometimes the chart assessment can be at odds with the indicators.
This Week's Commentary Schedule
Tuesday – 16 August: Market-ETF Report and Signal-Rank Table Update
Wednesday – 17 August Market-ETF Video and Market Regime Update
Thursday – 18 August: Market-ETF Report and Signal-Rank Table Update
Saturday – 20 August: ETF Signal and Rank Table
You can learn more about my chart strategy in this article[1] covering the different timeframes, chart settings, StochClose, RSI and StochRSI.
SPY, QQQ and IWM Establish Key Resistance
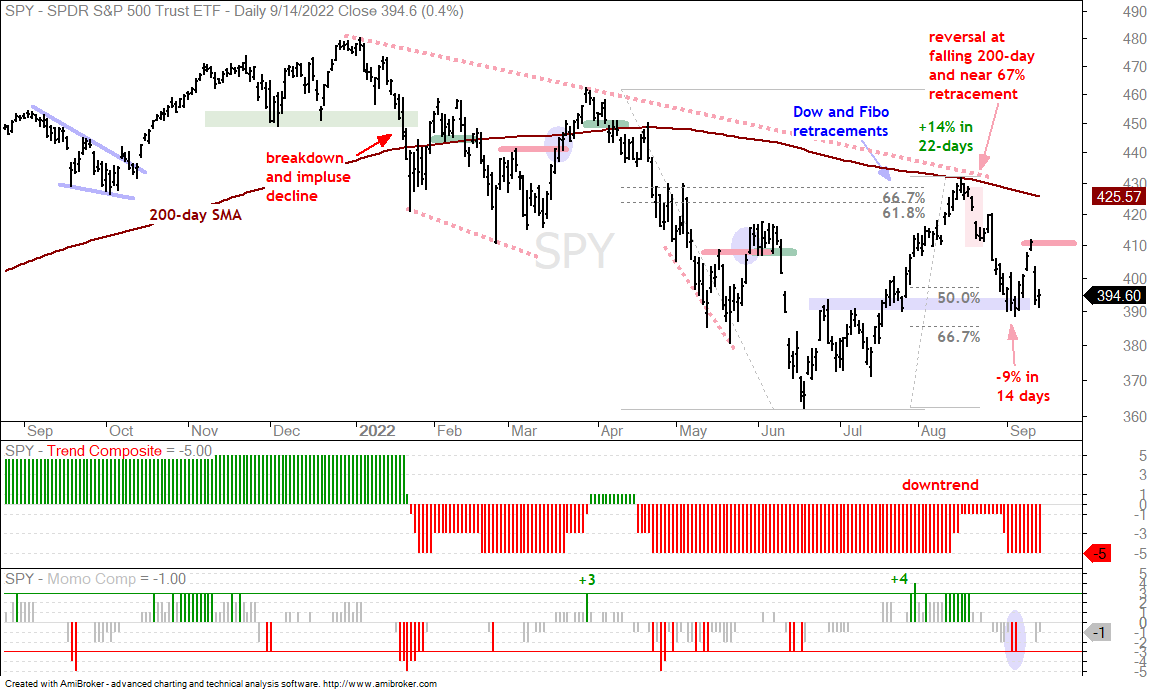
SPY, QQQ and IWM established an important resistance level with the sharp drop on Tuesday. The long-term trend is down because the Composite Breadth Model is bearish, SPY is below the falling 200-day and the Trend Composite is negative. The short-term trend is down since the failure at the 200-day in mid August. SPY surged some 5% in four days and then fell 4.3% on Tuesday. The decline started with a gap and SPY closed near the low of the day, signaling that buyers did not step in. This surge and plunge sequence creates a reaction high to watch going forward.
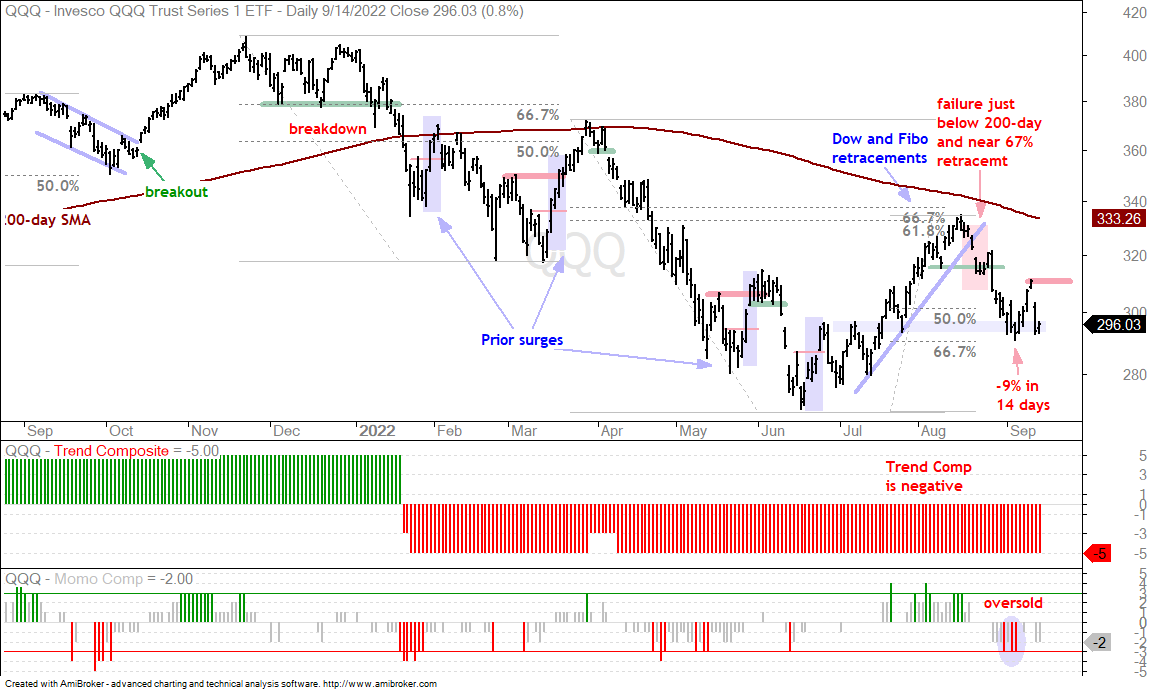
I am bearish on the broader market and the onus is on the bulls to prove the bears wrong. As such, I am always looking for key levels that, if breached, would argue for a re-evaluation of my bearish stance. Tuesday’s decline created such a level because this is where buying pressure failed (demand) and selling pressure triumphed (support). A recovery and break above Monday’s high (red line) would show some serious resilience. Let’s cross that bridge when and if it gets here. The blue ovals in mid March and late May show prior breakouts that failed. These advances started from a lower low (red dotted lines). SPY is still above its June low and in a support-reversal zone, which means a breakout would carry more weight. The next chart shows QQQ with similar characteristics.
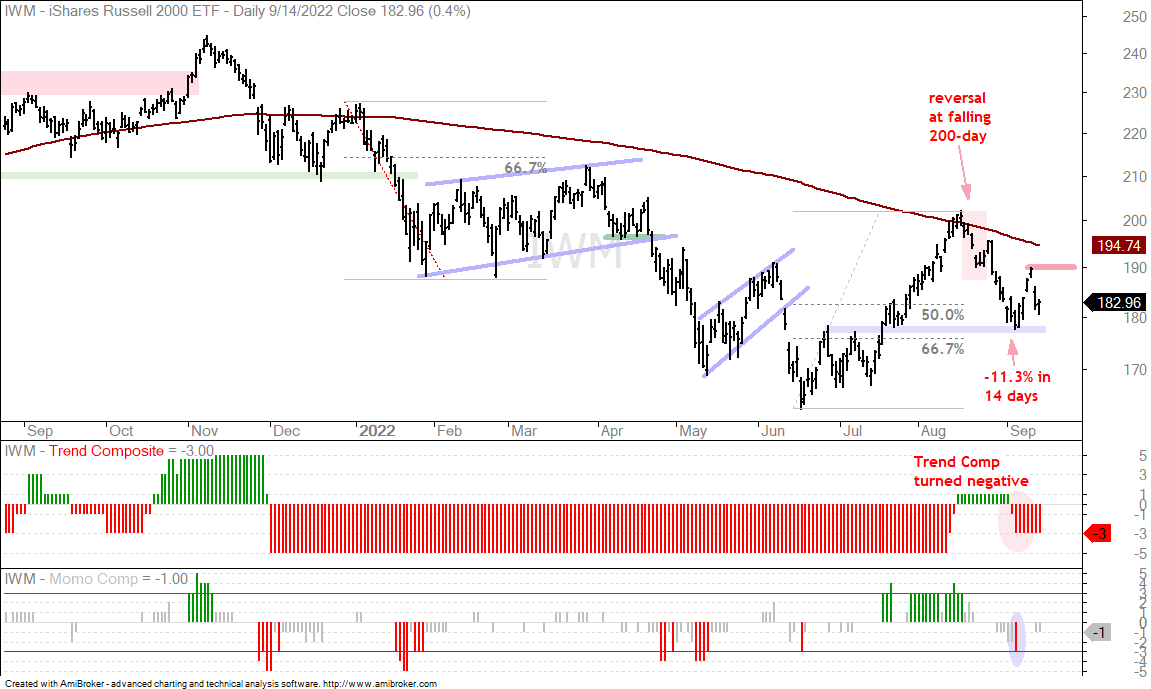
The next chart shows IWM with Monday’s high marking resistance at 190. The long-term trend is down as IWM failed at the falling 200-day. The short-term trend is down since mid August and a break above Monday’s high would reverse the short-term downtrend, and show some serious resilience. This is not a prediction! The bears have the clear edge right now and the bulls have their work cut out for them.
The Momentum Composite aggregates signals in five momentum-type indicators to identify short-term overbought and oversold conditions. This indicator is part of the TIP Indicator Edge Plugin for StockCharts ACP[2]
Big Sectors Mirror SPY
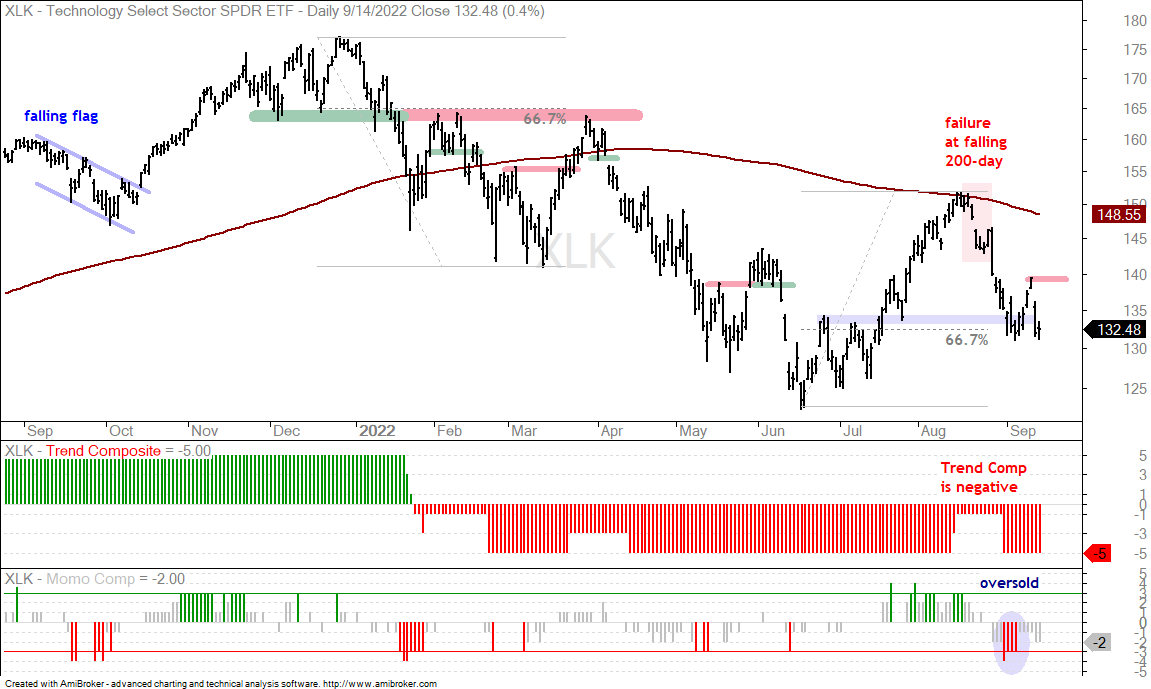
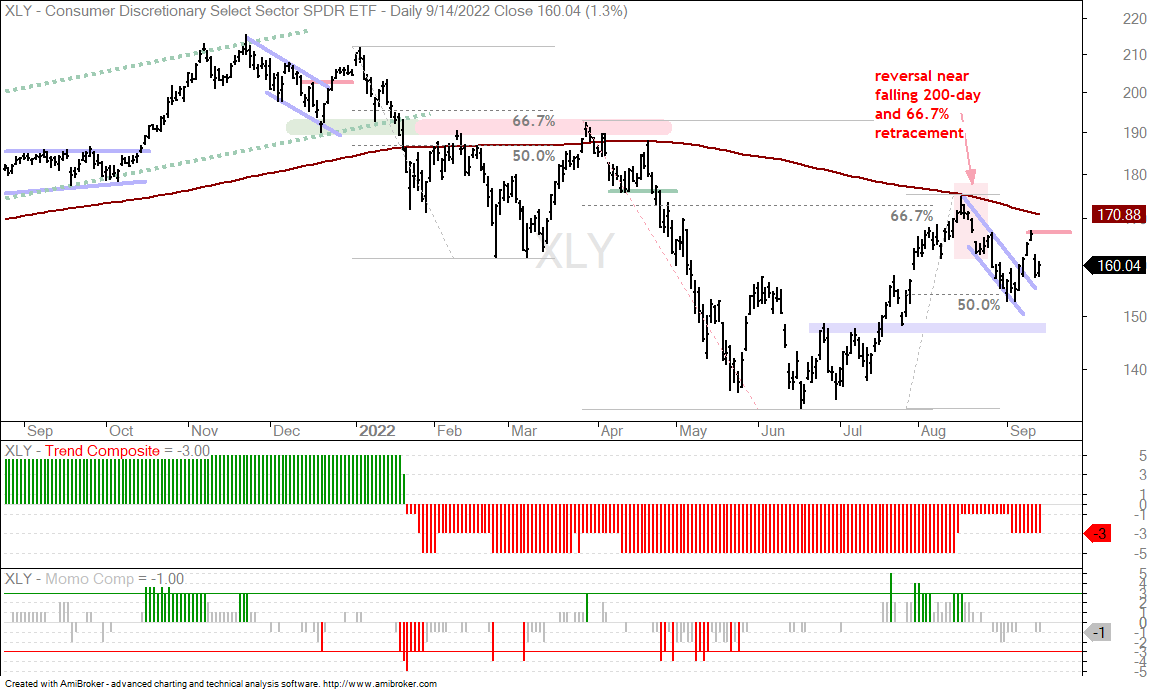
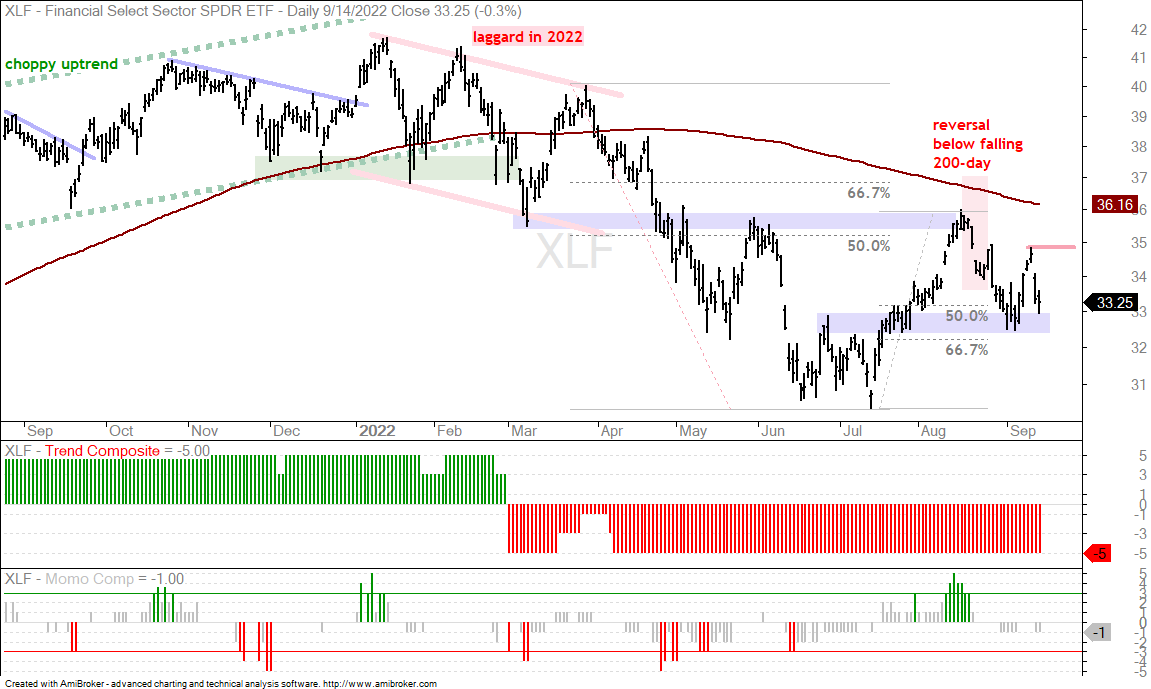
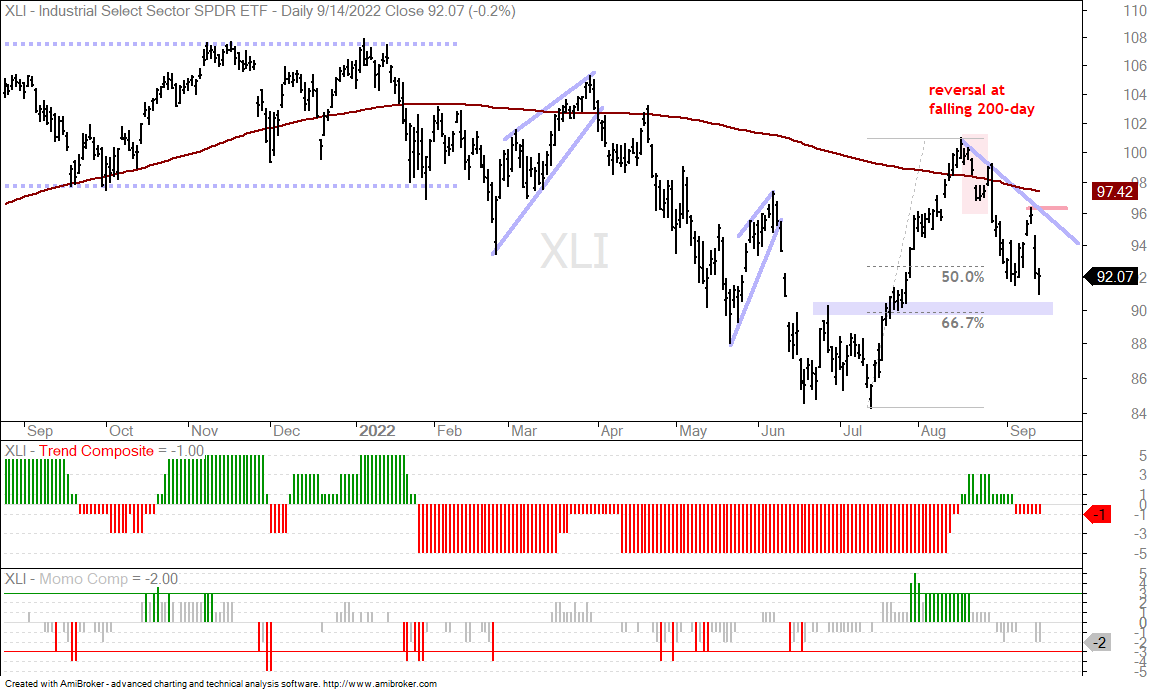
The charts for the four of the five big sectors have similar characteristics. These include the Technology SPDR (XLK), Consumer Discretionary SPDR (XLY), Industrials SPDR (XLI) and Finance SPDR (XLF). All four failed around their falling 200-day SMAs and their Trend Composites are negative. After falling from mid August to early September, they all surged with the market for four days and plunged on Tuesday. The short-term trends are down and Monday’s high marks an important level going forward. At least three of the four need to break Monday’s high to take a bullish effort seriously.
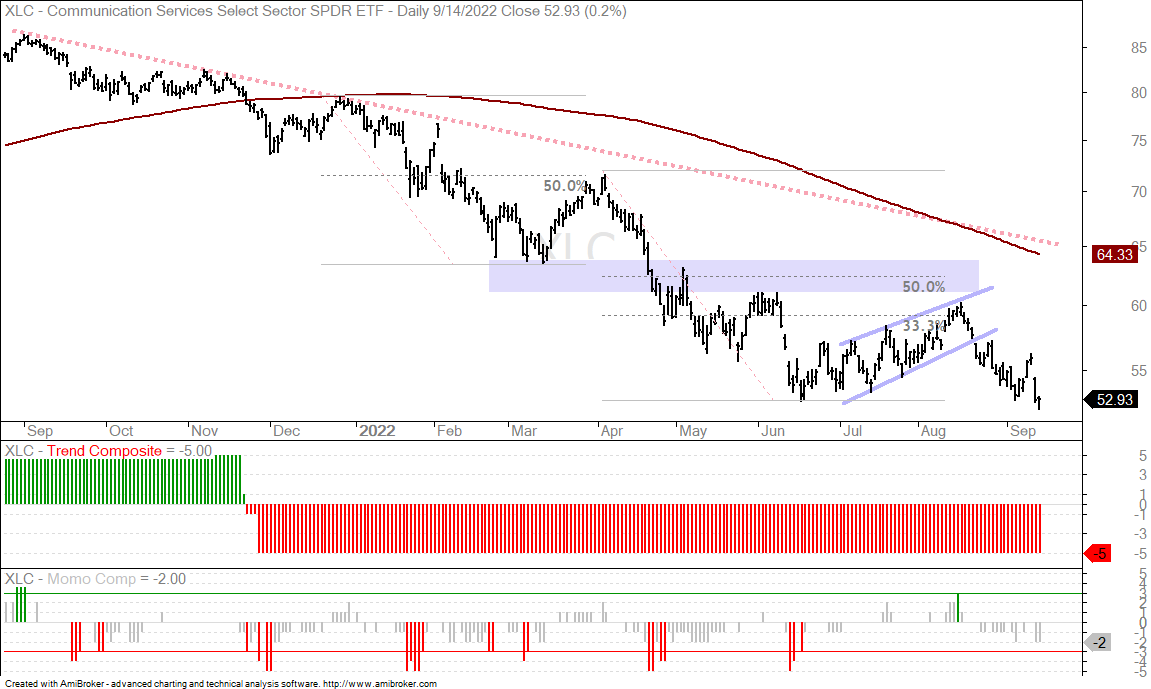
The Communication Services SPDR (XLC) is the basket case of the big six because it recorded a 52-week low this week.
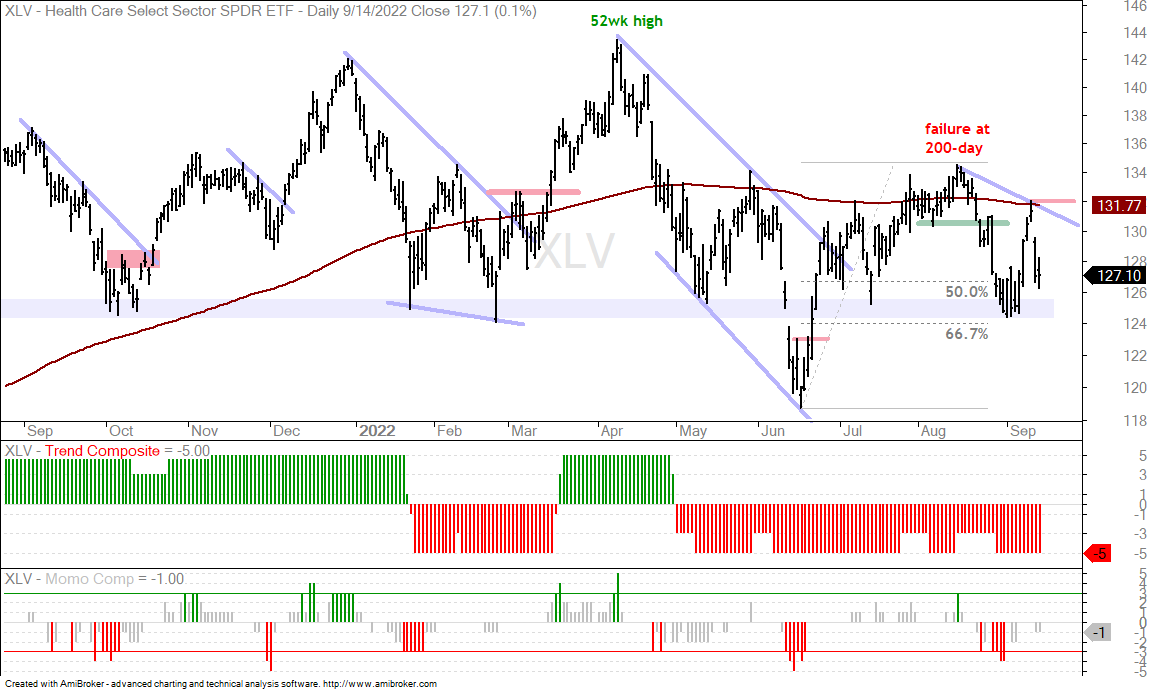
The Healthcare SPDR (XLV) is the only sector that is above its winter lows (January-February). It is holding up the best, but going nowhere as it gyrates above/below the 130 level.
You can learn more about exit strategies in this post[3], which includes a video and charting options for everyone.
Measuring Short-term Relative Performance
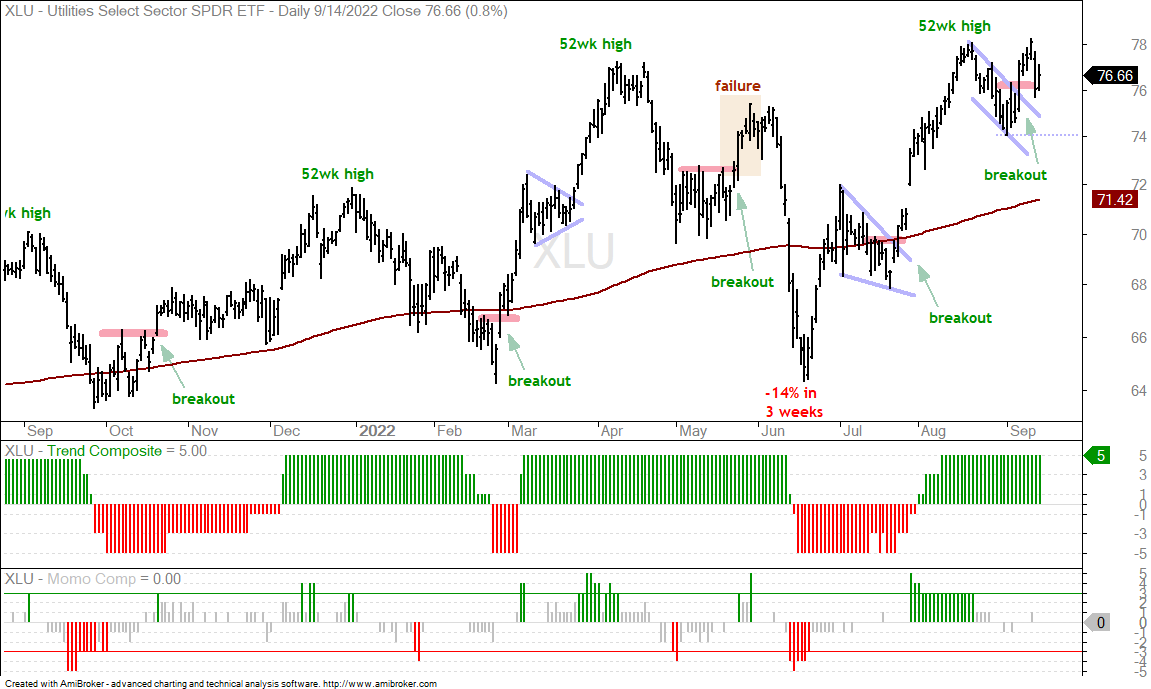
Relative strength in stocks and stock-based ETFs is important in a bull market and/or when the long-term trend is up. We are in a bear market and most stock-based ETFs are in long-term downtrends. Relative strength in a bear market means the ETF is holding up better (going down less) or bucking the bear market (actually rising). Short-term, the early September low marks a benchmark low that we can use to gauge relative chart performance. ETFs that held well above this low show short-term relative strength. ETFs that broke this low show short-term relative weakness. The first chart shows XLU with a flag breakout, new high and sharp decline on Tuesday. The ETF is well above the early September low (blue dotted line) and holding up relatively well.
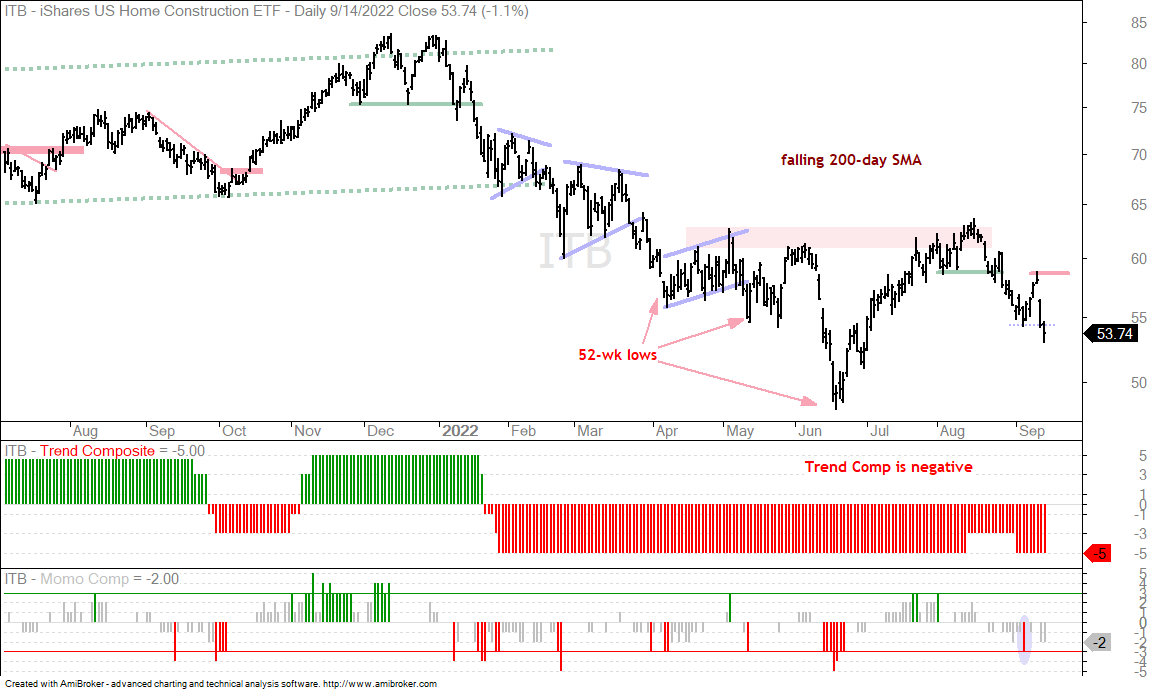
The next chart shows the Home Construction ETF (ITB) with a four day bounce, sharp decline on Tuesday and further weakness on Wednesday. ITB broke its early September low and is one of the weaker ETFs in the market right now.
The Trend Composite aggregates signals in five trend indicators: Bollinger Bands (125,1), Keltner Channels (125,2), 5-day Rate-of-Change of 125-day SMA, StochClose (125,5) and CCI-Close (125). The Trend Composite and ten other indicators are part of the TIP Indicator Edge Plugin for StockCharts ACP[2]
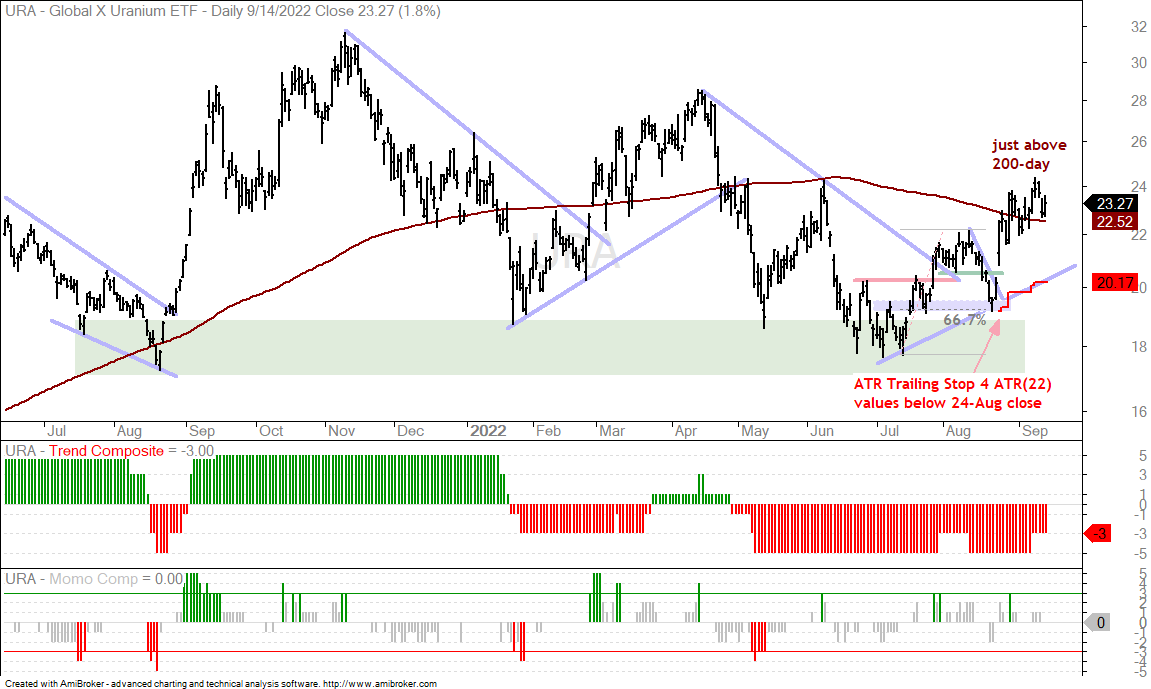
Uranium ETF Holds Upswing (URA)
The Uranium ETF (URA) continues to perform well since it reversed its downswing with a breakout-surge in the second half of August. The ETF is battling its 200-day SMA and is currently just above this key metric. It was hit with the rest of the stock market on Tuesday and managed to bounce on Wednesday. Overall, I am bullish as long as the upswing and ATR Trailing Stop hold. A close below 20 would warrant a re-evaluation.
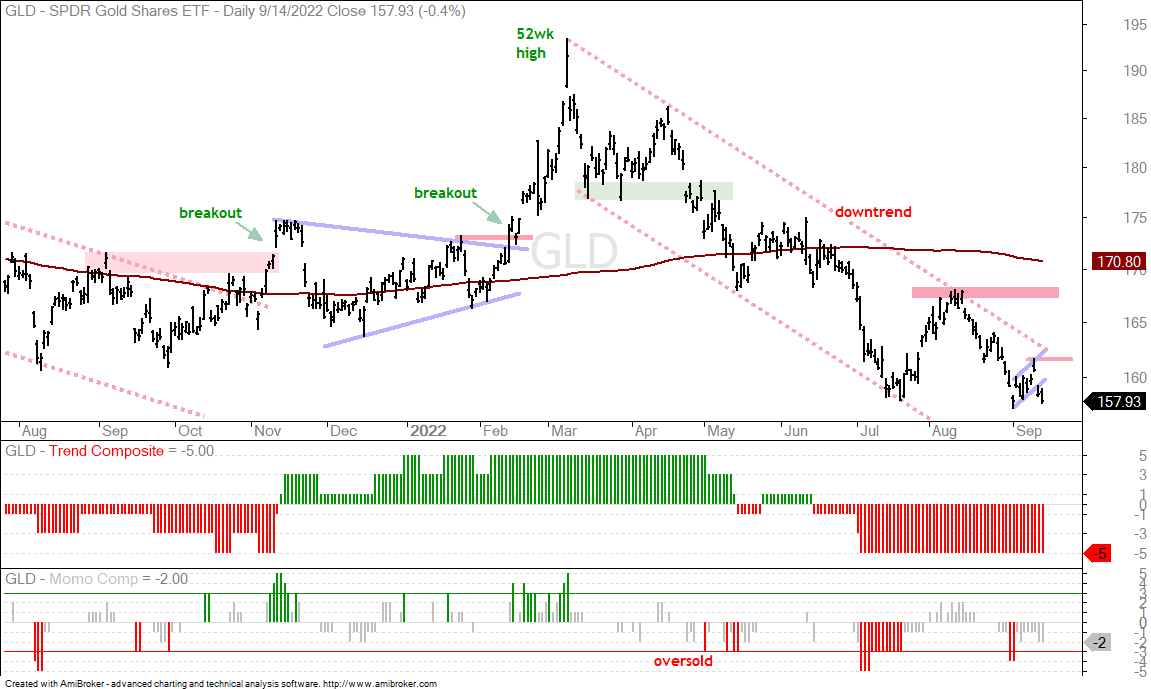
Gold SPDR Breaks Flag Line (GLD)
The Gold SPDR (GLD) is one of the weakest ETFs in the master list and is not offering an alternative to stocks. GLD hit a new low in early September, bounced above 160 and broke a flag line with a sharp decline the last two days. Note that the Dollar Bullish ETF (UUP) and 10-yr Treasury Yield surged on Tuesday and edge lower on Wednesday. Overall, rising yields are bearish for gold and bullish for the Dollar. GLD is in a clear downtrend and on the verge of another 52-week low. Monday’s high marks short-term resistance at 162 and the August high marks long-term resistance at 168.
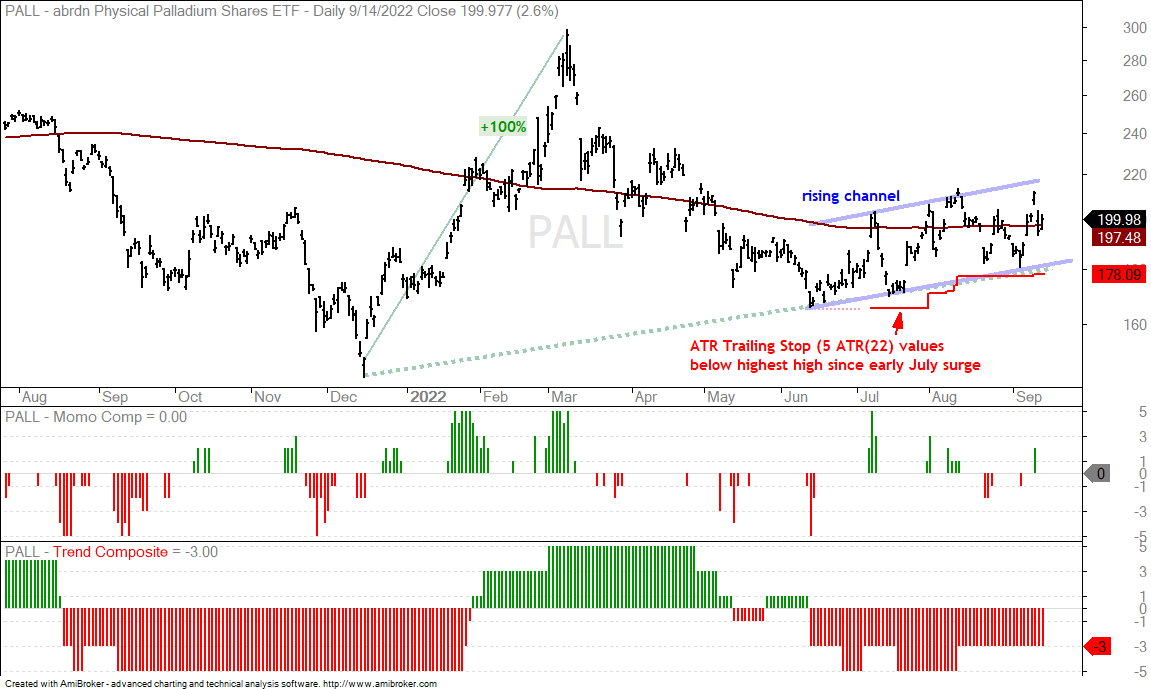
Palladium ETF Grinds Higher (PALL)
The Palladium ETF (PALL) was hit hard on Tuesday as well with a 7.7% decline and then rebounded on Wednesday with a 2.6% advance. Yep, palladium has above average volatility so expect some big swings. I am focused on the upswing since June (blue lines) and will remain bullish as long as the early September low holds. A close below 178 would break the channel line and trigger the ATR Trailing Stop.
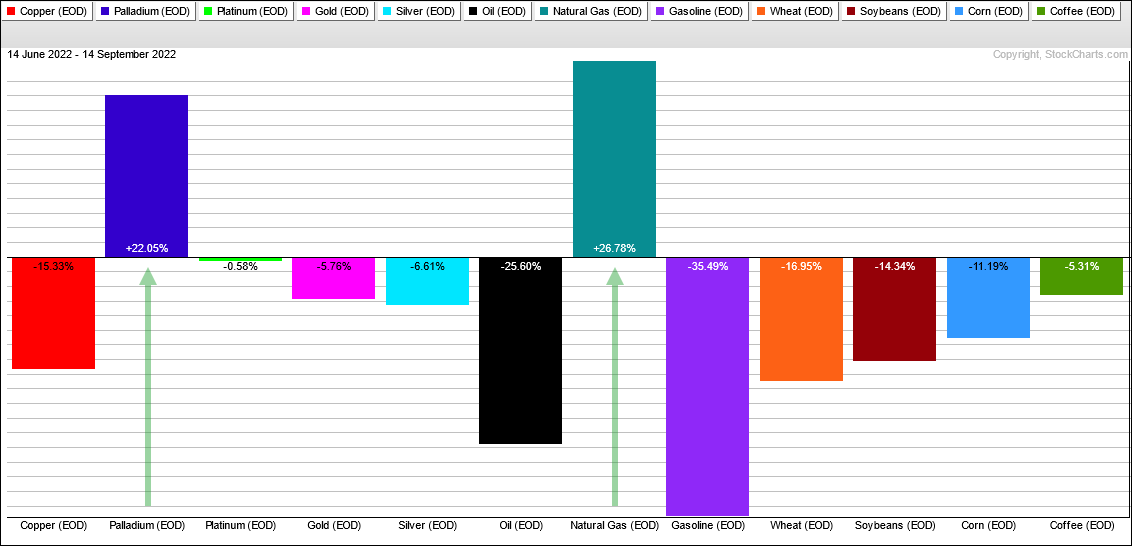
The PerfChart below shows three month performance for 12 spot commodities. Palladium ($PALL) and Natural Gas ($NATGAS) are the only two showing gains. The rest are down with Platinum ($PLAT) sporting the smallest lost. On the price charts, Palladium, Natural Gas and Corn are the only three above their 200-day SMAs.
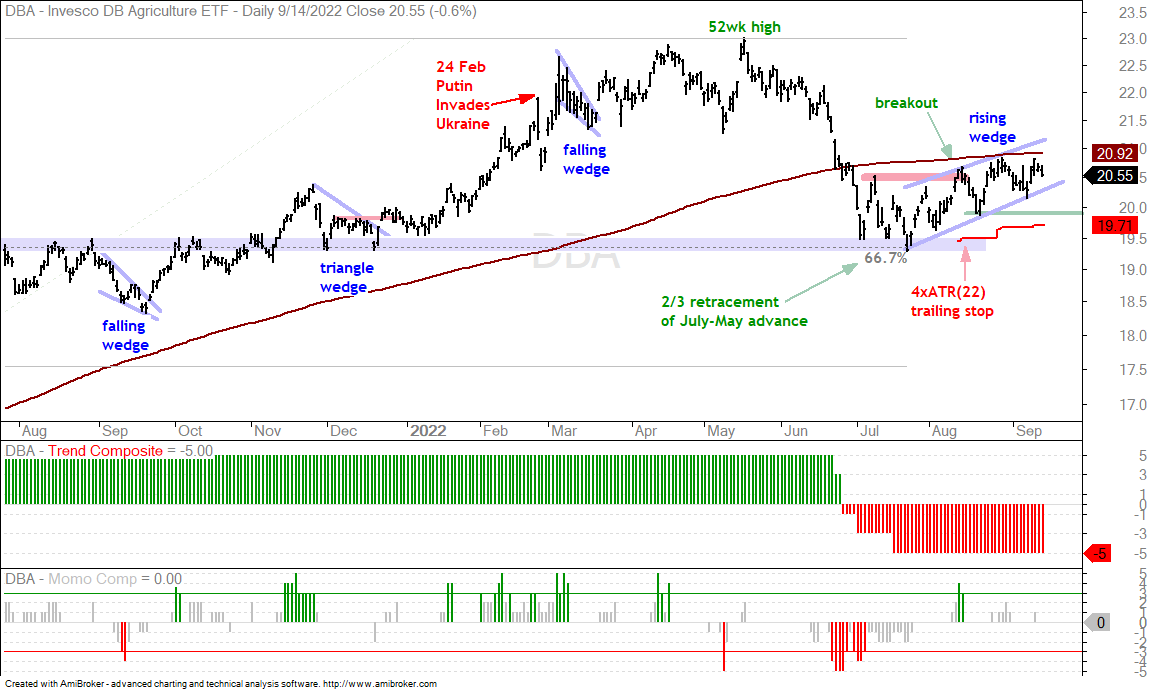
DB Agriculture ETF Holds Rising Wedge (DBA)
The DB Agriculture ETF (DBA) remains in an upswing, but this upswing could be a counter-trend bounce after the May-July decline. The immediate trend is up as long as this wedge rises and I will remain bullish until there is a reversal/breakdown. I became bullish on DBA when it firmed near the 66.7% retracement (blue shading) and broke out in mid August. Even though the decline broke the 200-day and the Trend Composite turned negatived, a 2/3 retracement is normal after an extended advance and I viewed the breakout as bullish. It is now time to determine what would prove me wrong. A rising wedge is typically a bearish continuation pattern that forms as a bounce after a breakdown. A break below the mid August low (green line) would reverse the rise of this wedge and argue for a continuation of the May-July decline. The ATR Trailing Stop is at 19.71, but I do not think it is needed anymore because the August low marks clear support.
You can learn more about the ATR Trailing Stop and exit strategies in this post[3], which includes a video and charting options for everyone.
Wheat ETF Goes for a Breakout (WEAT)
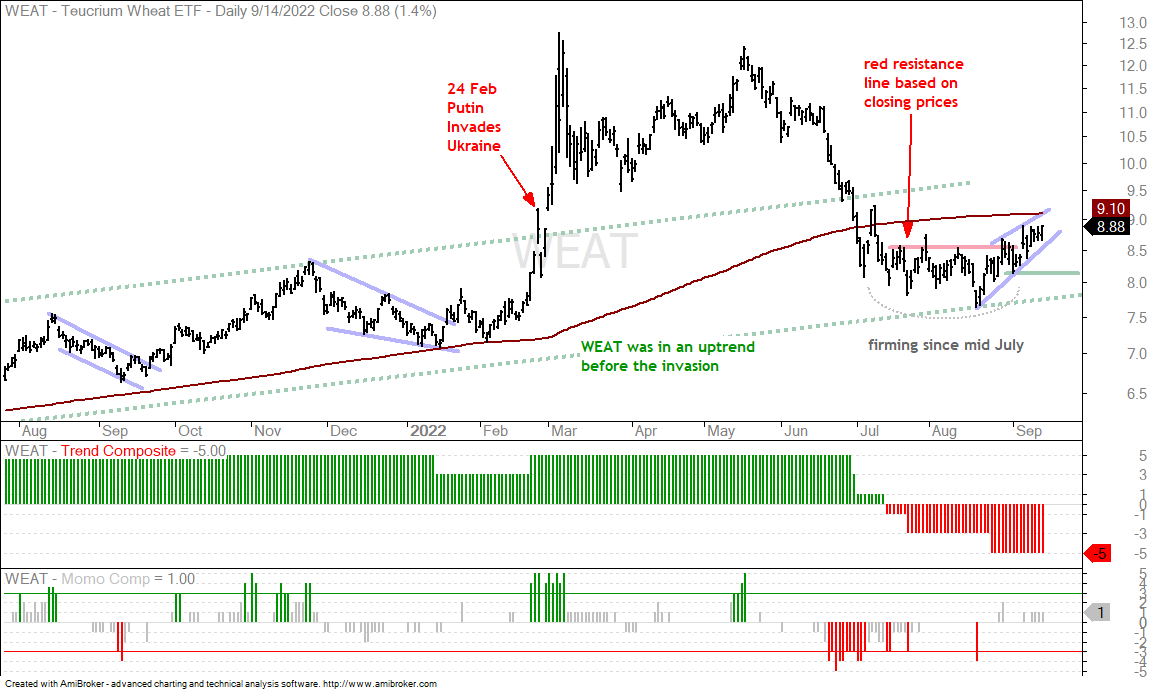
Wheat, Corn and Soybeans are the three biggest components of the DB Agriculture ETF with each accounting for around 14%. Cattle, Coffee and Sugar are next with each accounting for around 11% each. The first three are grains and positively correlated, which means they tend to move in the same direction. I have been mostly focused on the Wheat ETF (WEAT) and remain bullish. WEAT plunged with the other grains into July and then firmed into August. Like DBA above, WEAT is just below its 200-day and the Trend Composite is negative. As such, a bullish stance is purely subjective. Overall, the green dashed lines mark the uptrend before Russia invaded Ukraine and WEAT is back within this uptrend. The ETF firmed and broke the red resistance line with an advance the last few weeks. As with DBA, I am now determining what would prove my bullish stance wrong. A rising wedge could be taking shape since mid August and I marking key support at the early September low (8.1). A close below this level would be bearish.
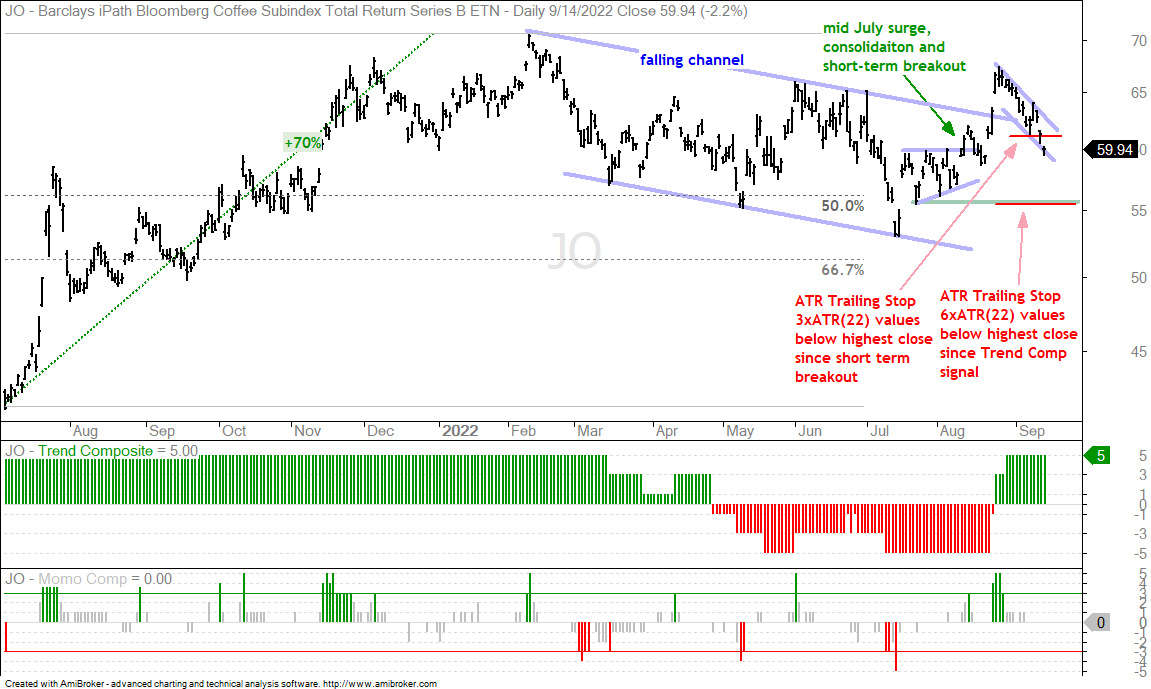
Coffee ETF Extends Pullback after Breakout (JO)
The Coffee ETF (JO) broke out with a surge in the second half of August and then gave it all back with a rather sharp decline into mid September. Long-term, the channel breakout is bullish and the Trend Composite is still positive. The trend-following trailing stop remains at 55.41 and the mid July lows confirm support here. Short-term, there was the small Ascending Triangle breakout in mid July and the short-term ATR Trailing Stop triggered with a sharp decline on Wednesday. A falling flag is now taking shape a break above the upper line would be short-term bullish.