The short-term uptrends are dominating the landscape, or at least this seems to be the case. SPY is below its falling 200-day SMA, but is up some 16% from its mid June low. It is a strong move that has yet to be reversed. In fact, there are dozens of ETFs with similar characteristics: new low in June or July and sharp advance into mid August. I am focused on this advance in most ETFs because these short-term uptrends have yet to reverse. Today’s commentary will mark short-term support levels to watch going forward and show how to use the ATR Trailing Stop to jump on runaway short-term uptrends (see DBB at bottom).
About the ETF Trends, Patterns and Setups Report
This report contains discretionary chart analysis based on my interpretation of the price charts. This is different from the fully systematic approach in the Trend Composite strategy series. In this ETF Trends, Patterns and Setups report, I am looking for leading uptrends and tradable setups within these uptrends. While I use indicators to help define the trend and identify oversold conditions within uptrends, the assessments are mostly based on price action and the price chart (higher highs, higher lows, patterns in play). Sometimes the chart assessment can be at odds with the indicators.
This Week's Commentary Schedule
Tuesday – 16 August: Market-ETF Report and Signal-Rank Table Update
Wednesday – 17 August Market-ETF Video and Market Regime Update
Thursday – 18 August: Market-ETF Report and Signal-Rank Table Update
Saturday – 20 August: ETF Signal and Rank Table
You can learn more about my chart strategy in this article[1] covering the different timeframes, chart settings, StochClose, RSI and StochRSI.
Inflation and Stocks
Fundamentals affect stock prices, but fundamentals are often priced in before they become apparent. Most of the time, stock prices lead the fundamentals. There are lots of fundamental factors at work when it comes to forecasting sales, earnings, growth and other metrics. There is, however, only one price. I am not going to start fundamental analysis, but it may be helpful to understand how inflation might affect stocks.
First, inflation increases the nominal value of everything, including sales and earnings, which could lead to higher stock prices. Inflation could also spur people to buy now instead of later, further fueling the fire. There is, of course, a flipside to inflation: the classic discounted cash flow model[2] to value stocks. Basically, cash flows are discounted using interest rates so a rise in interest rates means a bigger discount. Rising or high inflation points to rising interest rates and this means earnings will be discounted more, which is a negative for stock prices.
This leads us to the two handed fundamentalist. On the one hand, rising inflation lifts nominal prices, including stock prices. On the other hand, rising inflation will lead to higher interest rates and this means cash flows will be discounted more. This will deflate earnings and be negative for stocks. It is another case of “damned if you do and damned if you don’t”. Stock prices are the final arbiter because stock prices reflect all known and unknown information. This means it is best to simply stick with uptrends and leaders.
TLT Breaks Down as 10yr T-Yield Breaks Out
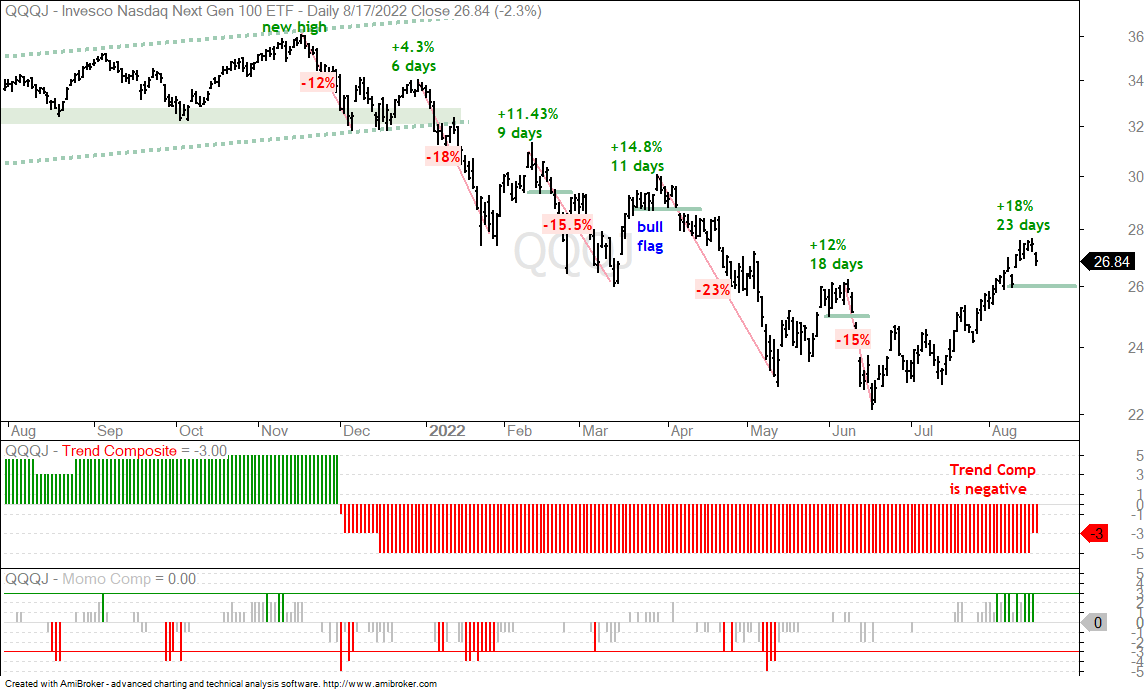
Stocks with high growth rates or stocks expected to earn most of their money well into the future suffer the most from rising interest rates. This is because future cash flows are discounted more. The further in the future the cash flow, the more it will be discounted. The stocks in Nasdaq 100 Next Gen ETF (QQQJ) represent this group. The chart below shows QQQJ with an 18% surge in 23 days. This surge occurred as the 10-yr Treasury Yield fell below 2.6%. A rise in the 10yr could weigh on this group.
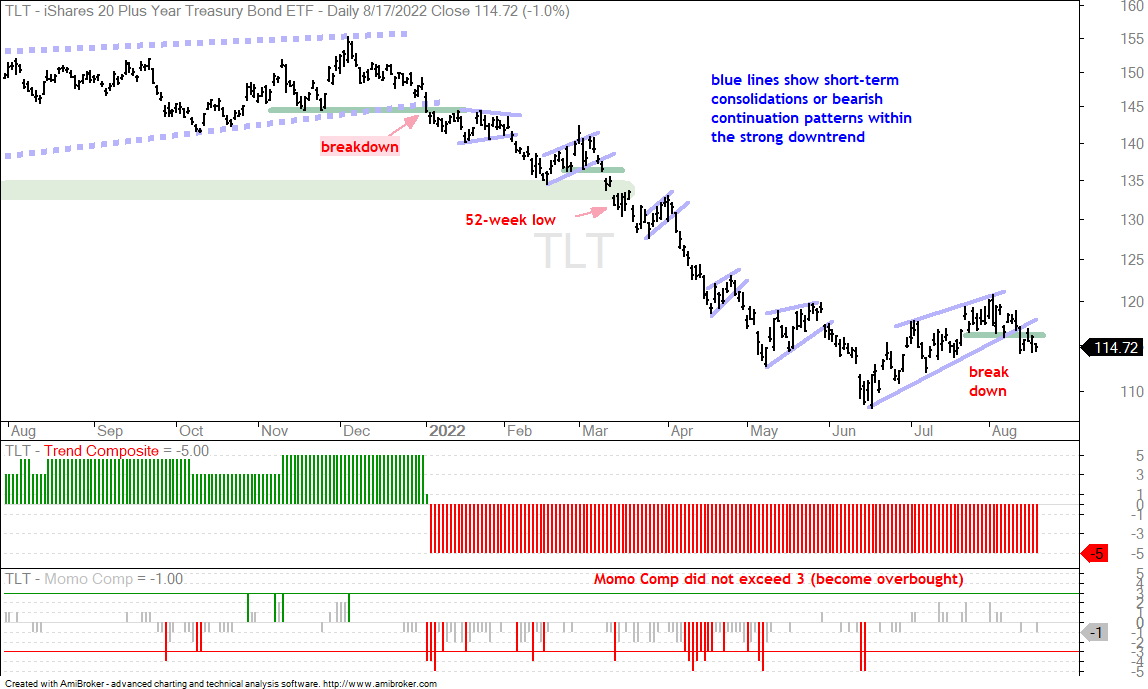
Note that the 20+ Yr Treasury Bond ETF (TLT) broke down last week and the 10-yr Treasury Yield broke out. This means yields are rising and this means earnings will be discounted more in the future. The first chart shows TLT breaking wedge support with a sharp decline last Friday and this breakdown held this week.
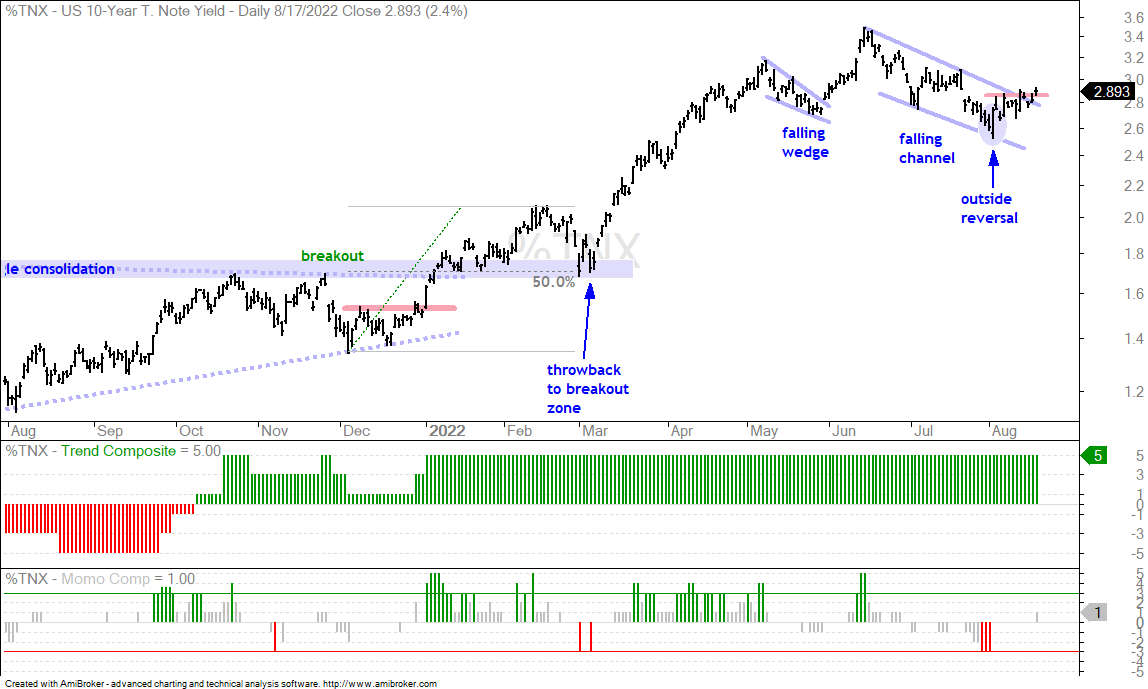
The second chart shows the 10-yr Treasury Yield breaking out of a falling channel. This signals an end to the correction and a resumption of the bigger uptrend. The upside target is north of 3.5%.
The Momentum Composite aggregates signals in five momentum-type indicators to identify short-term overbought and oversold conditions. This indicator is part of the TIP Indicator Edge Plugin for StockCharts ACP[3]
Dollar Breaks Out Along with T-Yield
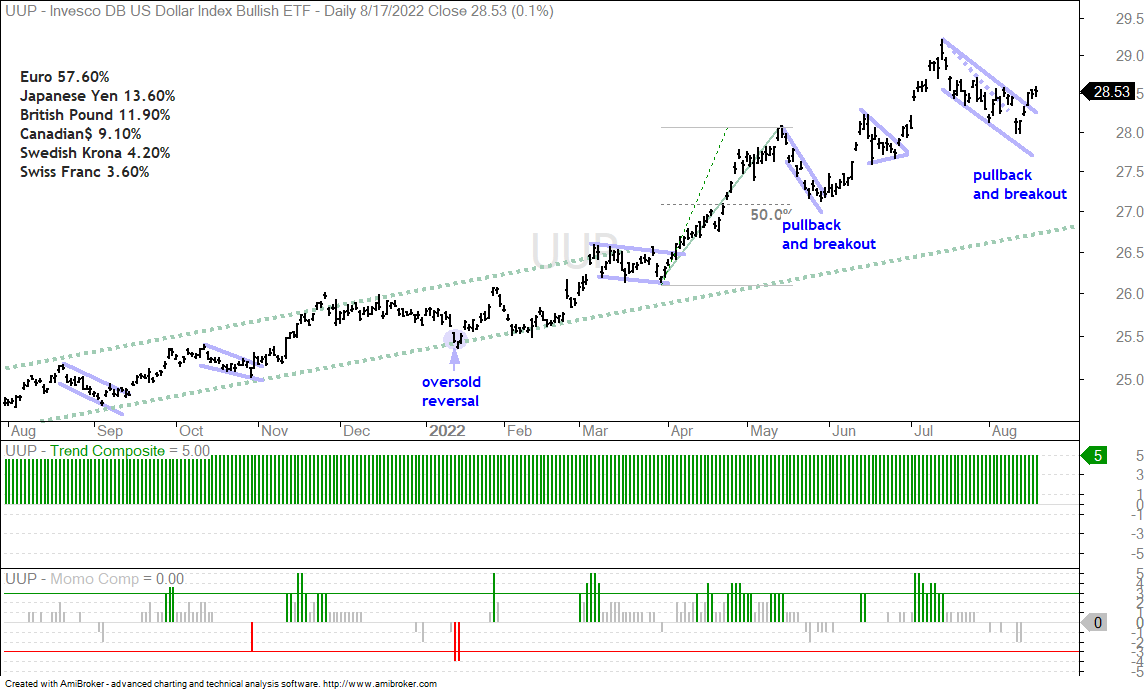
The Dollar seems to benefit from rising Treasury yields. US Treasury bonds offer some of the highest yields in the developed world and this makes them more attractive. Be careful here because there are dozens of macro factors at work with the greenback. Also keep in mind that currencies trade in pairs and there are macro factors at work on the other side (as in the Euro). In any case, the Dollar is in a strong and leading uptrend overall. The pullback into early August is viewed as a correction within this uptrend and the recent breakout is bullish. A close below 28 would argue for a re-evaluation.
You can learn more about exit strategies in this post[4], which includes a video and charting options for everyone.
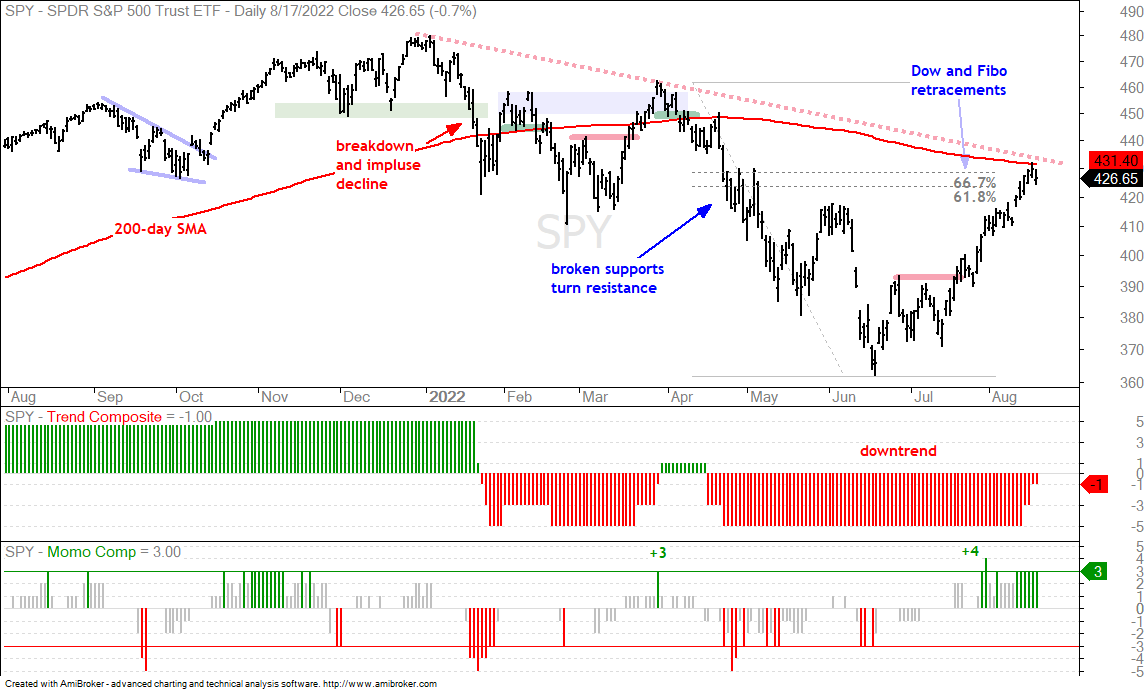
SPY and QQQ Hit Dow-Fibo Retracements
As noted on the Market Regime page[5], the Composite Breadth Model (-1) is at a moment of truth. The S&P 500 Thrust Model and S&P 1500 Thrust Model turned bullish (+2), but the S&P 500 Trend Model, S&P 1500 Trend Model and S&P 500 5/200 cross remain bearish (-3). The 5-day SMA is 1.2% below the 200-day SMA and another push higher could trigger a bullish cross. This would turn the Composite Breadth Model net bullish (+1).
The 200-day SMA represents a big battle zone for the S&P 500 (and SPY). The S&P 500 is the most widely followed benchmark for US stocks and the 200-day SMA is the most widely used long-term moving average. SPY did battle with the 200-day from late January to late March and eventually lost the battle in April. SPY tagged the 200-day SMA with Tuesday’s high and this it a make or break area. Further strength above 440 would likely turn the Composite Breadth Model bullish. For now, the Composite Breadth Model is net bearish, price is below the falling 200-day and the Trend Composite is negative. The weight of the evidence is bearish right now and has yet to be proven otherwise.
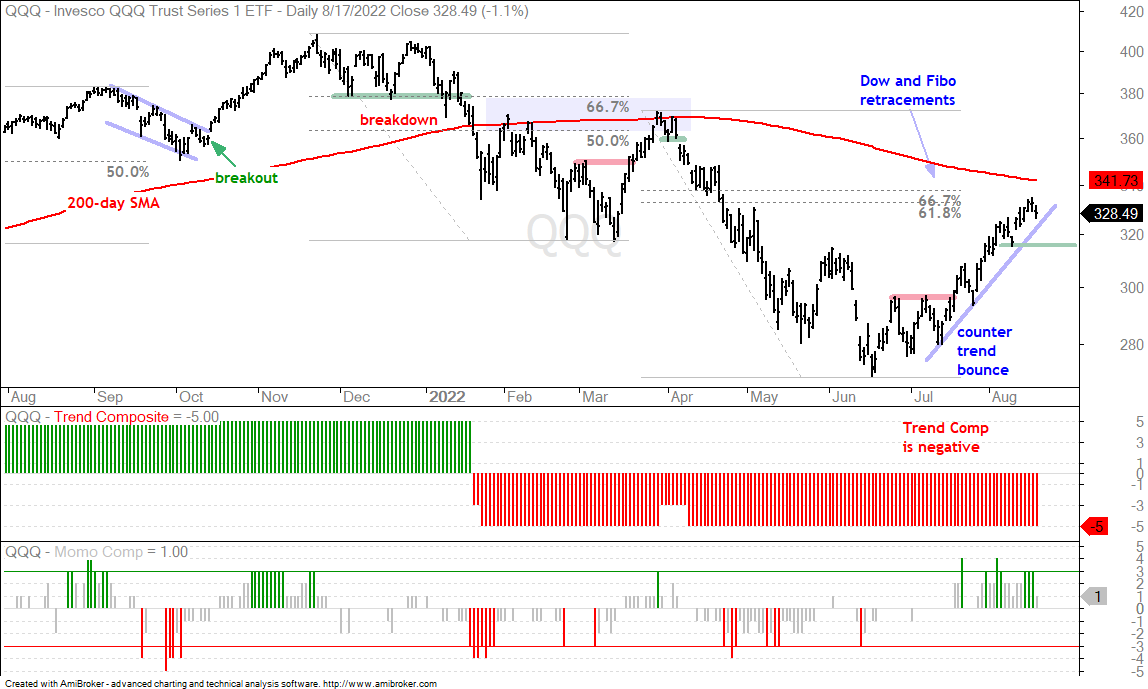
The chart also shows the 66.7% and 61.8% retracements, courtesy of Charles Dow and Leonardo Fibonacci, respectively. A counter-trend bounce would be expected to retrace around two thirds of the prior decline. SPY is above both of these retracement levels, but perhaps this was an overshoot. Overshoots seem to be more frequent these days. In any case, SPY is sitting at a make or break level: either the bulls take over with further strength or we reverse and the bears maintain control. The next chart shows QQQ hitting the retracements just below the falling 200-day.
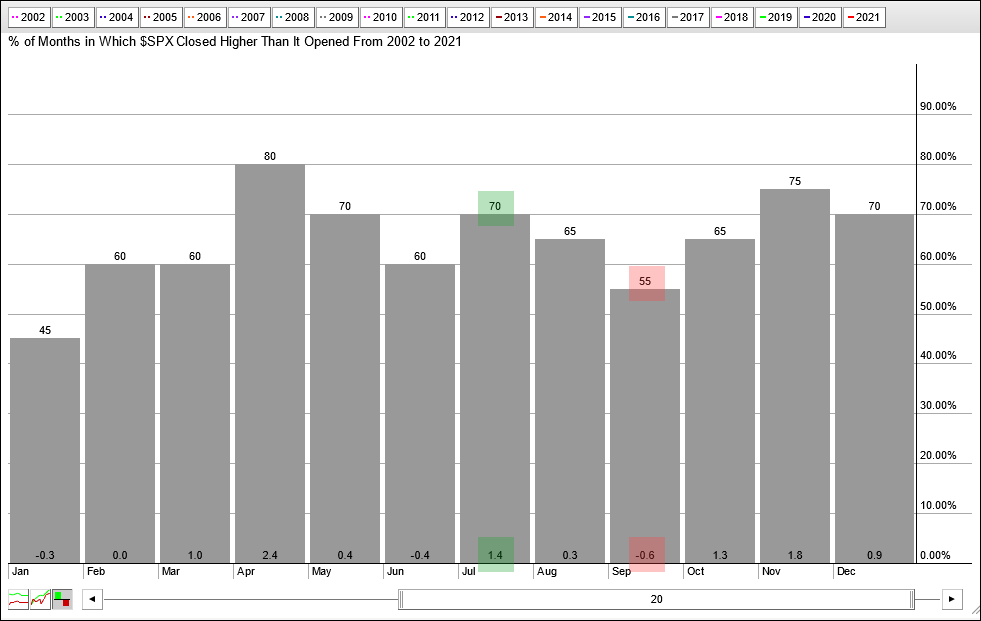
Seasonal Tendency for September is Negative
In the hindsight is 20/20 category, the next chart shows the seasonal tendencies for the S&P 500 from 2002 to 2021 (2022 is not included). Notice that July closed higher 70% of the time and the average gain was 1.4% (green shading). This helps to explain the July advance. August also has a bullish bias, but September has a bearish bias. In fact, it is one of three months with a bearish bias (January, June, September). September closed higher 55% of the time (red shading), but the average change was negative (-.6%). September is not here yet, but we are heading into a seasonally weak period.
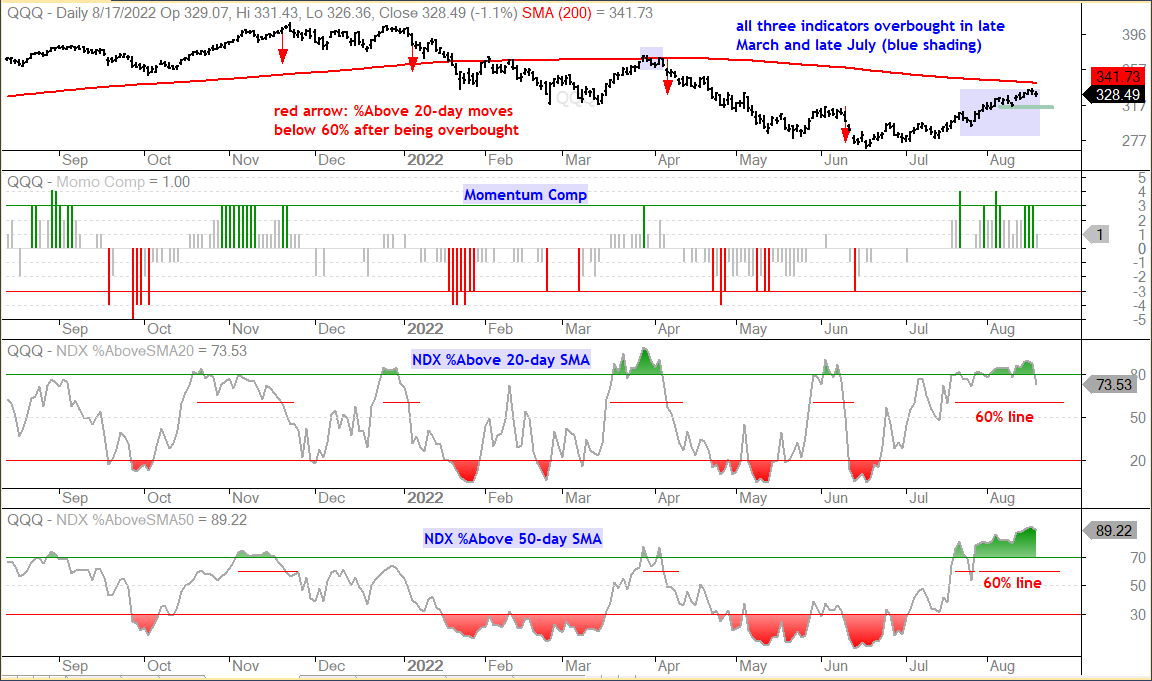
%Above 20-day SMA for SPY and QQQ
So far we have a negative Composite Breadth Model (-1), the S&P 500 5-day below the 200-day, SPY near the falling 200-day and SPY near key retracements. This is a classic spot for a reversal, but the short-term trend has yet to reverse. We must also concede that the surge since mid July was very strong and SPY is remaining overbought, which is a sign of strength. The short-term trend is up until proven otherwise and overbought conditions could persist, which means this uptrend could extend. I am watching %Above 20-day SMA and %Above 50-day SMA for SPX and NDX. The bulls have the edge as long as these above 60%. A move below 60% would show short-term deterioration in breadth and could lead to a pullback or short-term bearish reversal. A move below 60% in SPX %Above 50-day SMA would also be negative.
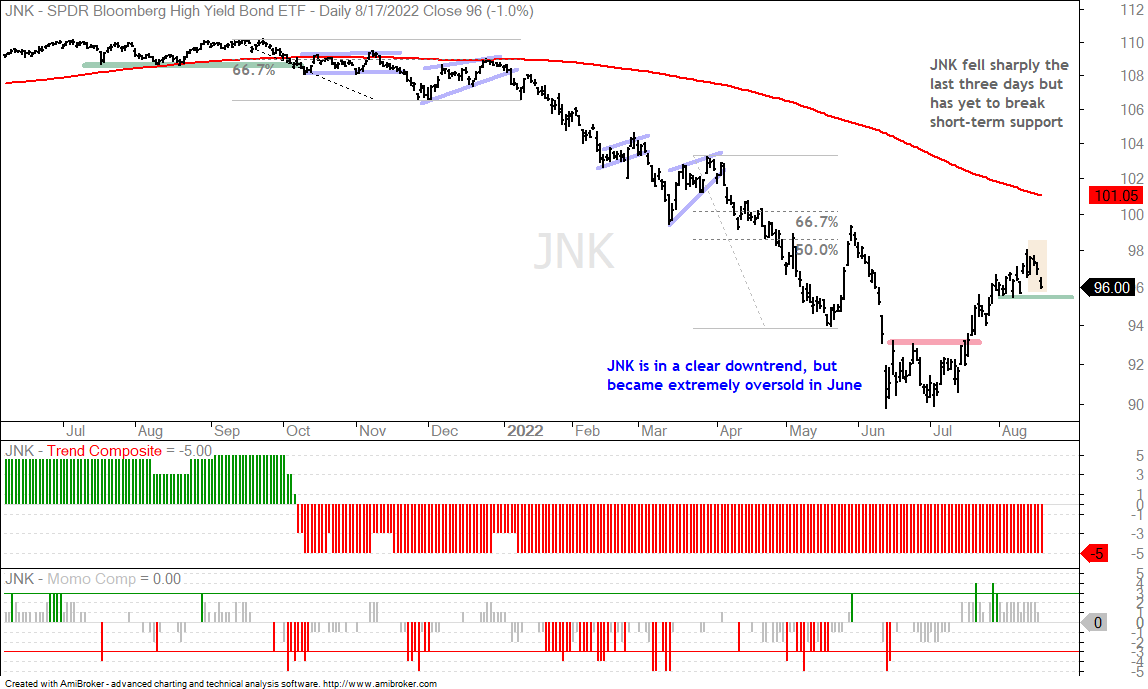
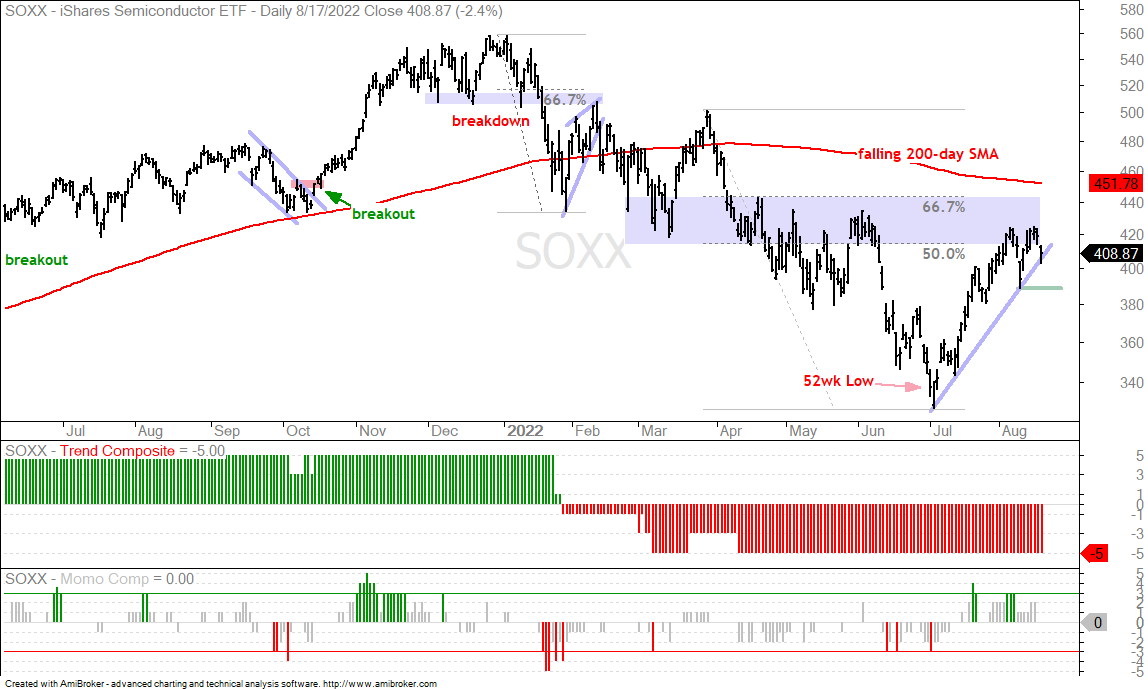
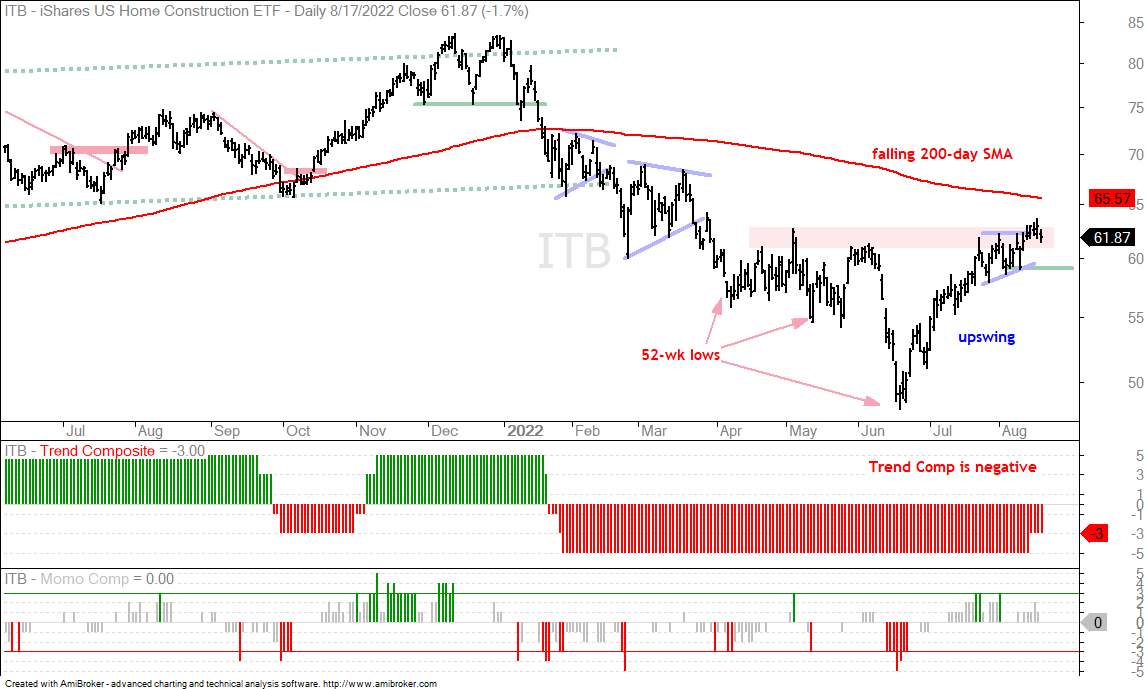
Watching Junk Bonds, Housing and Semis for Clues
JNK, SOXX, ITB
In addition to the breadth indicators above, I am also watching the Junk Bond ETF (JNK), the Semiconductor ETF (SOXX) and the Home Construction ETF (ITB). Junk bonds are the most economically sensitive bonds, semis represent the cyclical tech trade and housing is an important part of the economy. The charts below show all three below their falling 200-day SMAs, but in short-term uptrends right now with the early August lows marking first support. These short-term uptrends are supportive of the short-term uptrend in the broader market. Breakdowns in these three would be negative for the broader market.
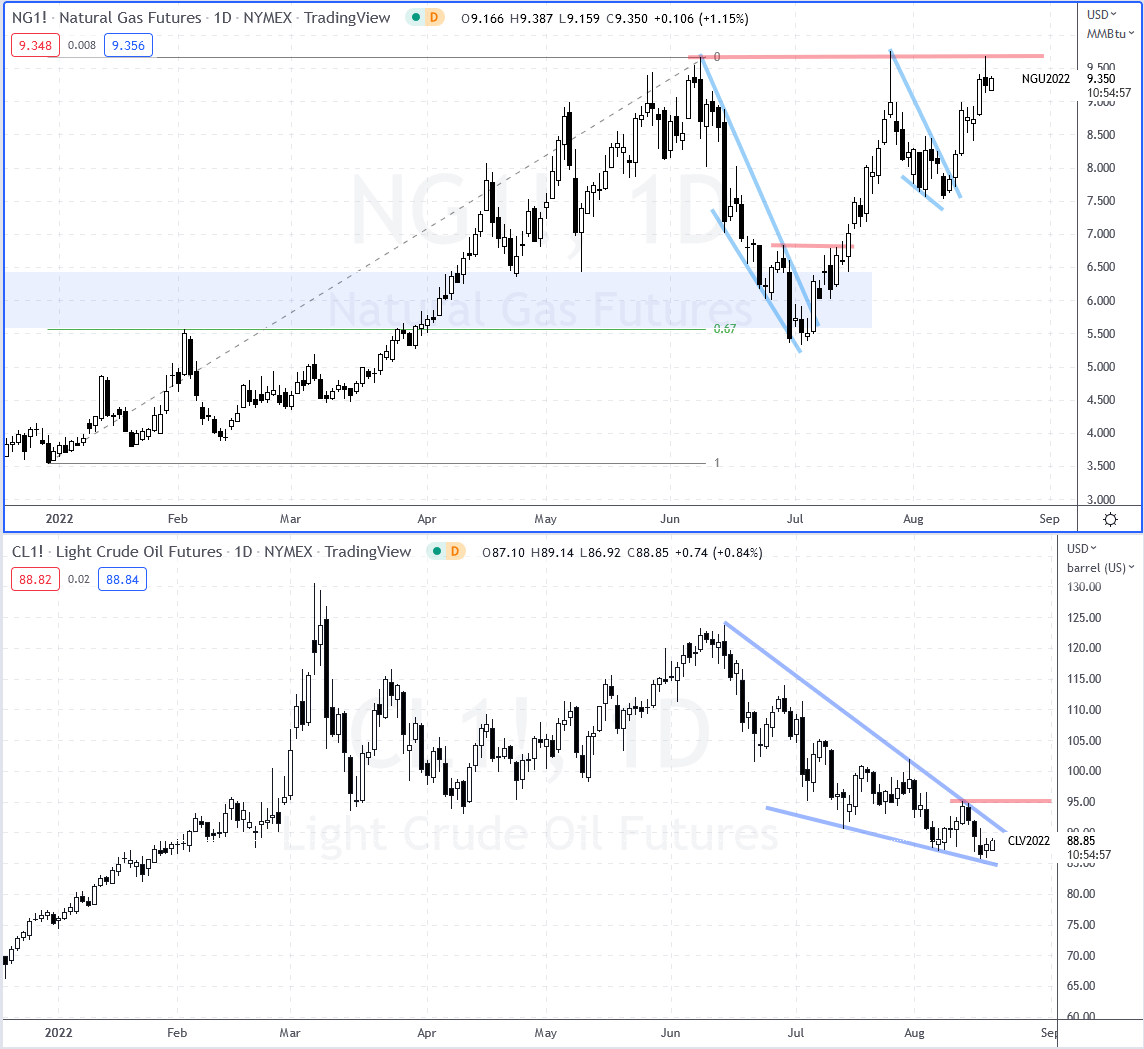
NatGas Forms Bullish Pattern as Oil Forms Falling Wedge
The next chart shows the Natural Gas Futures (NG1!) on top and Light Crude Futures (CL1!) on the bottom. NatGas is trading near its June highs and a cup-with-handle pattern forming. This is a bullish continuation pattern with rim resistance around 9.67 (red line).
Oil remains in a downtrend, but a falling wedge is taking shape. The lower line of the wedge shows less downside momentum from July to August because its slope is less steep than the upper line. Despite less downside momentum in August, the immediate trend is down and a breakout at 95 is needed to reverse this downtrend.
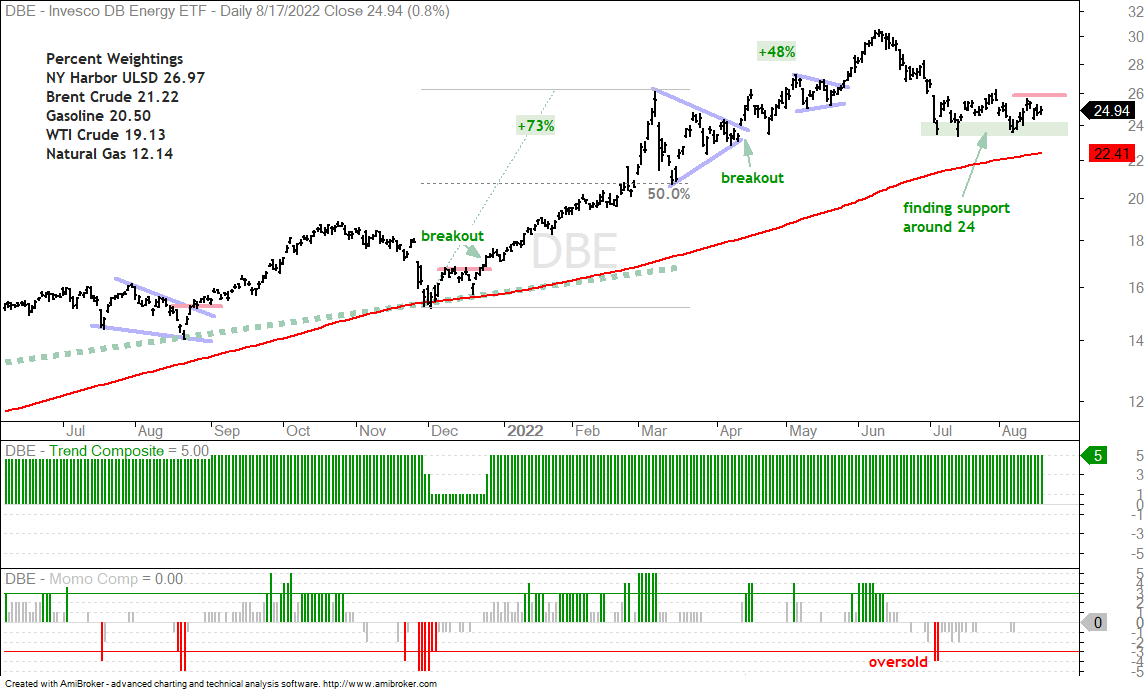
The DB Energy ETF (DBE) is holding up because of strength in NatGas, but not moving higher because of weakness in oil. A breakout in oil would be bullish for DBE and I am watching 26 for a breakout. Such a move would be positive for energy-based shares too.
Small-cap Energy ETF Forms Pennant (PSCE)
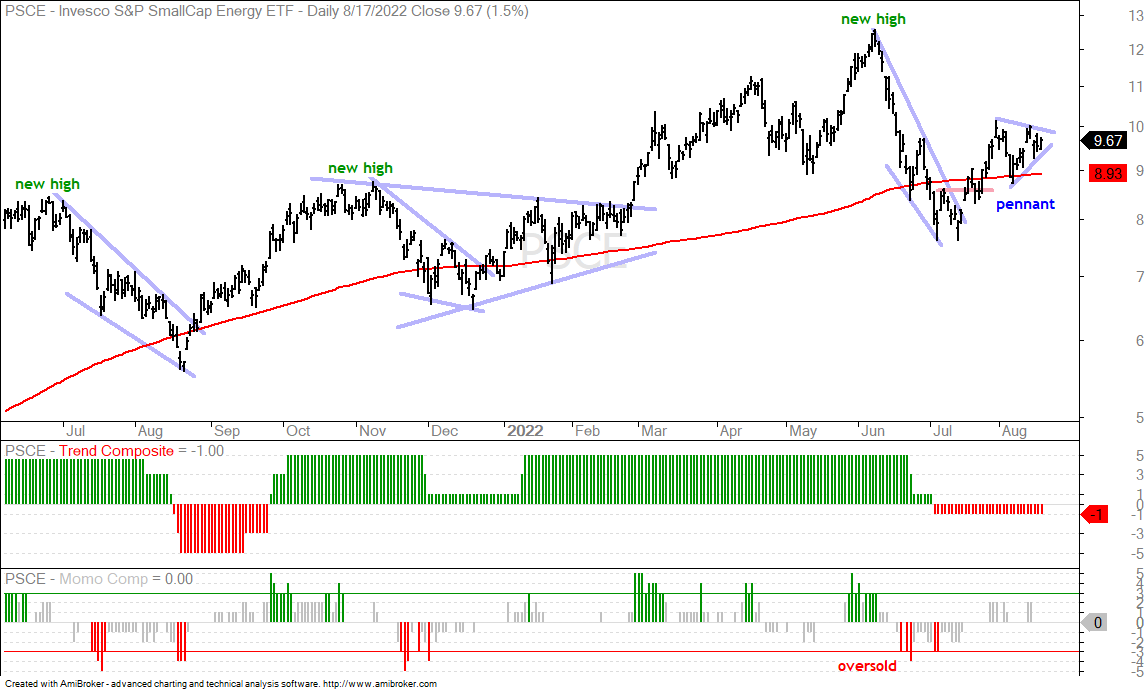
The Small-cap Energy ETF (PSCE) acts like the Oil & Gas Equipment & Services ETF (XES) in that it is more volatile than the Energy SPDR (XLE). Even though the Trend Composite turned negative, this one remains on my radar because it is above its rising 200-day SMA and it hit a new high in June. The falling wedge into July looks like one of those overshoots. Short-term, PSCE is forming a pennant after the surge in the second half of July. This is a short-term bullish continuation pattern and a breakout would be bullish.
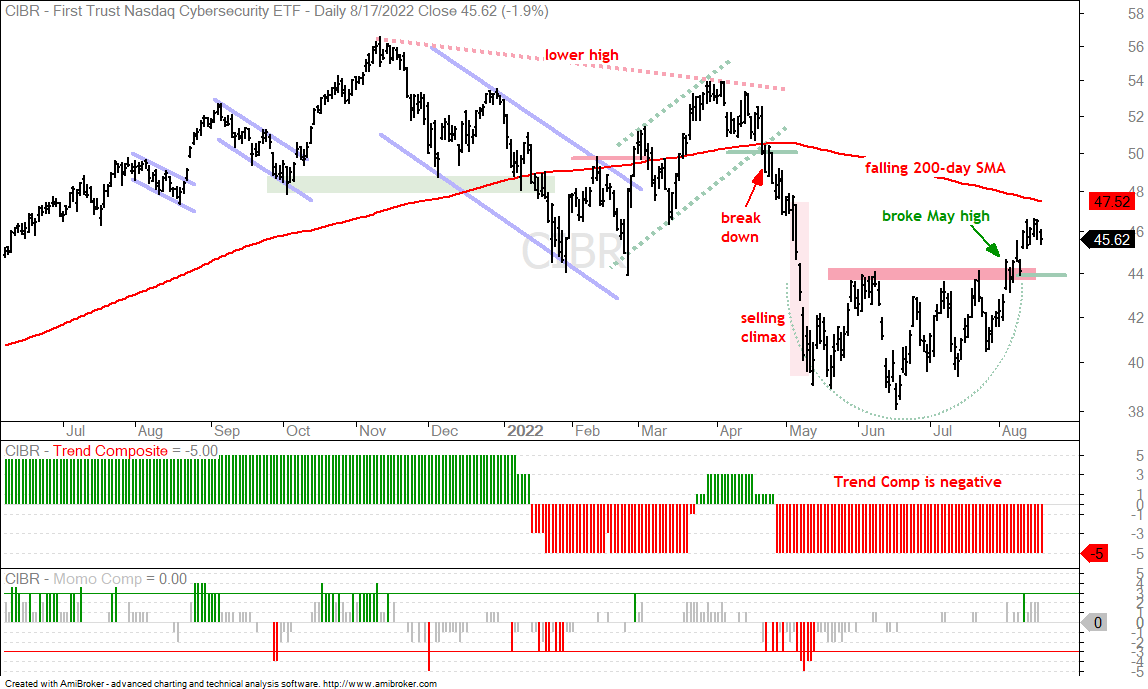
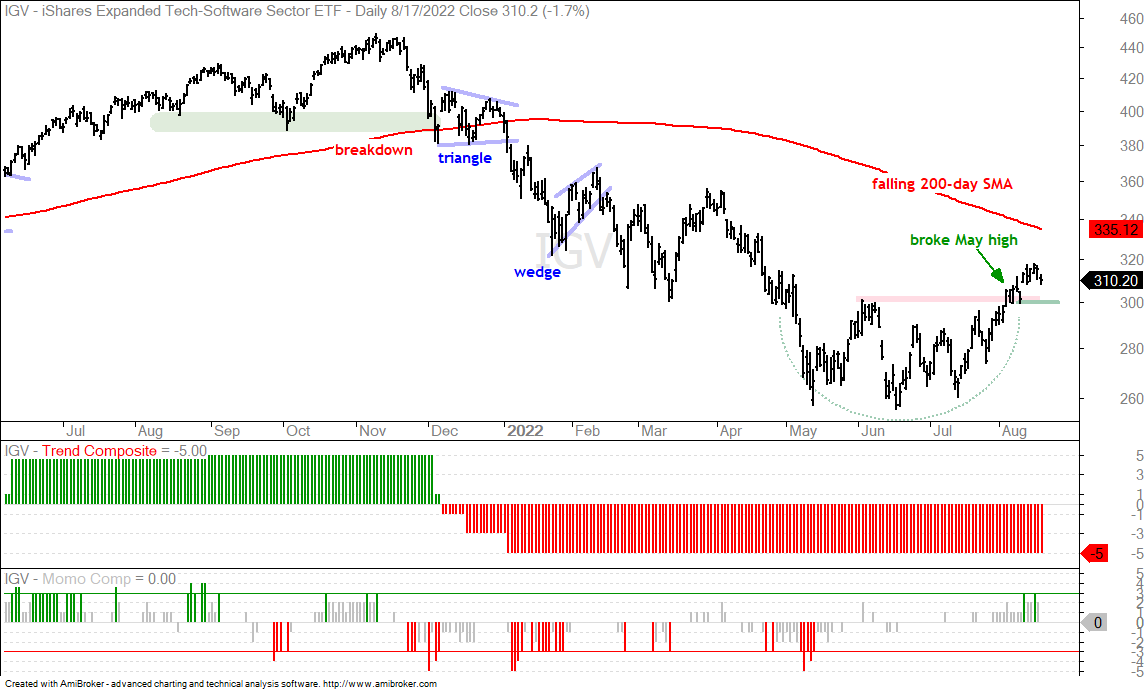
Tech ETFs Hold Breakouts, but Underperform
SKYY, CIBR, IGV, FDN
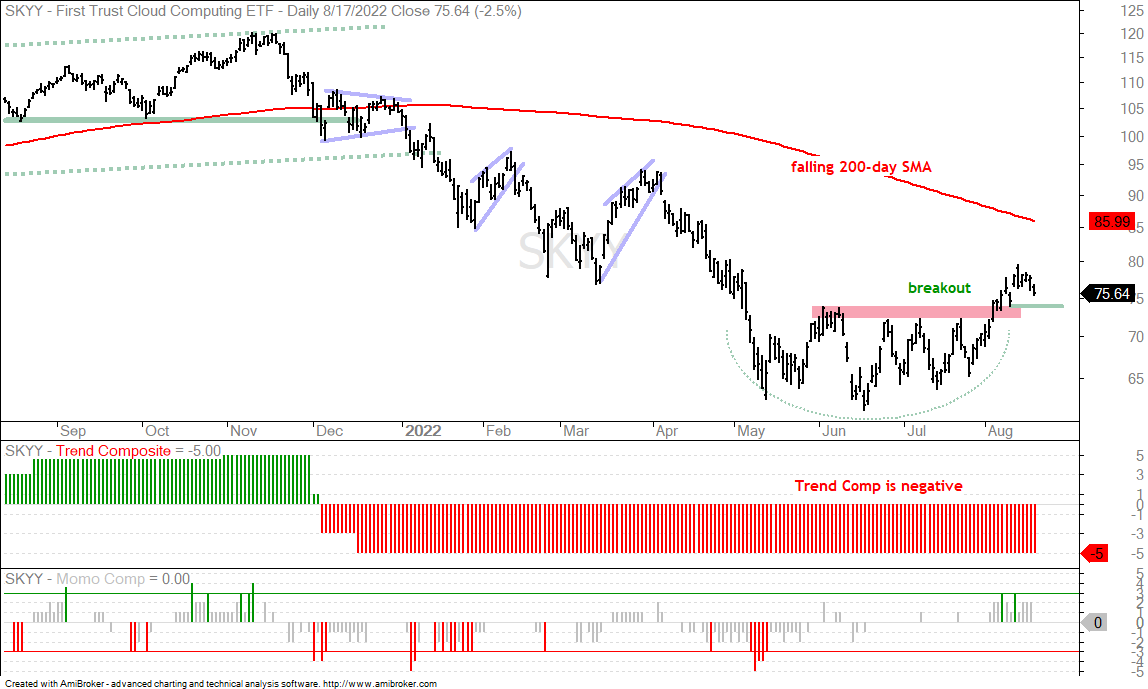
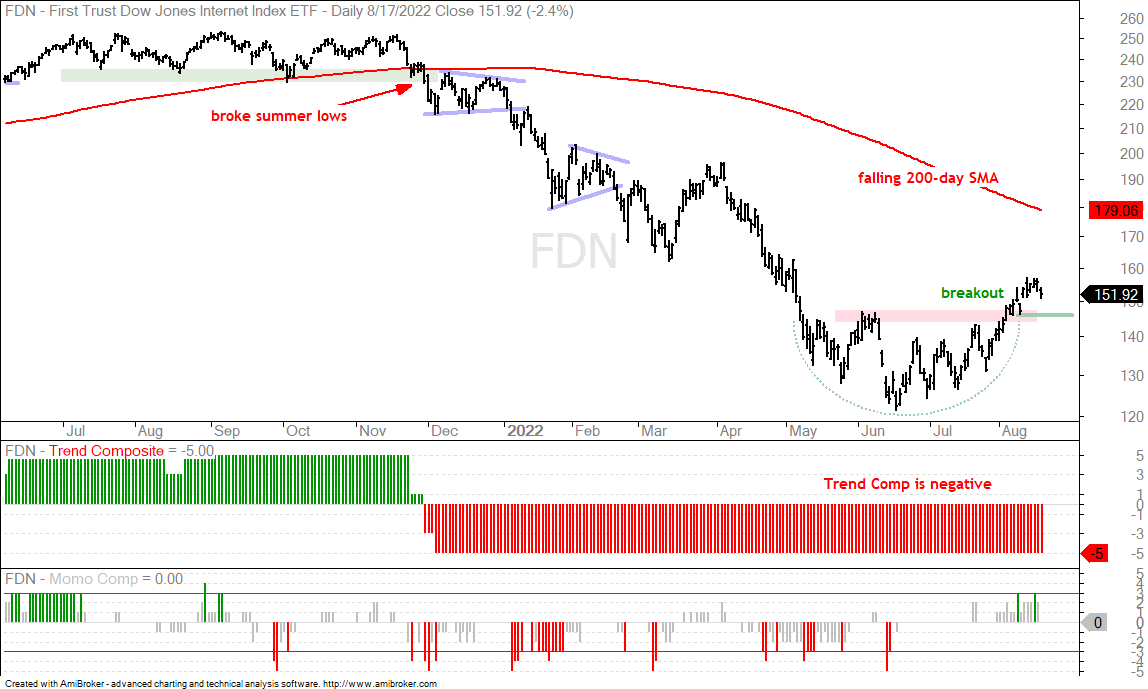
Several tech-based ETFs established support from May to July and broke above resistance in August. Despite these breakouts, the Trend Composites are still negative and these ETFs are well below their falling 200-day SMAs. The short-term breakouts, however, are holding as these ETFs have yet to break back below the breakout zone. The green lines mark support from the early August lows and these are the first levels to watch. Note that tech ETFs represent the risk-on high-beta trade and they are important market barometers. They are showing some risk-on right now and supporting the short-term uptrends in SPY and QQQ. Short-term breakdowns would show risk aversion in the stock market.
You can learn more about the ATR Trailing Stop and exit strategies in this post[4], which includes a video and charting options for everyone.
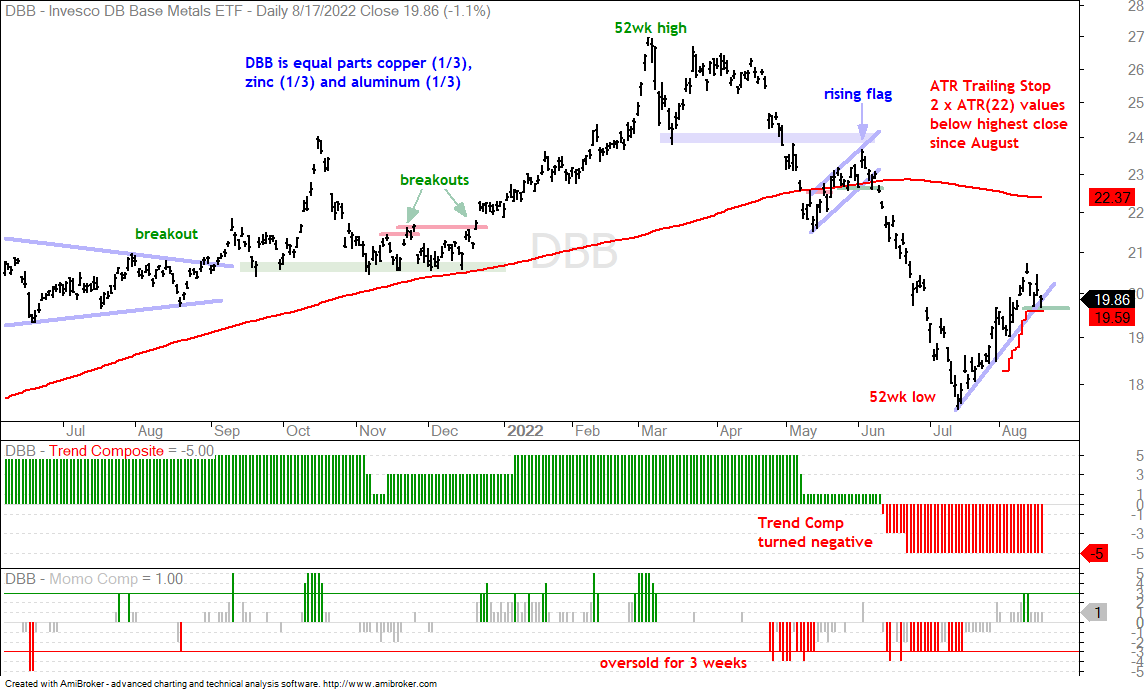
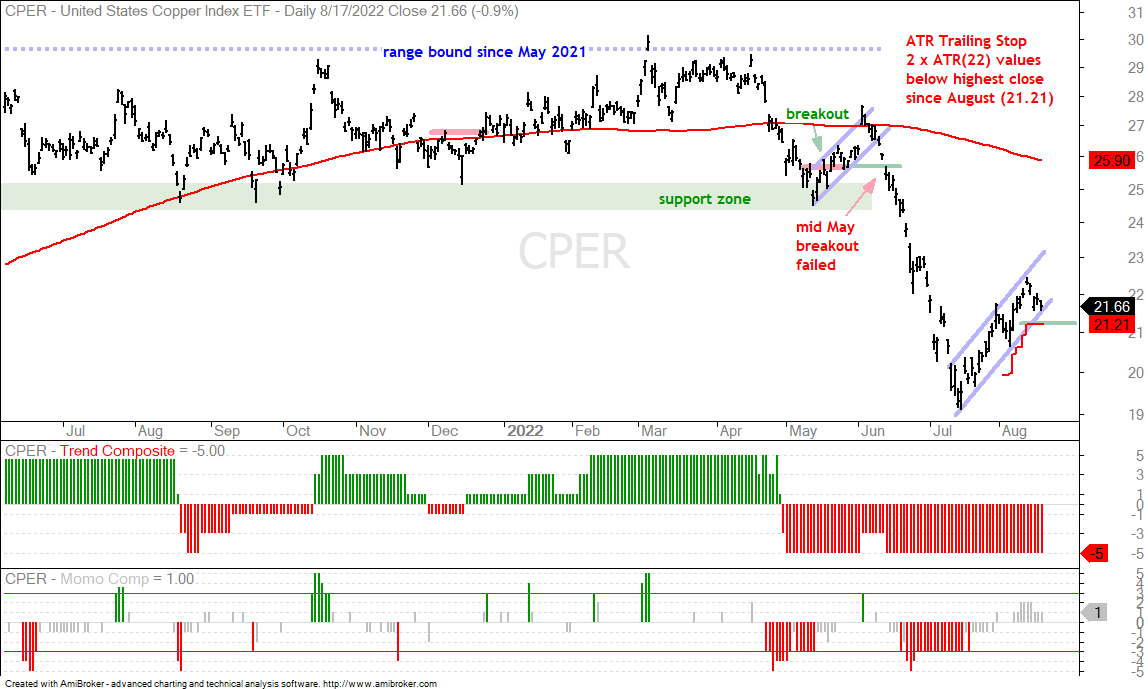
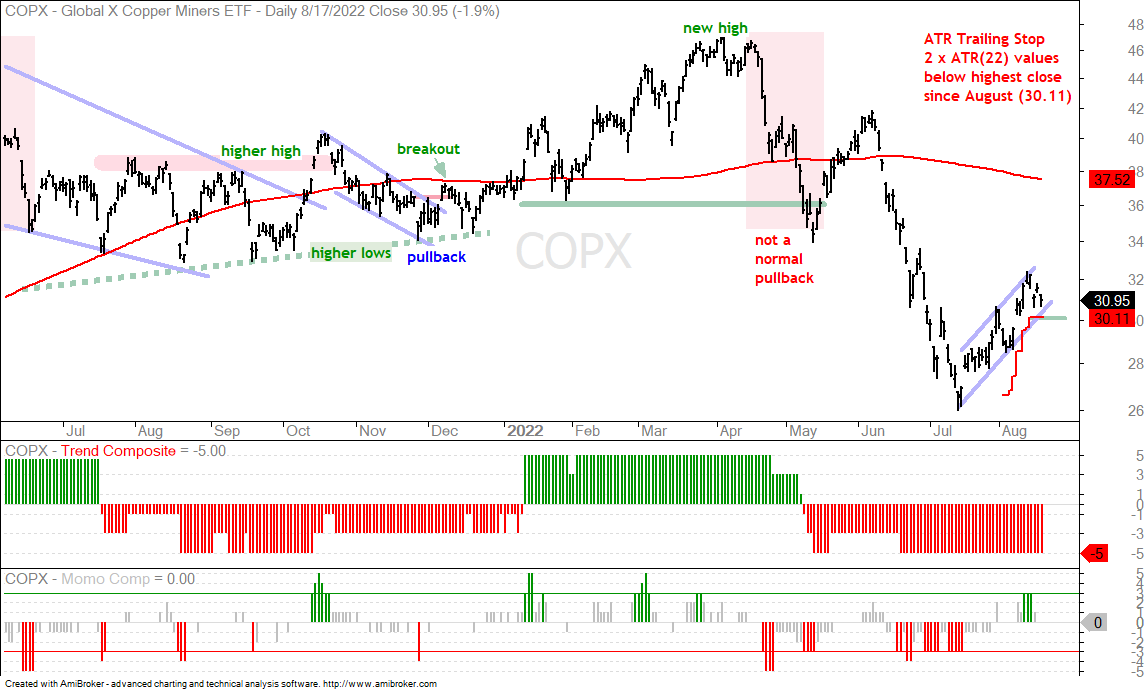
Short-term Uptrends in Base-Metals ETFs (DBB, CPER, COPX)
The DB Base Metals ETF (DBB) has been following the stock market higher since July, but this advance is deemed a counter-trend move within a bigger downtrend. DBB broke down in May-June and hit 52-week lows into July. The ETF is up sharply from its July lows and in a short-term uptrend. I consider this a counter-trend move simply because the bigger trend is down and this bounce pales relative to the June-July decline.
As with SPY and others, the short-term trend for DBB is up until proven other wise. Sometimes we see a trend and wonder how to jump on with a stop-loss. The red line marks the ATR Trailing Stop, which is two ATR(22) values below the highest close since early August. This can be used for traders looking to jump on this short-term uptrend. A close below the ATR Trailing Stop would break this week’s low and reverse the short-term uptrend. The other charts shows Copper ETF (CPER) and Copper Miners ETF (COPX) with the ATR Trailing Stop.
The Trend Composite aggregates signals in five trend indicators: Bollinger Bands (125,1), Keltner Channels (125,2), 5-day Rate-of-Change of 125-day SMA, StochClose (125,5) and CCI-Close (125). The Trend Composite and ten other indicators are part of the TIP Indicator Edge Plugin for StockCharts ACP[3]