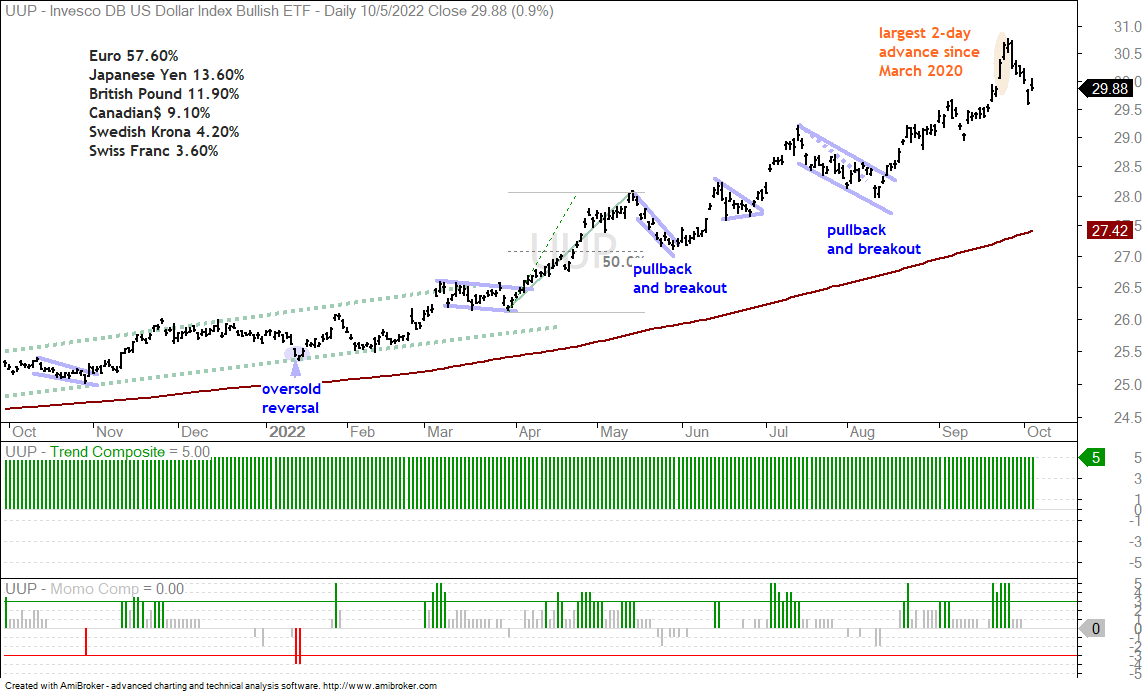
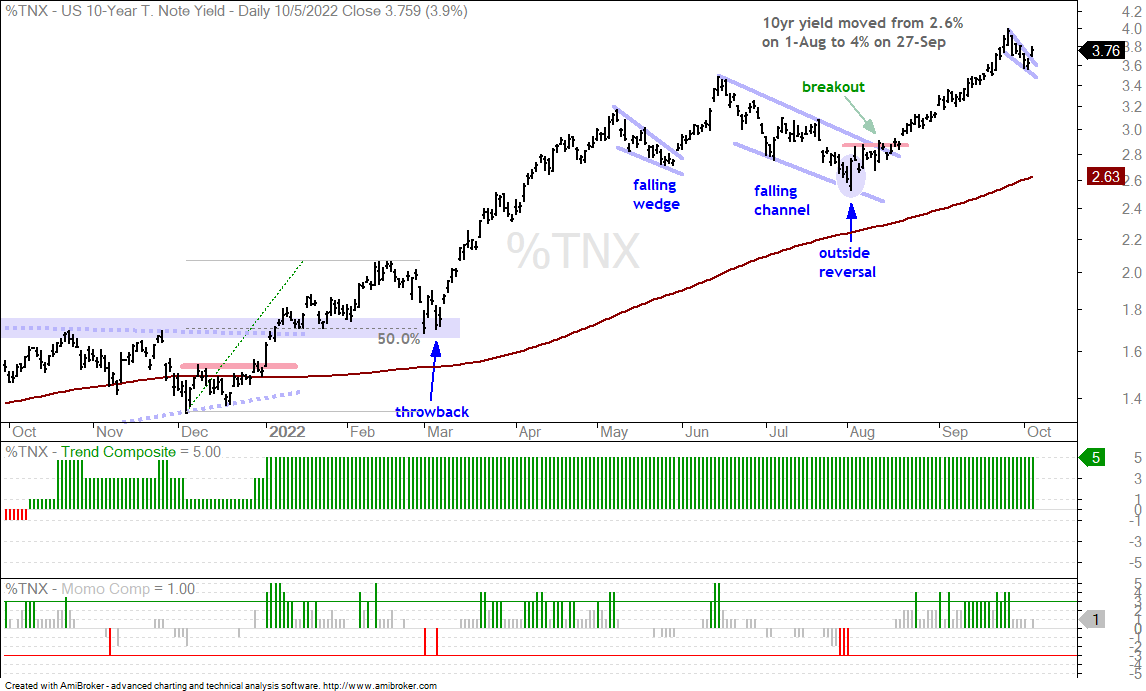
The Dollar finally took a breather from its rapid ascent with a four day pullback and we also saw the 10-yr Treasury Yield fall from around 4% to 3.6%. The Dollar represents the risk-off trade so the pullback facilitated a bounce in stocks. Also note that Treasury yields and stocks have been negatively correlated so the pullback in yields was also welcome news for stocks. Despite pullbacks in the Dollar and 10-yr Treasury Yield, the long-term trends are up and these are just pullbacks within bigger uptrends. Both got overextended on the upside and a pullback is normal at this stage.
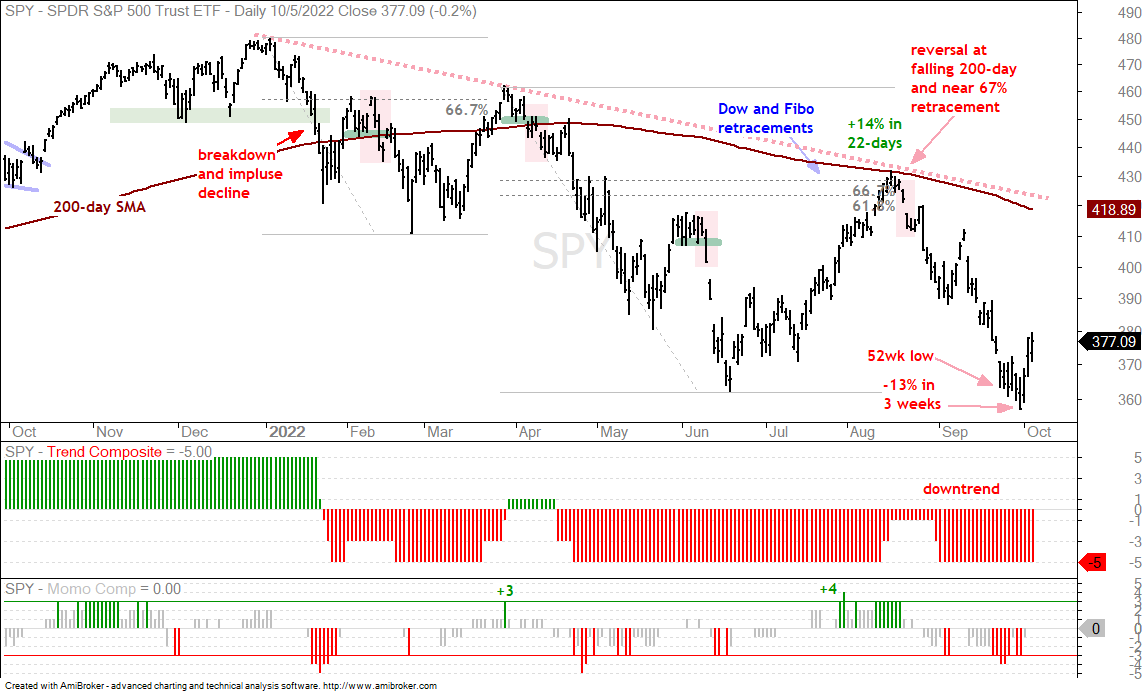
On the flip side, SPY was down some 13% in three weeks and extremely oversold. We were also at the beginning of the month, a new quarter started and seasonal patterns are positive in October. In short, it was the perfect storm for an oversold bounce. The current bounce alleviated oversold conditions, but is not nearly enough to call for a long-term trend reversal. It is just an oversold bounce within a bigger downtrend at this stage. Also keep in mind that the 10-yr Treasury Yield and Dollar Bullish ETF are still in long-term uptrends.
About the ETF Trends, Patterns and Setups Report
This report contains discretionary chart analysis based on my interpretation of the price charts. This is different from the fully systematic approach in the Trend Composite strategy series. In this ETF Trends, Patterns and Setups report, I am looking for leading uptrends and tradable setups within these uptrends. While I use indicators to help define the trend and identify oversold conditions within uptrends, the assessments are mostly based on price action and the price chart (higher highs, higher lows, patterns in play). Sometimes the chart assessment can be at odds with the indicators.
This Week's Commentary Schedule
Tuesday – 4 October: Market-ETF Report and Signal-Rank Table Update
Wednesday – 5 October Market-ETF Video and Market Regime Update
Thursday – 6 October: Market-ETF Report and Signal-Rank Table Update
Saturday – 8 October: ETF Signal and Rank Table
A HandFul of ETFs Holding Up
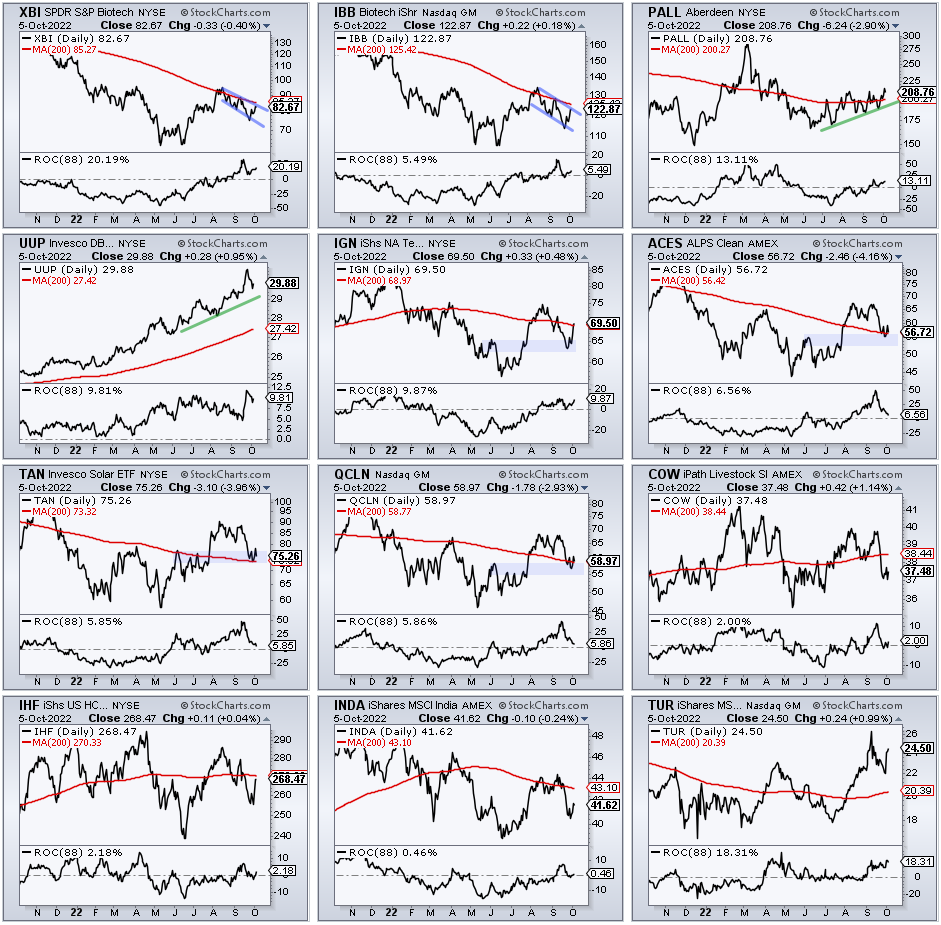
Note that only 15 of the 274 ETFs in the Master List are up since June (88 days). These include SBIO, XBI, TUR, PALL, UUP, IGN, ARKG, ACES, TAN, QCLN, IBB, COW, IHF, INDA and BBH. This list includes representatives from biotech (SBIO, XBI, IBB, BBH, ARKG), clean energy (TAN, ACES, QCLN) and, of course, the Dollar (UUP). The image below shows line charts for these ETFs with the 88-day Rate-of-Change. All are above their summer lows and holding up better than SPY. However, note that the stock-based ETFs fell along with the rest of the market from mid August to late September and were not immune to broad market weakness. The blue shading shows the clean energy ETFs at their moment of truth. The green lines highlight the four month advance in the two leaders (PALL, UUP).
I ran another scan to identify the leaders over the last three, six, nine and twelve months. Only 10 of the 274 ETFs are positive on all four timeframes, which means they show relative strength on all four timeframes. These include AMLP, DBE, FCG, JO, PALL, RYE, TUR, UUP, XLE and XOP. Energy clearly stands out in this scan with seven of the ten coming from these sectors. Outside of energy, the Palladium ETF (PALL), Turkey ETF (TUR) and Dollar Bullish ETF (UUP) are also showing relative strength.
The Momentum Composite aggregates signals in five momentum-type indicators to identify short-term overbought and oversold conditions. This indicator is part of the TIP Indicator Edge Plugin for StockCharts ACP[1]
Palladium ETF Grinds Higher (PALL)
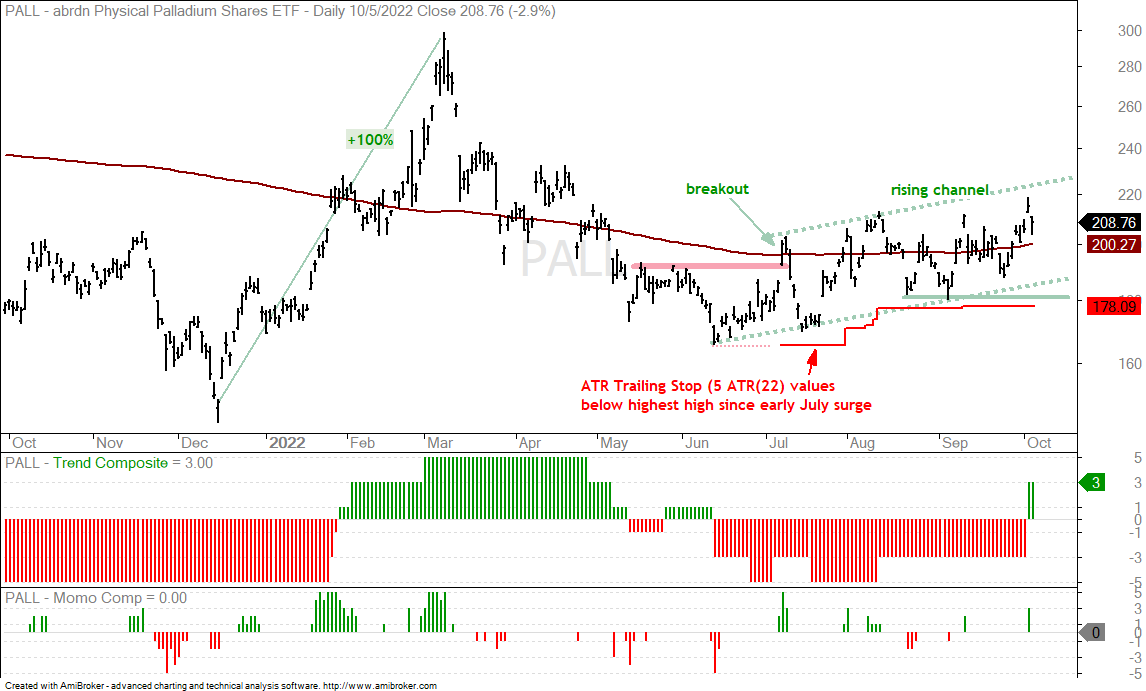
The Palladium ETF (PALL) remains in a grinding uptrend since the initial breakout surge in early July (green arrow). In fact, it is a leading ETF since June with a 13% gain. The chart shows a rising channel with higher highs and higher lows the last four months (green dashed lines). The brown line is the 200-day SMA and it turned up in mid September. The August-September lows mark support and the ATR Trailing Stop is set at 178.09 (call it 178). A close below 178 would break channel support and call for a re-evaluation.
You can learn more about exit strategies in this post[2], which includes a video and charting options for everyone.
Coffee ETF Battles Breakouts (JO)
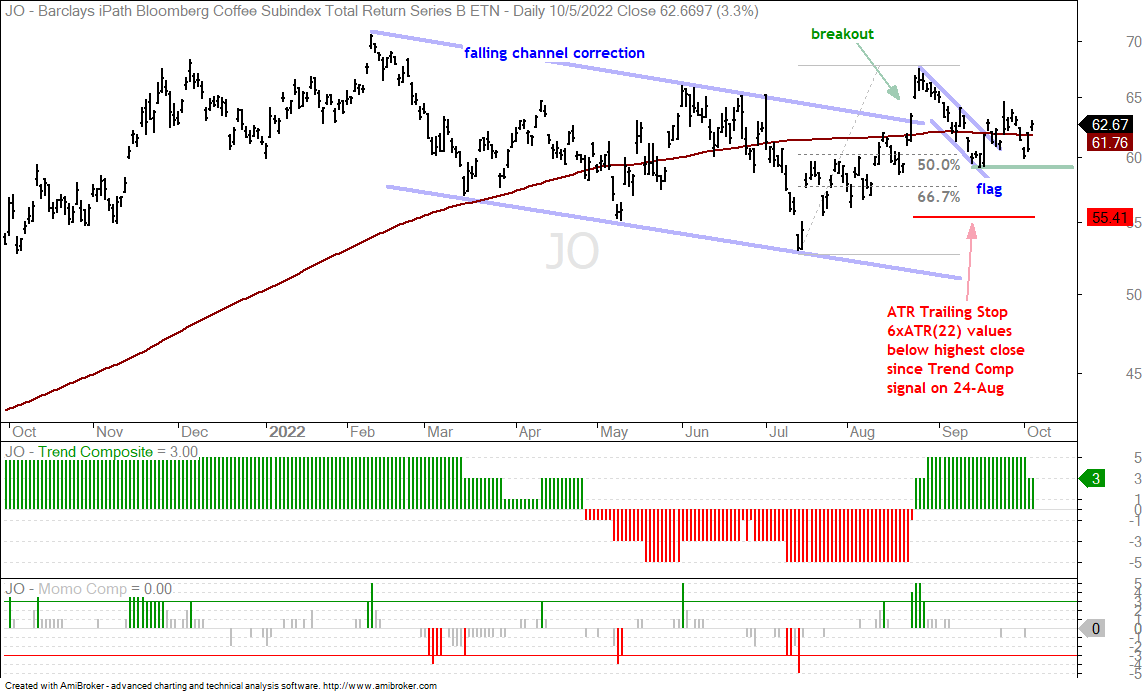
The Coffee ETF (JO) has two breakouts working and is fighting to keep these alive as it gyrates around the 200-day SMA. Long-term, the falling channel from February to August marked a long correction and JO broke out with a surge in late August. The ATR Trailing Stop starts with the Trend Composite signal and is set at 55.41. Short-term, JO fell back after the breakout surge, formed a falling flag and broke out of the flag. The flag is a short-term correction and the breakout is bullish, provided it holds. The flag low marks first support (green line) and a close below 59 would call for a re-evaluation.
The Trend Composite aggregates signals in five trend indicators: Bollinger Bands (125,1), Keltner Channels (125,2), 5-day Rate-of-Change of 125-day SMA, StochClose (125,5) and CCI-Close (125). The Trend Composite and ten other indicators are part of the TIP Indicator Edge Plugin for StockCharts ACP[1]
DB Agriculture ETF Forms Small Rising Flag (DBA)
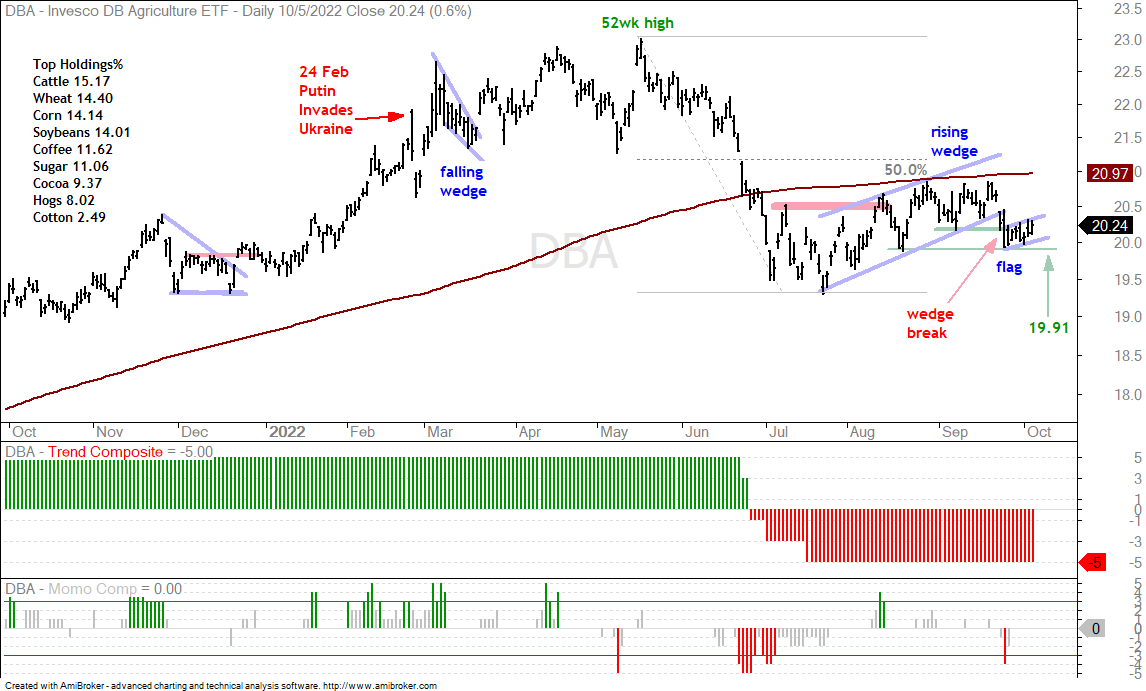
The DB Agriculture ETF (DBA) is hanging on by a thread after the wedge break on 26-Sept. Despite this wedge break, the ETF is well above its summer lows and holding up better than most stock-based ETFs. The sharp wedge decline created an oversold condition as the Momentum Composite hit -4 and the ETF bounced the last seven days. This bounce, however, is looking like a small rising flag, which is a bearish continuation pattern. A flag break at 20 would argue for further weakness and a push below the mid August closing low (19.1)
You can learn more about my chart strategy in this article[3] covering the different timeframes, chart settings, StochClose, RSI and StochRSI.
Watching the Grains for Clues on DBA
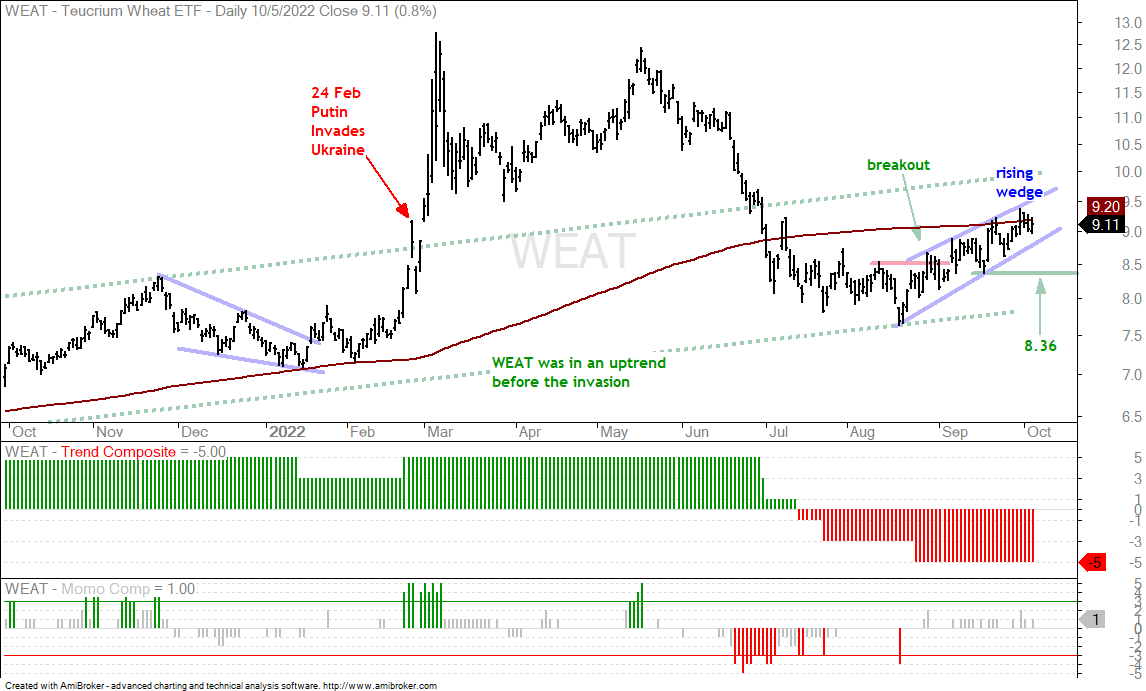
The three grains, wheat, soybeans and corn, account for some 42% of DBA and could hold the key. Also note that coffee weighs in at 11.62%. Corn and wheat are positively correlated and move in the same direction. Soybeans are less positively correlated to corn and wheat, but still positive. Note that all three fell from May to July and rose in August-September. The first chart shows the Wheat ETF (WEAT) with a rising wedge after the steep decline from June to August. The immediate trend is up as long as the wedge rises. A close below 8.36 would break the mid September low and negate the breakout.
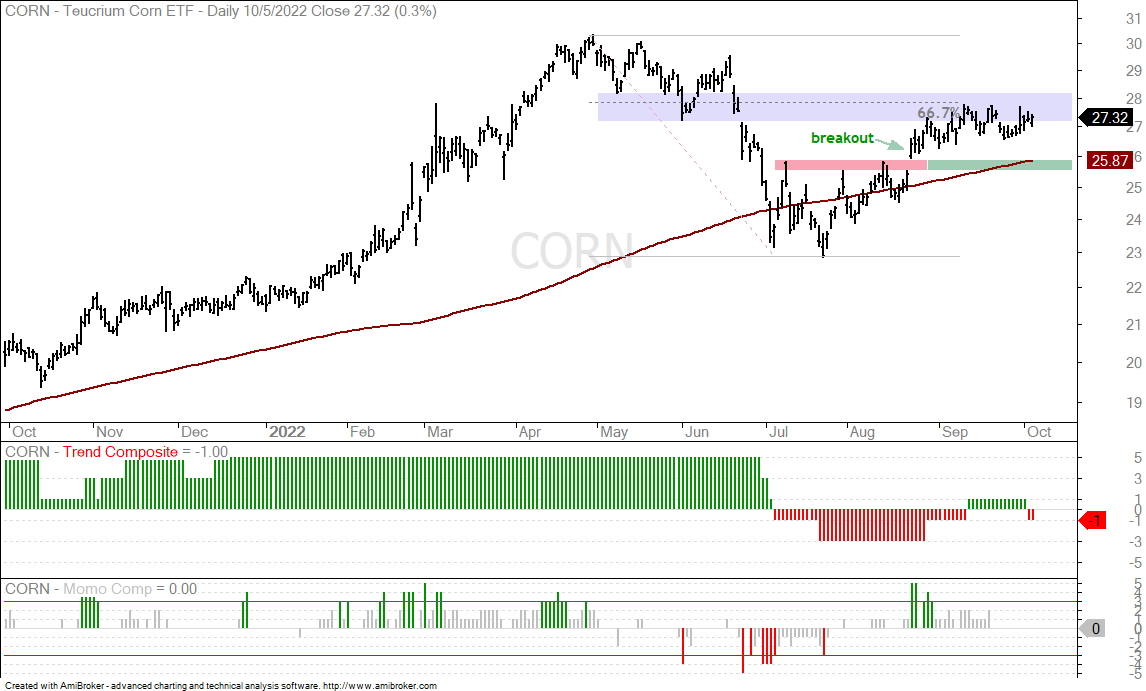
The next chart shows the Corn ETF (CORN) with an advance since mid July. The ETF is above its rising 200-day SMA and holding up better than most. The current advance retraced around 2/3 of the prior decline and there is potential resistance from broken support (blue shading). This is a potential resistance-reversal zone. For now, the immediate trend is up and I am watching the prior breakout zone for a reversal signal. The breakout zone (red) turns into support (green) and the rising 200-day is also in this area. A close below 25.4 would break support and be bearish for CORN.
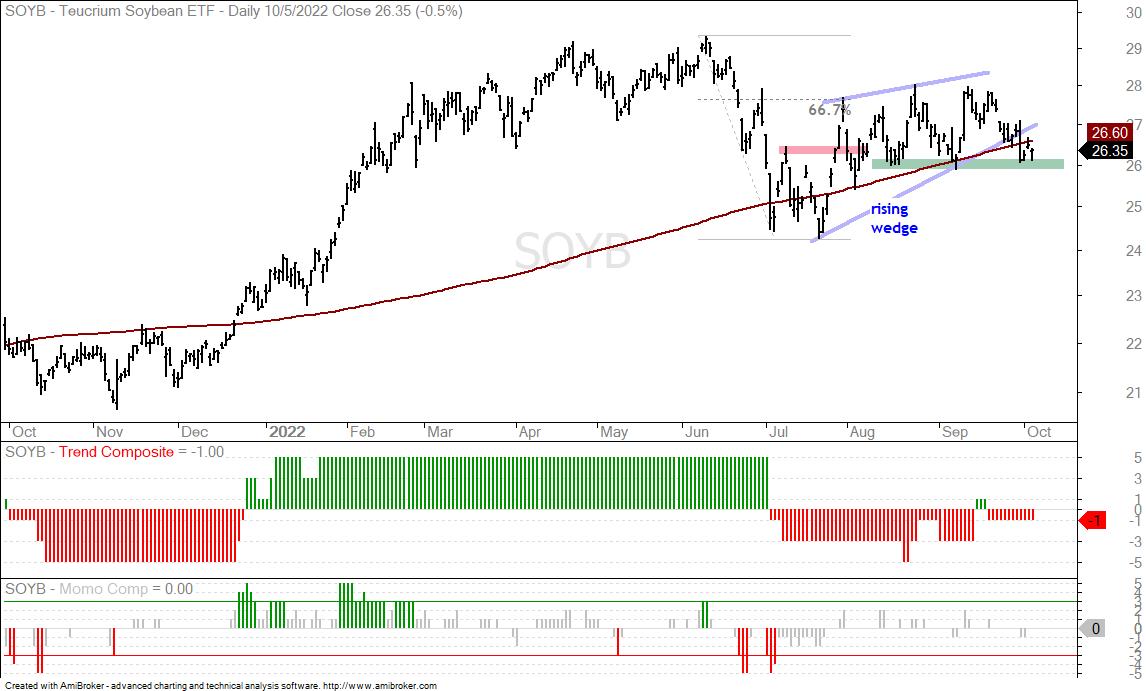
The Soybean ETF (SOYB) broke a rising wedge line with a sharp decline on Monday and is at its make or break level. The green line marks the August-September lows (support) and a break here would reverse the uptrend since summer.
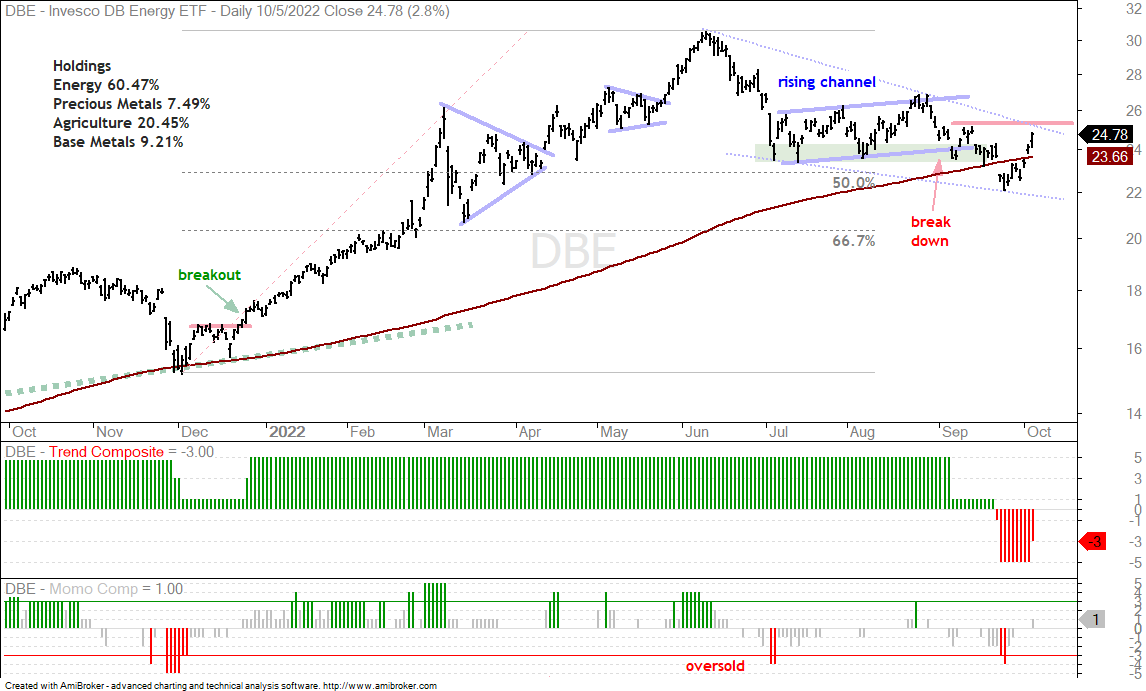
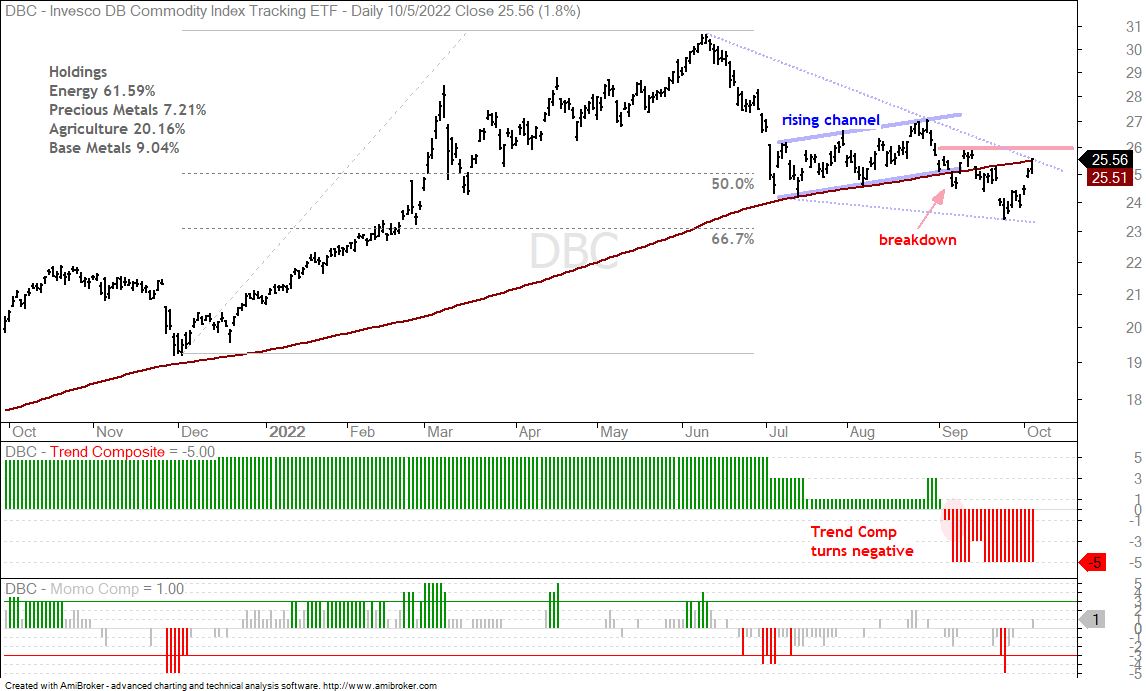
Moment of truth for Crude and DBE
Oil surged some 15% the last seven days and gasoline was up 13% the first two days of October. These are big short-term moves, but within bigger downtrends and the DB Energy ETF (DBE) is at its moment of truth. My base case is bearish for DBE because I view the rising channel as a counter-trend bounce and the early September break was bearish. DBE dipped below the 200-day SMA and then surged the last seven days. At this point, I must consider an alternative that would prove my bearish stance wrong. The dotted lines mark a possible falling wedge that retraced 50-67% of the December-June advance. The early September high marks resistance (red line) and a break above this level would negate the channel break. It would also put the falling wedge into play and signal a continuation of the prior advance. Will OPEC+ get its way with higher oil prices? The second chart shows DBC with similar characteristics.