About the ETF Trends, Patterns and Setups Report
This report contains discretionary chart analysis based on my interpretation of the price charts. This is different from the fully systematic approach in the Trend Composite strategy series. In this ETF Trends, Patterns and Setups report, I am looking for leading uptrends and tradable setups within these uptrends. While I use indicators to help define the trend and identify oversold conditions within uptrends, the assessments are mostly based on price action and the price chart (higher highs, higher lows, patterns in play). Sometimes the chart assessment can be at odds with the indicators.
This Week's Commentary Schedule
- Tuesday – 16 August: Market-ETF Report and Signal-Rank Table Update
- Wednesday – 17 August Market-ETF Video and Market Regime Update
- Thursday – 18 August: Market-ETF Report and Signal-Rank Table Update
- Saturday – 20 August: ETF Signal and Rank Table
You can learn more about my chart strategy in this article [1] covering the different timeframes, chart settings, StochClose, RSI and StochRSI.
Dollar, Defensive and Clean Energy Lead
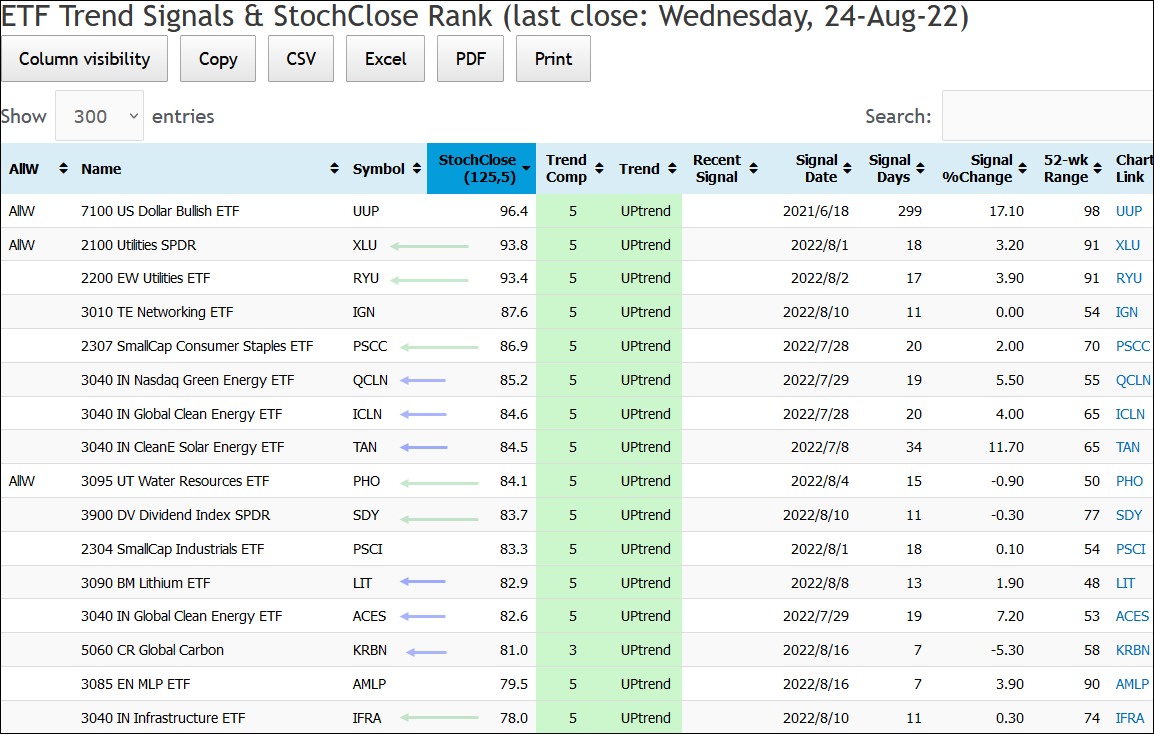
The table below shows the ETFs with the highest StochClose (125, 5) values. Values close to 100 indicate that price is near a 6-month high, values near 50 mean price is in the middle of its 6-month range and values near 0 indicate that price is near a 6-month low. Those looking for a 12-month picture can sort by the 52-week range column. I prefer 6 months. There are three standouts on this table. First, the green arrows show that defensive ETFs are leading (Utilities, Staples, Dividends). Second, the blue arrows show strength in clean energy ETFs (QCLN, ICLN, TAN, LIT, ACES, KRBN). Third, the Dollar is the strongest ETF of all. This is probably because the Euro accounts for 57.6% of its holdings and winter is coming.
Utilities, Dividends and Staples Holding Up
The Utilities SPDR (XLU), Infrastructure ETF (IFRA), Select Dividend ETF (DVY) and Food & Beverage ETF (PBJ) represent the risk-off defensive trade in the stock market (as opposed to the risk-on offensive trade). Note that Utilities account for 42% of IFRA and 28% of DVY. Utilities offer above average yields and their earnings could grow simply because of energy-related inflation. Note that these ETFs have relatively low volatility. Year-to-date percentage changes are as follows: XLU +6.76%, IFRA -.39%, DVY +1.73%, PBJ +5.04% and SPY -12.90%.
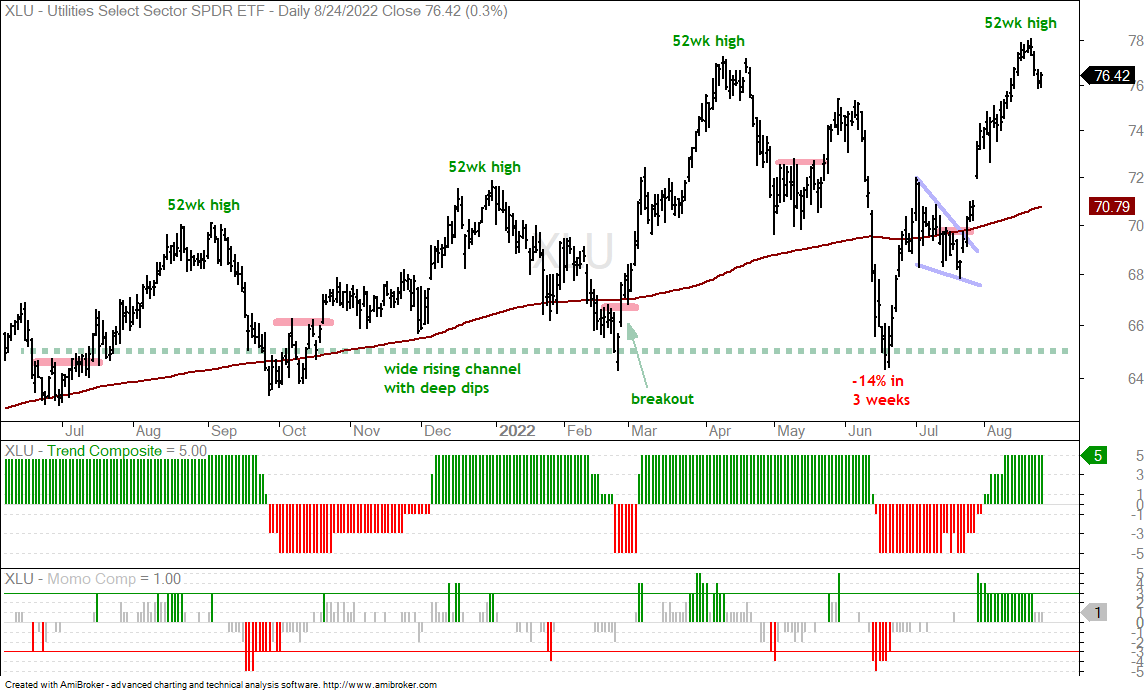
The chart below shows XLU with 52-week highs in August 2021 (>70), December, April and August. Notice that XLU dipped back to the 65 area (green dashed line) after each high. These are some deep dips. XLU hit a new high last week and I do not know if this pattern of deep dips will continue. Patterns sometimes stop working after we recognize them. I do know that XLU is currently a leading ETF and in a strong uptrend. I also know that it is quite extended and I do not see a tradable pullback on the chart right now. The red lines mark short-term resistance levels after pullbacks. A tradable pullback could involve a dip to the rising 200-day SMA or low 70s.
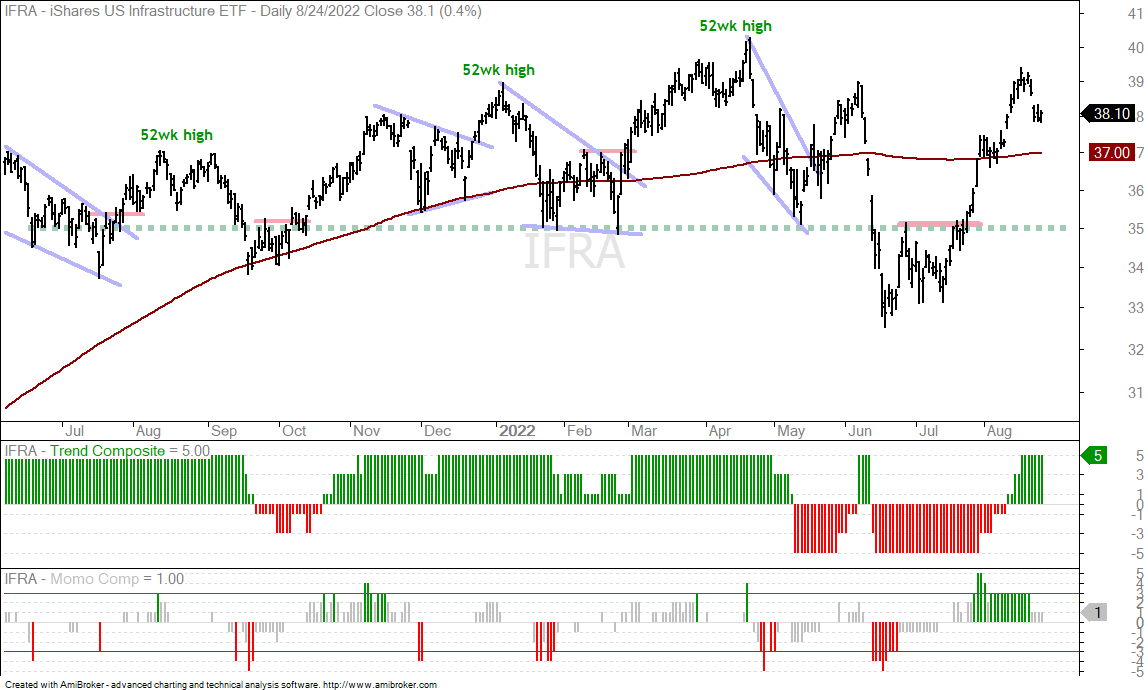
The next chart shows the Infrastructure ETF (IFRA) above its rising 200-day SMA. There are a series of 52-week highs from August to April and dips to the 35 area (green dashed line) along the way. There is no setup on this chart, but IFRA is still in an uptrend and leading. Note that the Trend Composite has not been much of a help with XLU or IFRA.
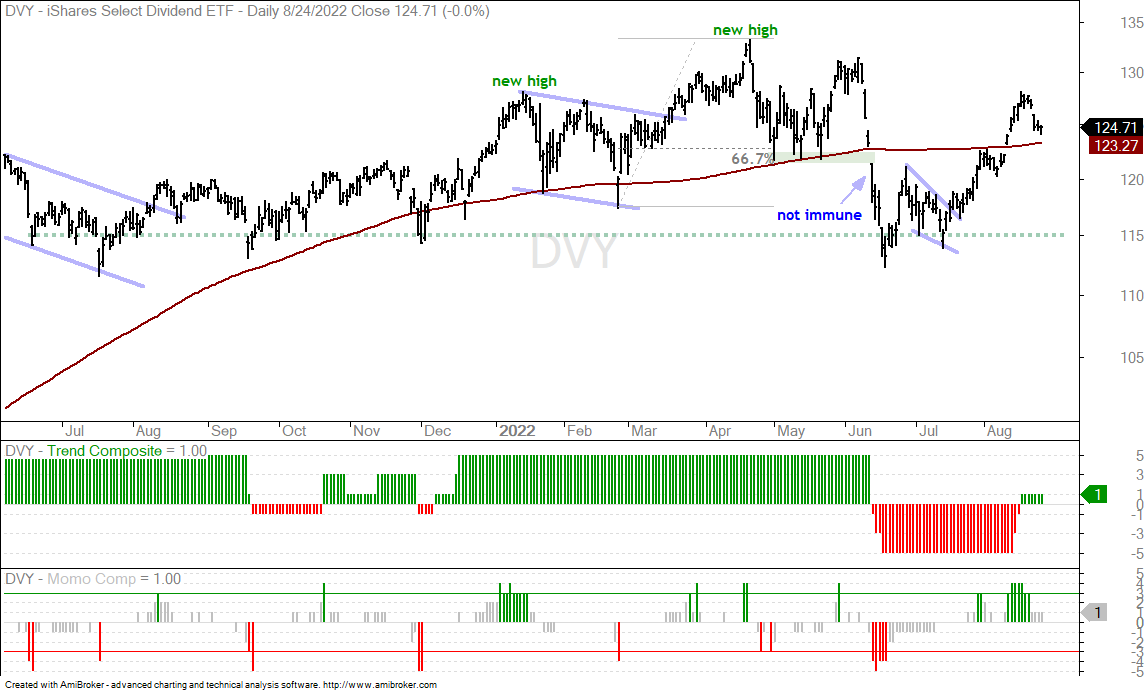
The Select Dividend ETF (DVY) hit new highs in January and April and then fell back to the 115 area (green dashed line). Notice how the ETF fell sharply in June and was not immune to broad market weakness. DVY did, however, recover well and is back above its rising 200-day SMA. ETFs above their 200-day SMAs are stronger than ETFs below their 200-day SMAs.
And finally, the Food & Beverage ETF (PBJ) is also in a leading uptrend because it is well above its rising 200-day SMA. Again, I do not see a setup on this chart, just a jagged and leading uptrend.
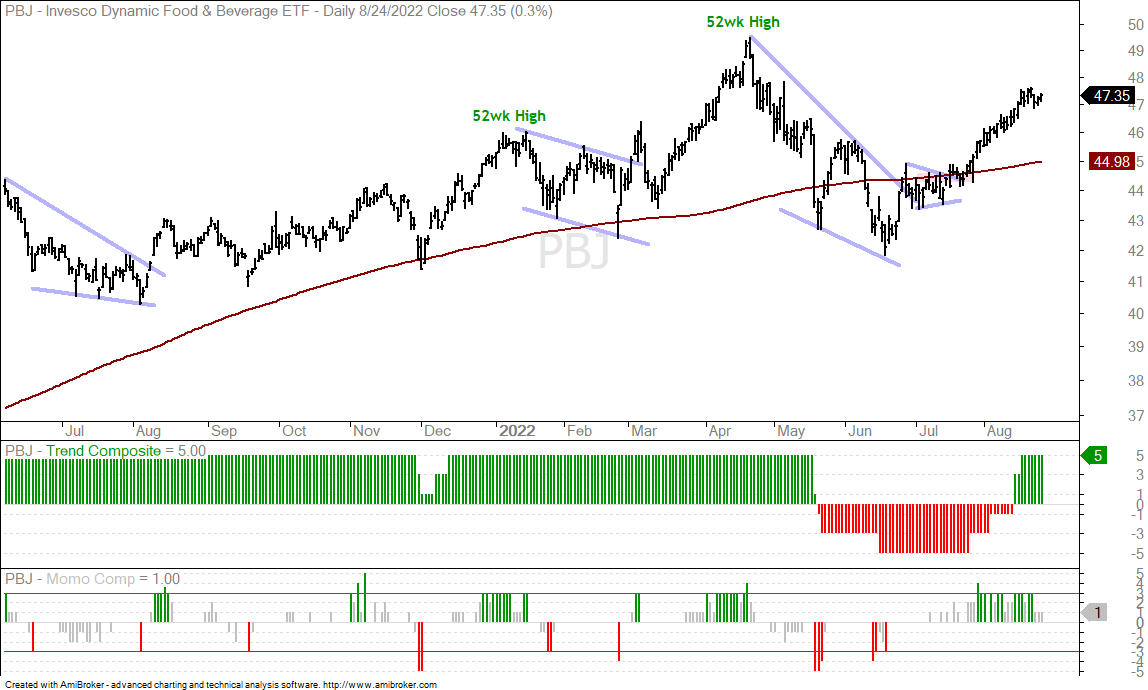
The Momentum Composite aggregates signals in five momentum-type indicators to identify short-term overbought and oversold conditions. This indicator is part of the TIP Indicator Edge Plugin for StockCharts ACP [2]
Defense and Steel Holding Up Year-to-date
Outside of commodity, defensive and energy-related ETFs, it is hard to find stock-based ETFs with gains year-to-date (162 trading days). There are two other groups that stand out for year-to-date performance: aerospace-defense and steel. These include the Aerospace & Defense ETF (PPA), Aerospace & Defense ETF (ITA), Metals & Mining SPDR (XME) and Steel ETF (SLX). Year-to-date percentage changes are: PPA (+2.85%), ITA (+2.77%), XME (+16.32%), SLX (+4.12%). PPA, ITA and XME are also above their 200-day SMAs.
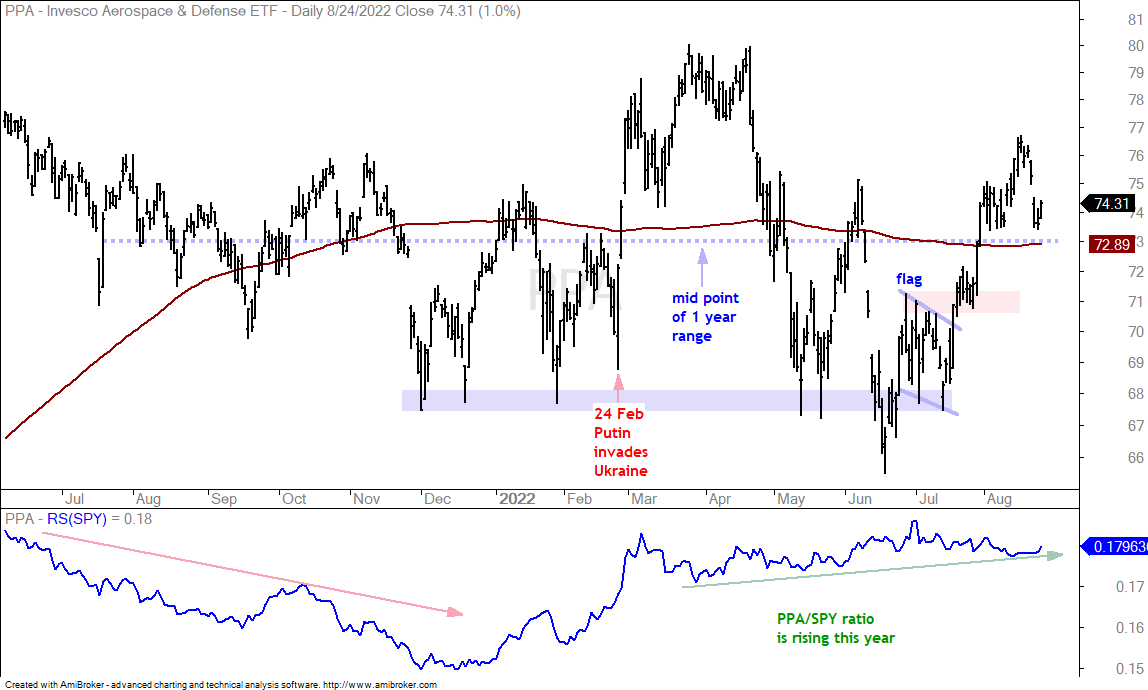
The first chart shows the Aerospace & Defense ETF (PPA) crossing the 200-day SMA over 20 times in the past year. The latest cross occurred with a surge in late July. The blue dashed line shows the mid point of the one year range (73). PPA is just above this midpoint and just above the 200-day SMA. I do not see much in the way of a setup or trend, but PPA is holding up better than the broader market and the cup is half full. The indicator window shows the PPA/SPY ratio with a slight rise (relative strength) since March.
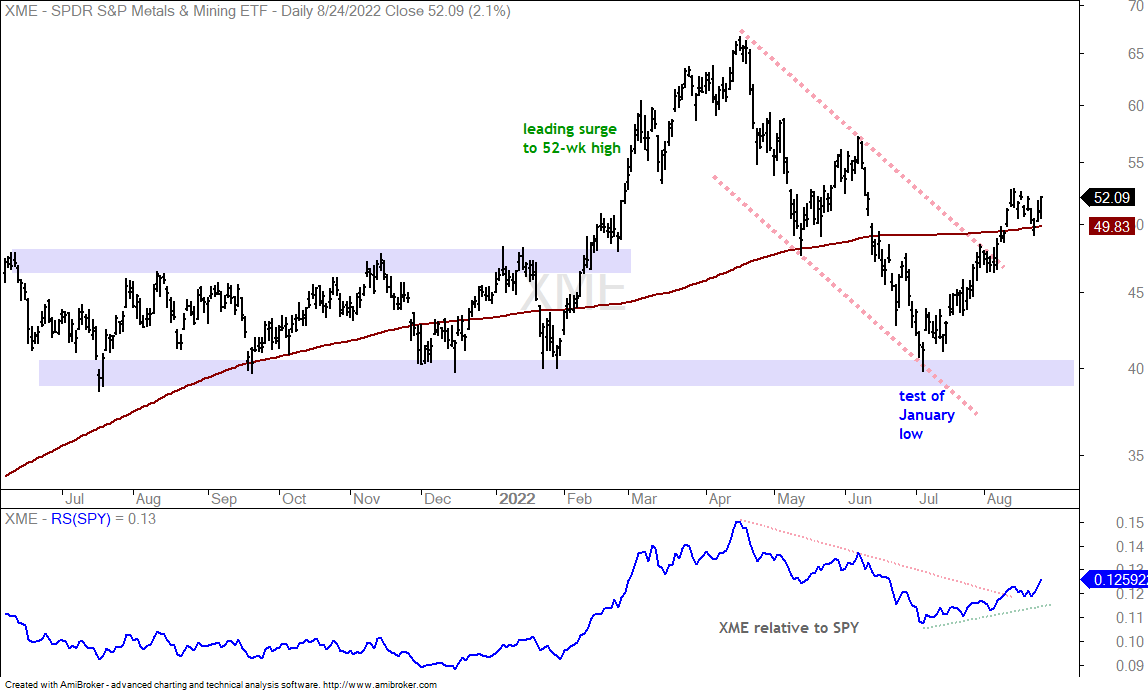
The Metals & Mining SPDR (XME) seems to be going the way of the commodity trade, which makes sense because steel is a commodity. Industry group weightings in XME are: steel 43.65%, coal & consumables 19.58%, aluminum 11.7%, metals & mining 10%, gold 8.3%, silver 3.6% and copper 3.2%. On the price chart, XME led the market with a surge into April and then fell all the way back to its January lows in July. XME then recovered with a move above its rising 200-day SMA. There is also a channel breakout working. The indicator window shows the XME:SPY ratio turning up as XME outperforms SPY over the last two months.
You can learn more about exit strategies in this post [3],
which includes a video and charting options for everyone.
Gold Hits Short-term Support-Reversal Zone
The Gold SPDR (GLD) is in a clear downtrend as it followed most commodities lower from March to mid July. GLD got a bounce into mid August and then fell back sharply the last two weeks. The trend is clearly down, but GLD is at a potential support-reversal zone short-term and could get a bounce.
First, note that successfully trading gold is quite a challenge. There was a breakout in November, a triangle into January, a breakout in February and a surge to new highs in March. The bulls were looking good in March, but GLD broke down with the rest of the commodity world in April and fell to a 52-week low in July. The falling channel since March defines the current downtrend.
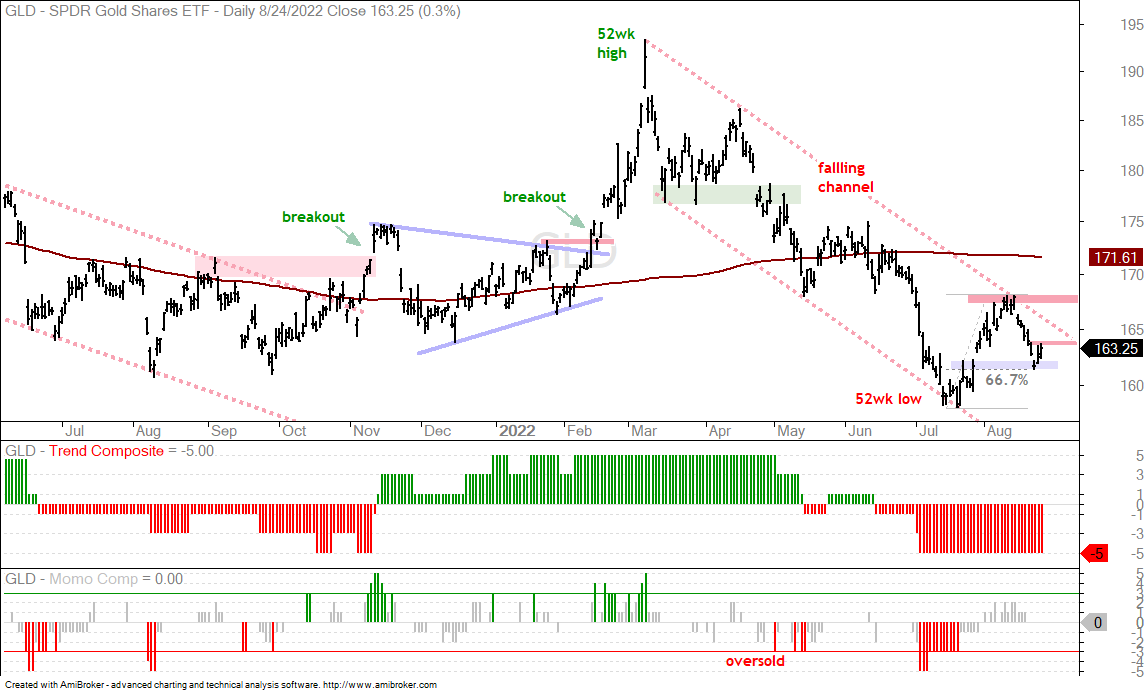
Short-term, GLD surged to around 168 in mid August and fell back to the 162 area on Monday. The decline returned to the short-term breakout and retraced 2/3 of the July-August advance (blue shading). This makes it a short-term support-reversal zone and a breakout at 164 would be short-term bullish. Longer term, GLD needs to break the mid August high to reverse the bigger downtrend.
Note that I have no idea what drives gold. The Dollar is in a strong uptrend and this is typically negative for gold. Treasury yields are rising. This is positive for the Dollar and negative for gold. Inflation is out there somewhere, as are the central banks and Russia. There are lots of macro drivers for gold and we cannot be expected to accurately weigh them all. Price, price, price.
The Trend Composite aggregates signals in five trend indicators: Bollinger Bands (125,1), Keltner Channels (125,2), 5-day Rate-of-Change of 125-day SMA, StochClose (125,5) and CCI-Close (125). The Trend Composite and ten other indicators are part of the TIP Indicator Edge Plugin for StockCharts ACP [2]
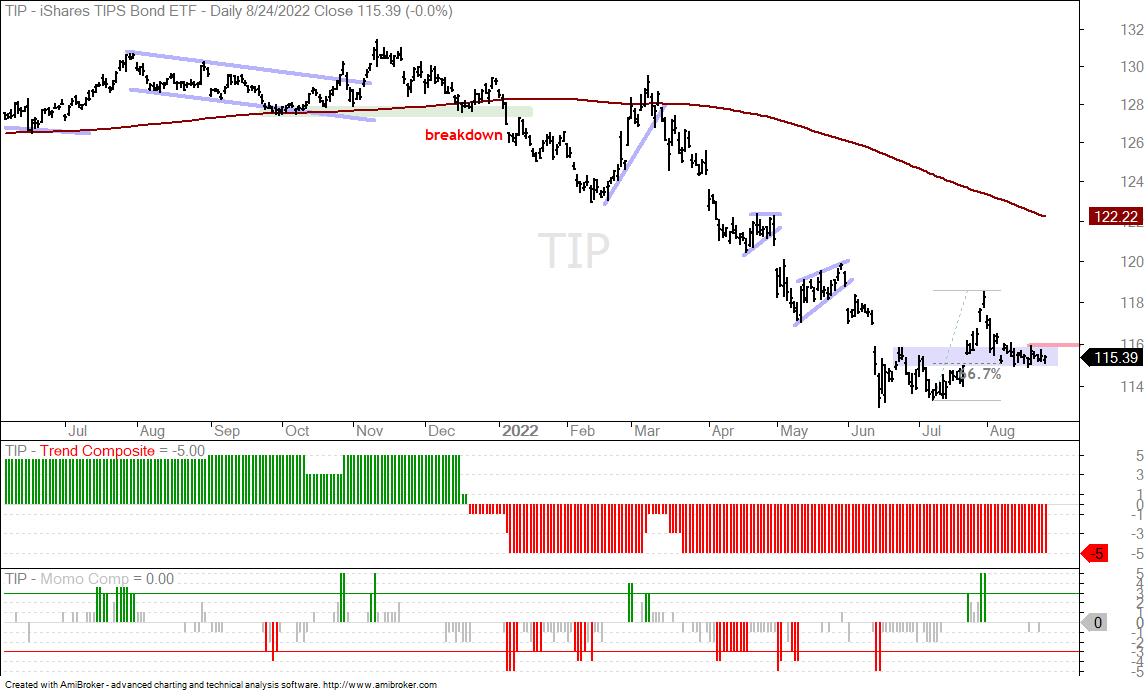
Inflation-Indexed Bond ETF Hits Short-term Reversal Zone
The 10-yr Treasury Yield is in a long-term uptrend and the 20+ Yr Treasury Bond ETF (TLT) is in a long-term downtrend. The Inflation Protected Bond ETF (TIP) is also in a long-term downtrend and following Treasury bonds lower. TIP caught my eye because it firmed the last three weeks, even as TLT moved lower. As with GLD, TIP is firming in a support-reversal zone marked by the prior short-term breakout and 2/3 retracement (blue shading). This is a bottom pick for sure, but a breakout at 116 would be short-term bullish. Plan your trade ahead of time and then trade according to that plan.
Uranium ETF with an Out-Sized Surge (URA)
The Uranium ETF (URA) is one of these ETFs that has been everywhere and nowhere over the past year. The Healthcare SPDR (XLV) and Aerospace & Defense ETF (PPA) also come to mind. URA is currently trading near the same levels as last summer. In the meantime, the ETF held the 17-19 support zone (green shading) with bounces in August, January, May and July.
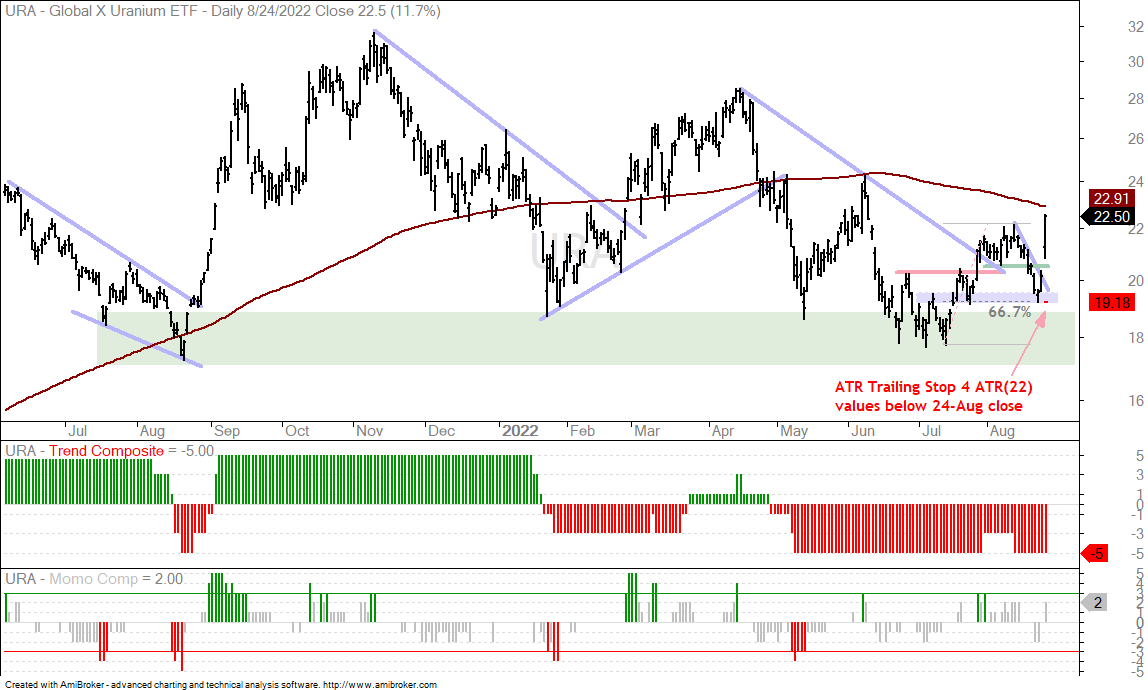
I was watching URA last week as it firmed just above the breakout zone. Instead of holding and breaking out, URA plunged below 20 to negate this setup. In hindsight, 19 was a support-reversal zone marked by broken resistance and the 2/3 retracement (blue shading). URA surged the last two days and we have an outsized gain on Wednesday. This shows strength that could lead to further gains. Overall, I think URA reversed the downswing from April to July and the current swing is up. The short red line at 19.18 marks the ATR Trailing Stop, which is set 4xATR(22) values below Wednesday’s close. This is a volatile ETF with above average risk.
You can learn more about the ATR Trailing Stop and exit strategies in this post [3],
which includes a video and charting options for everyone.
Previous Commentary and Video
Wednesday Market and ETF Video (here [4])
Market Regime Update with Breadth Model and Yield Spreads (here [5])
Topics Covered in Tuesday’s Report (here [6])
- AD% and 1-day ROC Confirm Broad Participation
- Composite Breadth Model Remains Bearish
- Short-term Breadth Indicators Trigger Bearish (SPX, NDX)
- SPY Fails at Falling 200-day SMA (plus QQQ and IWM)
- Junk Bonds, Consumer Discretionary and Semis Reverse Upswings
- Big Sectors Reverse Near 200-day SMAs (XLK, XLY, XLF)
- Tech-Based ETFs Fail to Hold Breakouts (IGV, CIBR)
- NatGas Hits New High as Oil Strengthens (NG1!, CL1!, DBE)
- Energy ETF Update (XLE, XOP, FCG, AMLP, XES, PSCE)
- Clean Energy ETF Update (TAN, ICLN)
- Biotech ETF Update (XBI, IBB)
- Agriculture ETFs Buck the Stock Market (DBA, WEAT, JO)
- Palladium ETF Falls Along with Stocks (PALL)
You can learn more about my chart strategy in this article [1] covering the different timeframes, chart settings, StochClose, RSI and StochRSI.