Stocks surged with a broad advance that lifted most boats. Some 95% of S&P 500 stocks were up, 96% of Nasdaq 100 stocks advanced and 93% of S&P 1500 stocks gained ground. Tech and high-beta ETFs, which were still the most beaten down, led the way with the biggest gains on Wednesday. The move was enough to turn the Composite Breadth Model bullish for the first time since April and we are now trading in a bull market environment. Until proven otherwise. There are still some significant pockets of weakness within the market and many ETFs are still below the falling 200-day SMAs, but a positive CMB suggests that there are more pockets of strength right now and the bulls have the edge. Note that I updated the Market Regime page to reflect this change.
About the ETF Trends, Patterns and Setups Report
This report contains discretionary chart analysis based on my interpretation of the price charts. This is different from the fully systematic approach in the Trend Composite strategy series. In this ETF Trends, Patterns and Setups report, I am looking for leading uptrends and tradable setups within these uptrends. While I use indicators to help define the trend and identify oversold conditions within uptrends, the assessments are mostly based on price action and the price chart (higher highs, higher lows, patterns in play). Sometimes the chart assessment can be at odds with the indicators.
This Week's Publishing Schedule
Tuesday – 29 November: Market-ETF Report and Signal-Rank Table Update
Wednesday – 30 November Market-ETF Video and Market Regime Update
Thursday – 1 December: Market-ETF Report and Signal-Rank Table Update
Saturday – 3 November: ETF Signal and Rank Table
SPY Surges through 200-day SMA
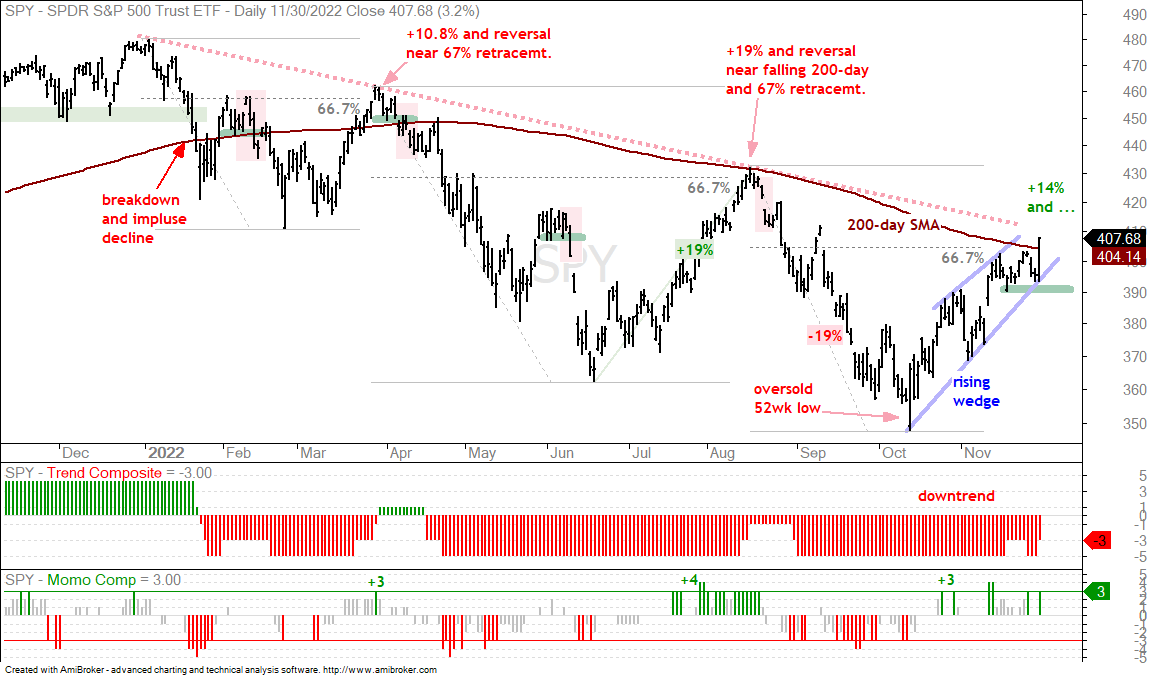
The chart below shows SPY surging 3.2% and closing above the 200-day SMA for the first time since early April. Technically, SPY remains with a lower low in October and the ETF has yet to exceed its August high. An uptrend requires a higher low and a higher high so some more work is required for a true uptrend. My guess is that SPY will not correct until after it has exceeded the August high. It is kind of like the bounce after a lower low or support break. The rising wedge defines the immediate uptrend and Wednesday’s surge reinforces support at 390. The bulls are in control as long as this level holds.
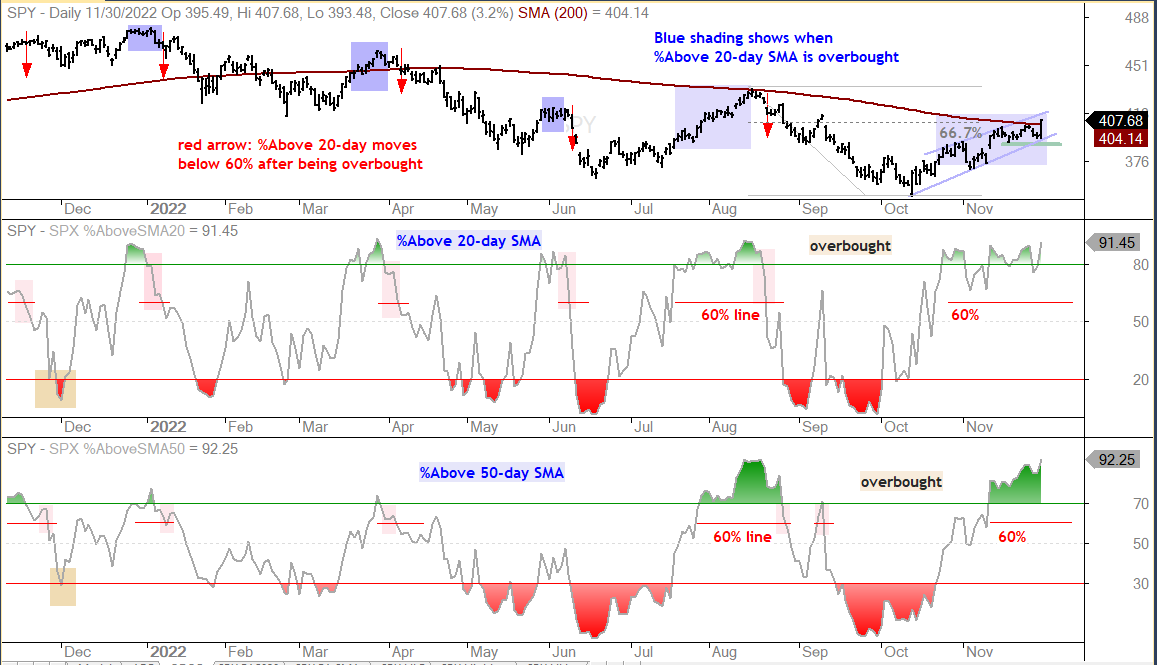
The next chart shows SPY with SPX %Above 20-day SMA and SPX %Above 50-day SMA. Both indicators are above 90%, which was also the case in mid August. %Above 20-day became “overbought” on October 27th and remains overbought (strong). %Above 50-day became overbought on November 10th and remains overbought. This is a classic case of becoming overbought and staying overbought. Moves below 60% would show deterioration in short-term breadth and this would be short-term negative.
With the Composite Breadth Model now bullish, it is time to flip the script and focus on short-term oversold conditions. There will be pullbacks and these pullbacks could provide opportunities. Thus, a dip below 20% in %Above 20-day and/or below 30% in %Above 50-day SMA would create oversold conditions that could foreshadow a bounce.
The Trend Composite aggregates signals in five trend indicators: Bollinger Bands (125,1), Keltner Channels (125,2), 5-day Rate-of-Change of 125-day SMA, StochClose (125,5) and CCI-Close (125). The Trend Composite and ten other indicators are part of the TIP Indicator Edge Plugin for StockCharts ACP[1]
QQQ Leads and IWM Lags
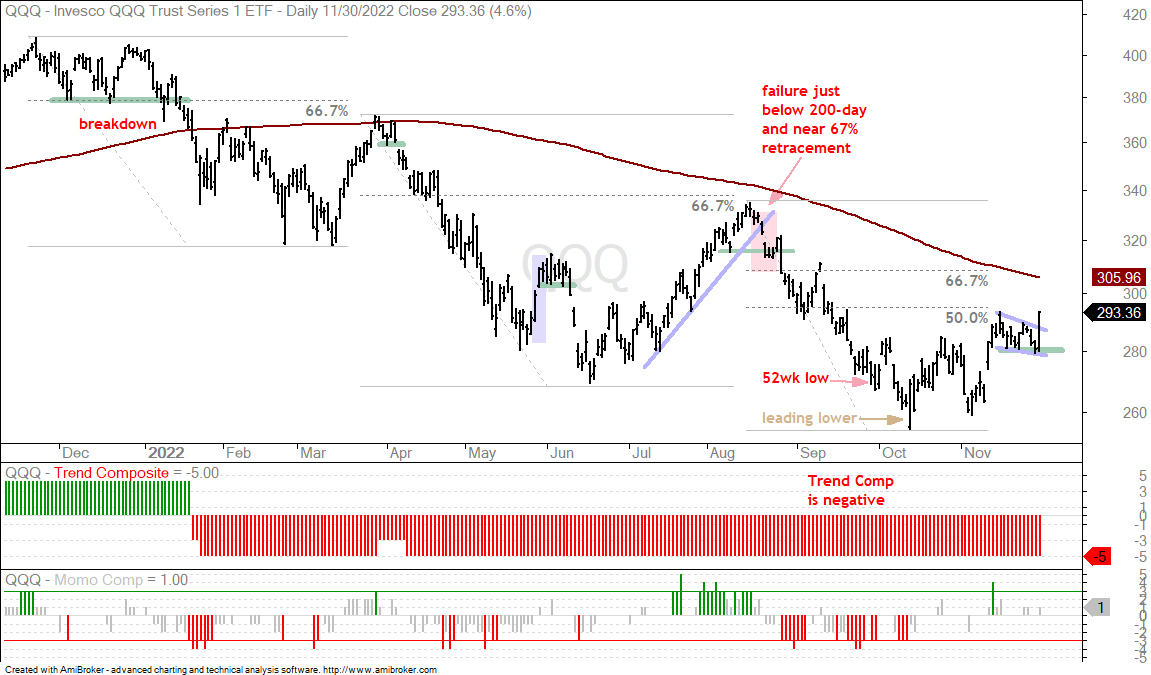
The next chart shows QQQ in a long-term downtrend and with a short-term pennant breakout. QQQ showed some mojo because its 4.4% surge was the strongest of the big three (SPY, QQQ, IWM). Note that there were LOTS of pennant/flag breakouts on Wednesday. Wednesday’s surge is follow through to the November 10th surge and the pennant breakout is bullish until proven otherwise. The pennant lows mark first support to watch for a failure and short-term trend reversal.
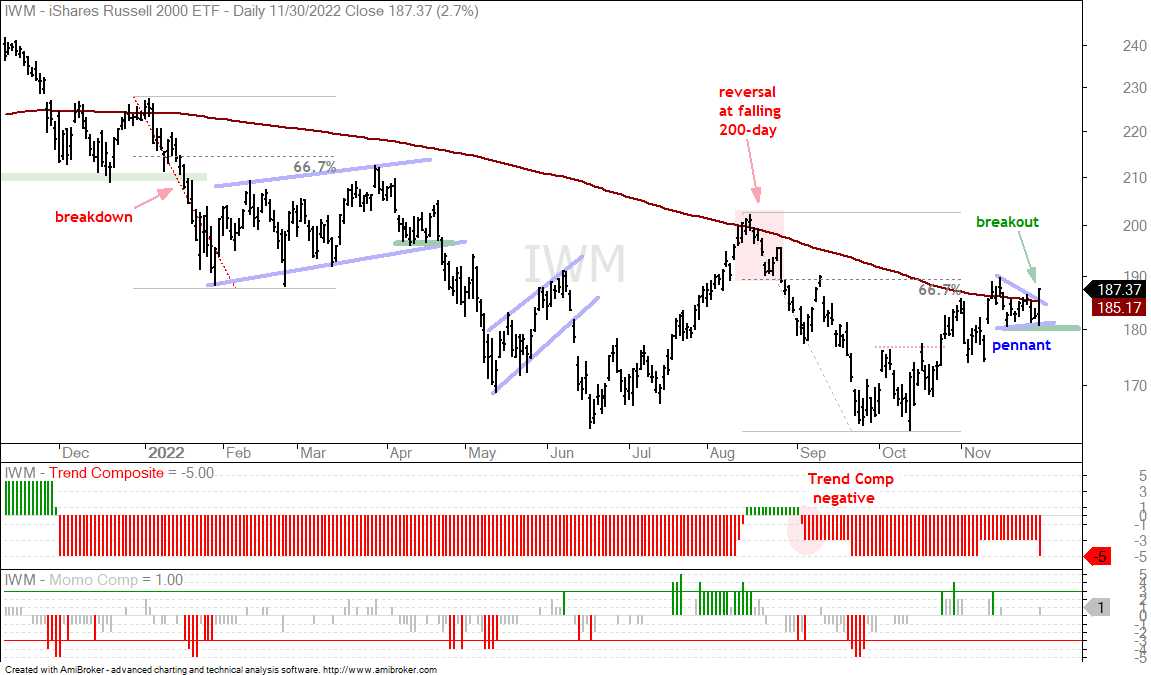
The next chart shows the Russell 2000 ETF (IWM) breaking out of a pennant and closing above the 200-day with a 2.7% surge. This was the smallest move of the big three and small-caps lagged on the day. The setup here is the same as the pennant breakout. It is short-term bullish until proven otherwise with a close below 180.
You can learn more about my chart strategy in this article[2] covering the different timeframes, chart settings, StochClose, RSI and StochRSI.
Pennant Breaks for Semis and Software (SOXX, IGV, SKYY)
There were dozens of pennant/flag breakouts and many of these were in tech-related ETFs. Pennants and flags are short-term continuation patterns that are dependent on the direction of the prior move for their bias. Stocks surged from November 10th to 15th and then consolidated with these pennants or flags. The breakouts signal a continuation of the prior surge and argue for further gains. A break below the flag/pennant low would negate the pattern.
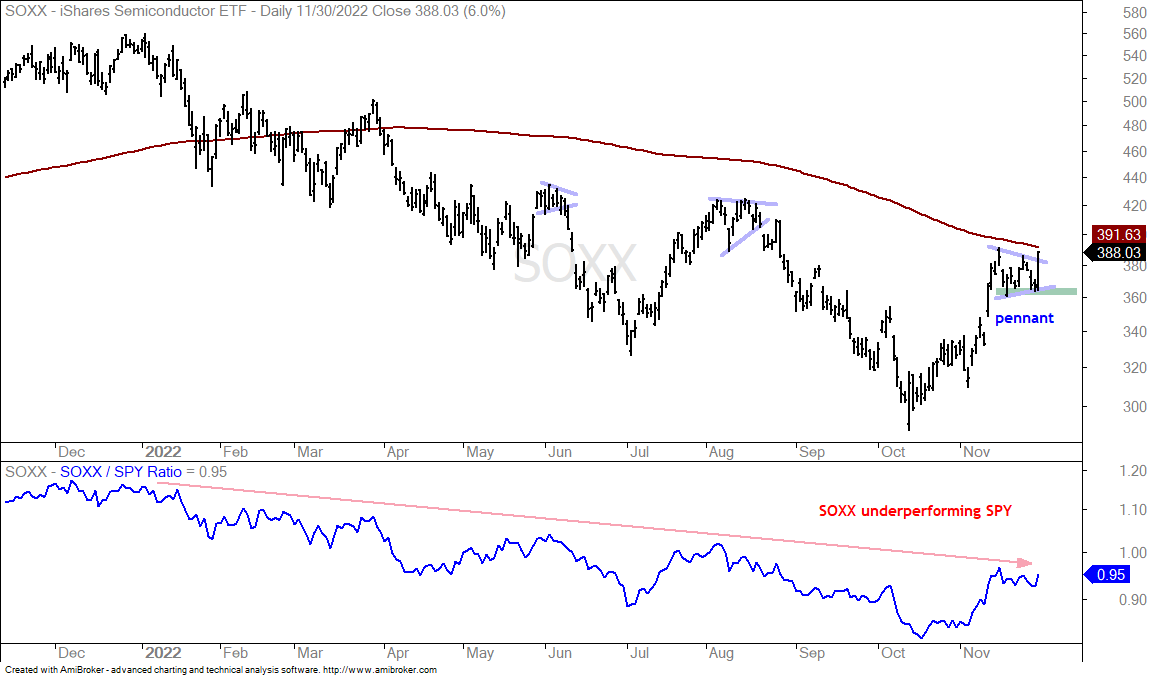
The chart below shows the Semiconductor ETF (SOXX) with a pennant breakout and surge towards the falling 200-day. SOXX is up some 30% since mid October and quite extended, but the breakout is bullish until proven otherwise. The pennant lows mark support at 360.
You can learn more about exit strategies in this post[3], which includes a video and charting options for everyone.
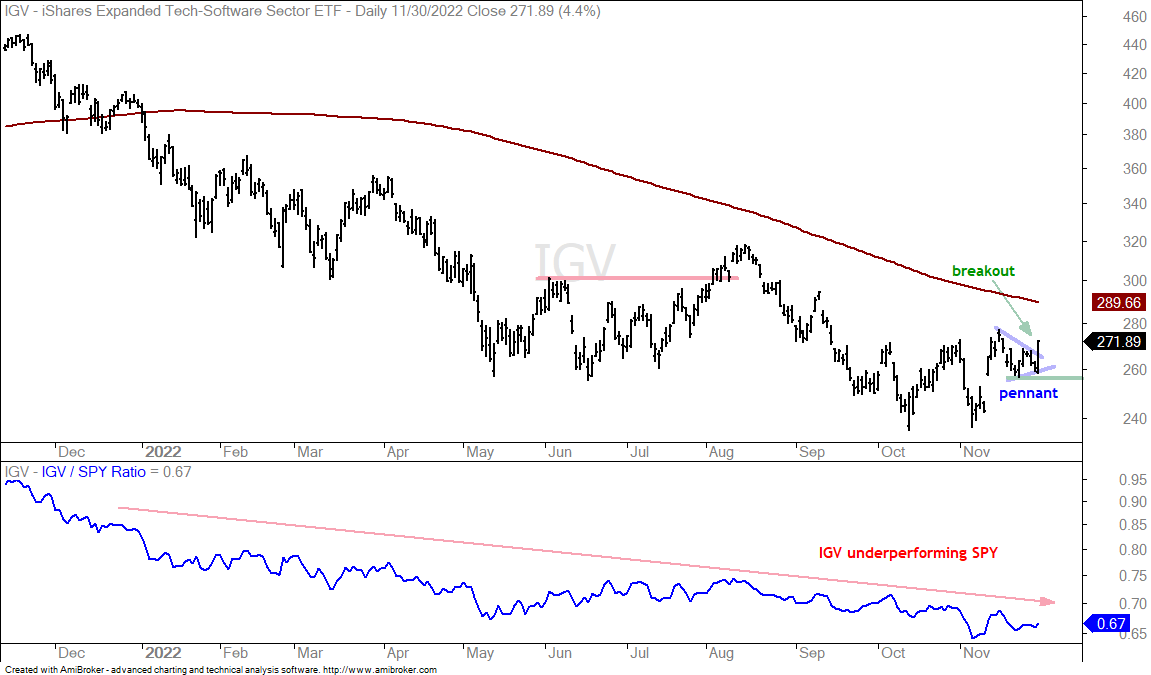
The next chart shows the Software ETF (IGV) with a pennant breakout and support at 256 (green line). Long positions taken near the pennant lows have a clearly defined risk profile and a good reward-to-risk ratio because a close below the pennant low negates the pattern. I highlighted this in Wednesday’s video around the 26:00 mark.[4] The risk profile changes after the breakout surge because the pennant low is further away.
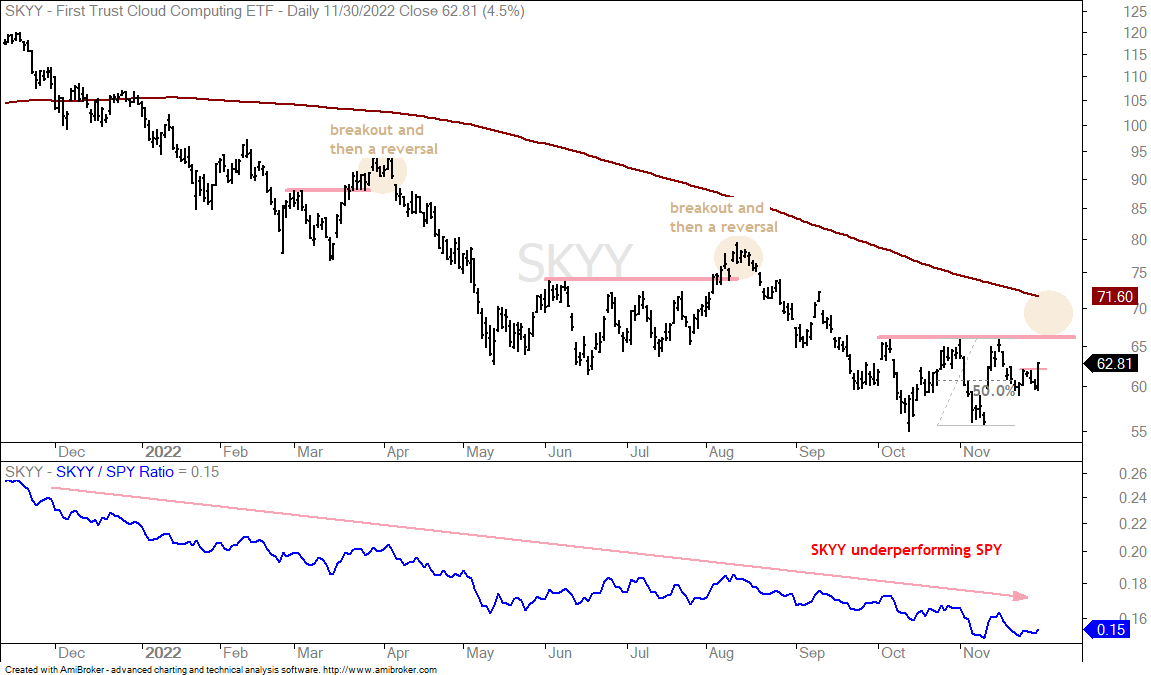
The next chart shows the Cloud Computing ETF (SKYY) with a short-term breakout. SKYY surged to 65 in mid November, retraced around half with a decline back to around 60 and broke short-term resistance with a surge on Wednesday. This is clearly a bottom pick because the long-term trend is down and SKYY is underperforming SPY. A bounce to the yellow circle is possible. While such a move would produce a breakout, note that prior “breakouts” failed in March and August (yellow ovals). Thus, the yellow oval looks more like a profit-taking zone.
10-yr Treasury Yield Corrects within Uptrend
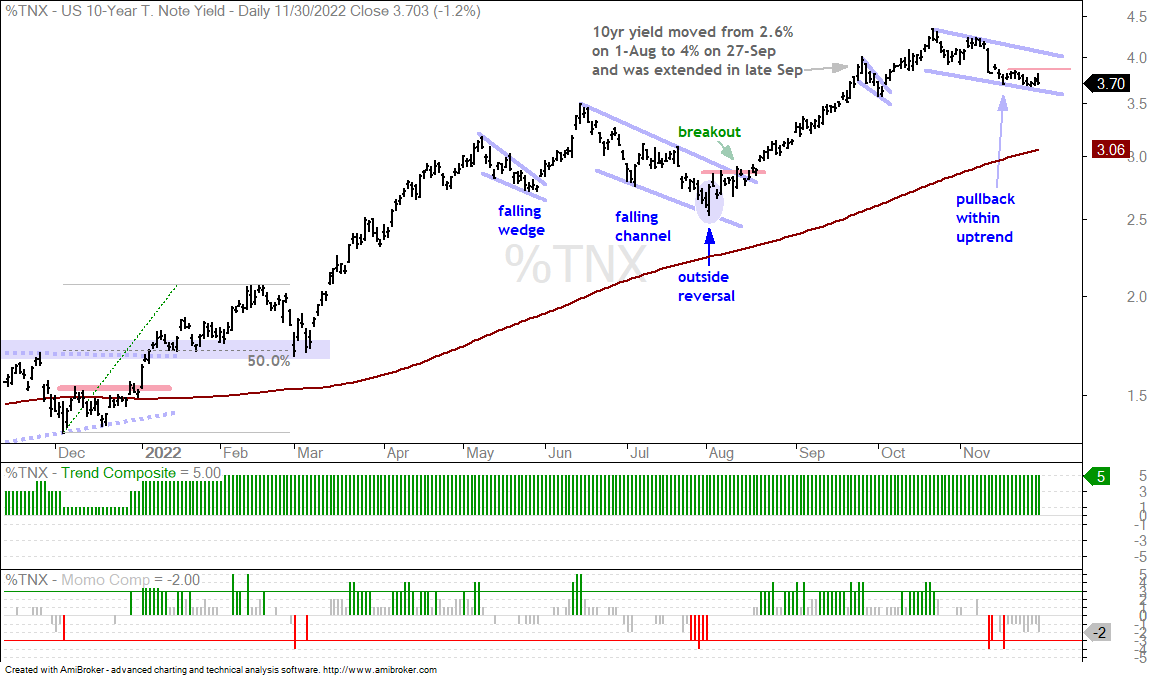
It is important to remember that the bond market usually leads the Fed. Put another way, the Fed is usually behind the curve. Chairman Powell suggested the pace of rate hikes would slow and the market surged on some nuances in his speech. The 10-yr Treasury Yield has priced-in some slowing because it corrected over the last five weeks with a falling channel. The decline slowed the last two weeks and I am watching the red line within this channel. A close above 3.85% would show an upturn and increase the odds of a bigger channel breakout. It has not happened yet, but this is what to watch going forward. A continued correction in the 10-yr Treasury Yield implies a continued bounce in stocks because these two are negatively correlated.
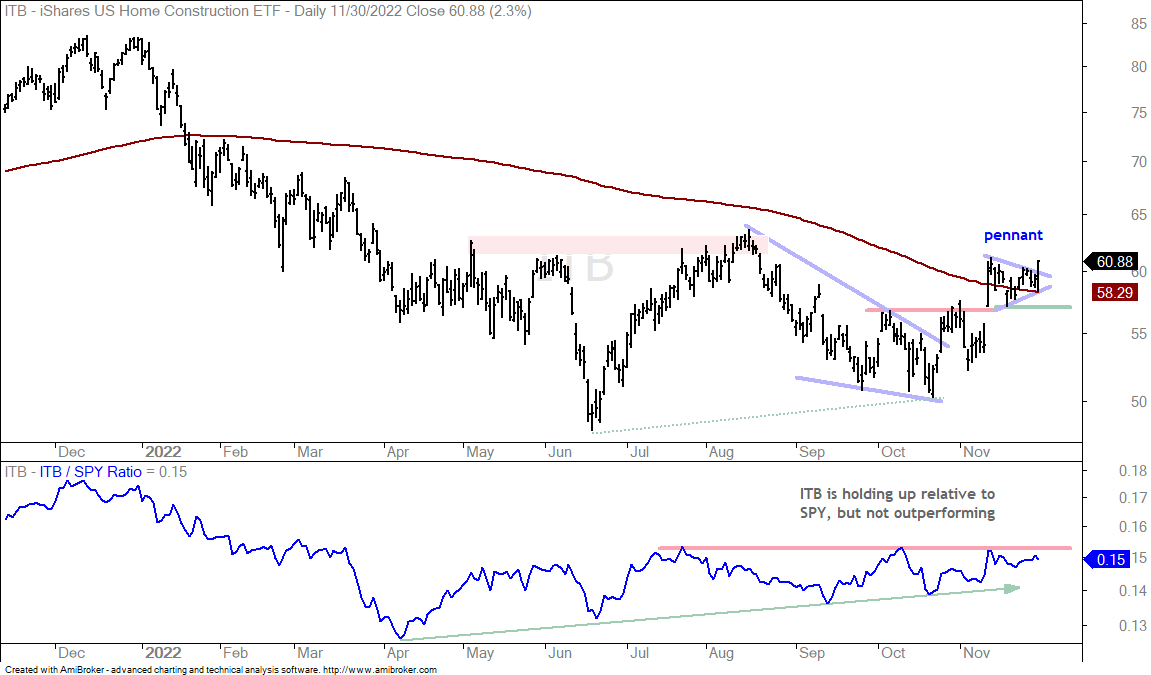
Home Construction Breaks Out of Small Consolidation (ITB)
A correction in the 10-yr Treasury Yield and a surging stock market are positive for the Home Construction ETF (ITB). The next chart shows ITB breaking out of a triangle in late October and breaking the October highs with a surge in mid November. The ETF then consolidated with a pennant around the 200-day SMA and broke out of the pennant on Wednesday. The pennant lows mark support at 57.
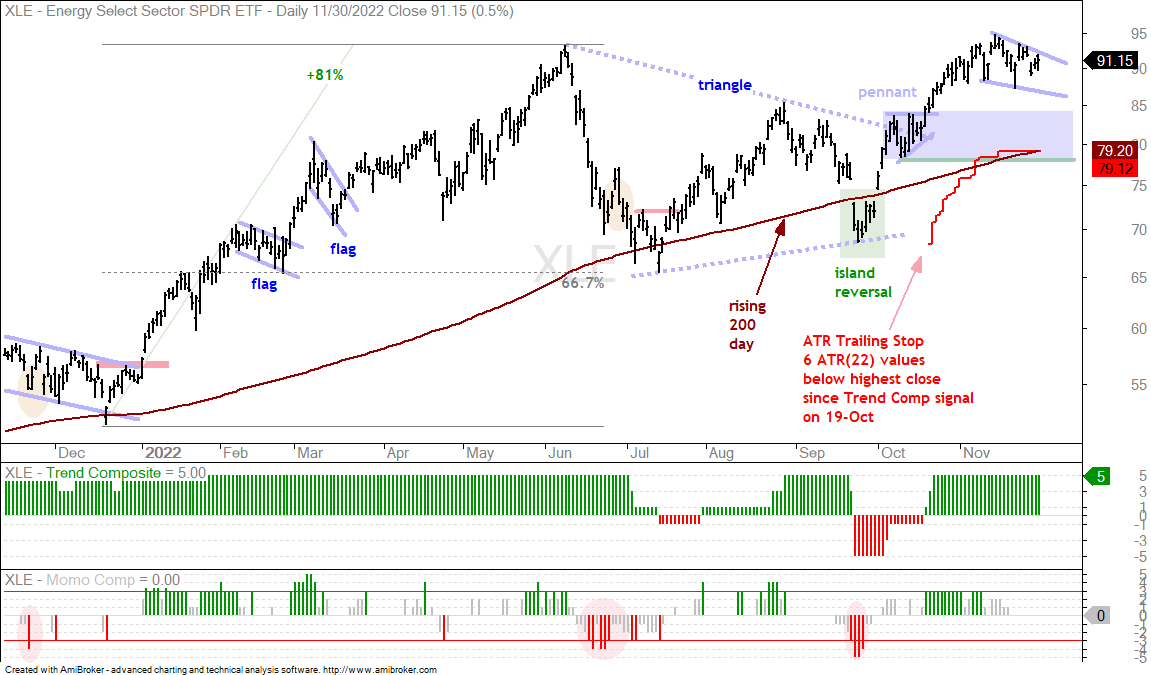
Energy ETFs Form Bull Flags (XLE, XOP, FCG)
The energy ETFs underperformed on Wednesday because their gains were smaller, but these ETFs are outperforming over the last few months and bullish consolidations are taking shape. The first chart shows XLE hitting a new high in mid November and then consolidating with a small falling wedge or pennant. This is a short-term bullish continuation pattern and a breakout would argue for further strength.
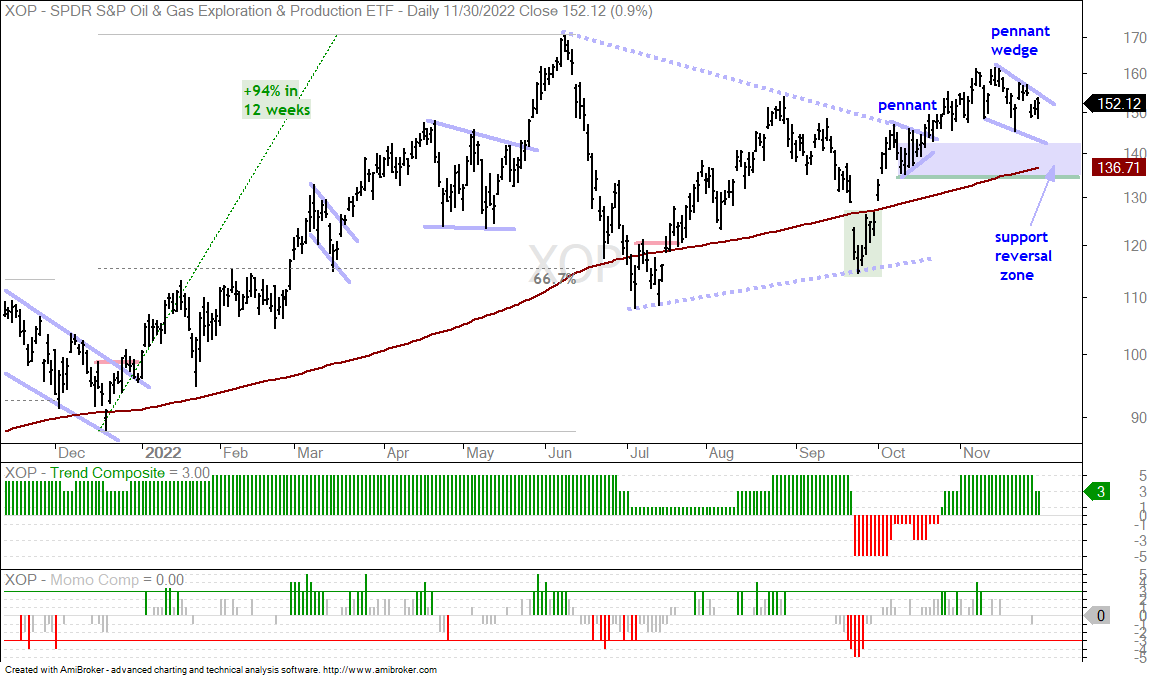
The next chart shows the Oil & Gas Exploration & Production ETF (XOP) with a similar setup. A pennant failure and move back to the 140 area might seem negative, but it would also provide a bullish setup. This would be more of a mean-reversion setup based on oversold conditions and a support-reversal zone. The blue shading shows this zone marked by the rising 200-day and October pennant.
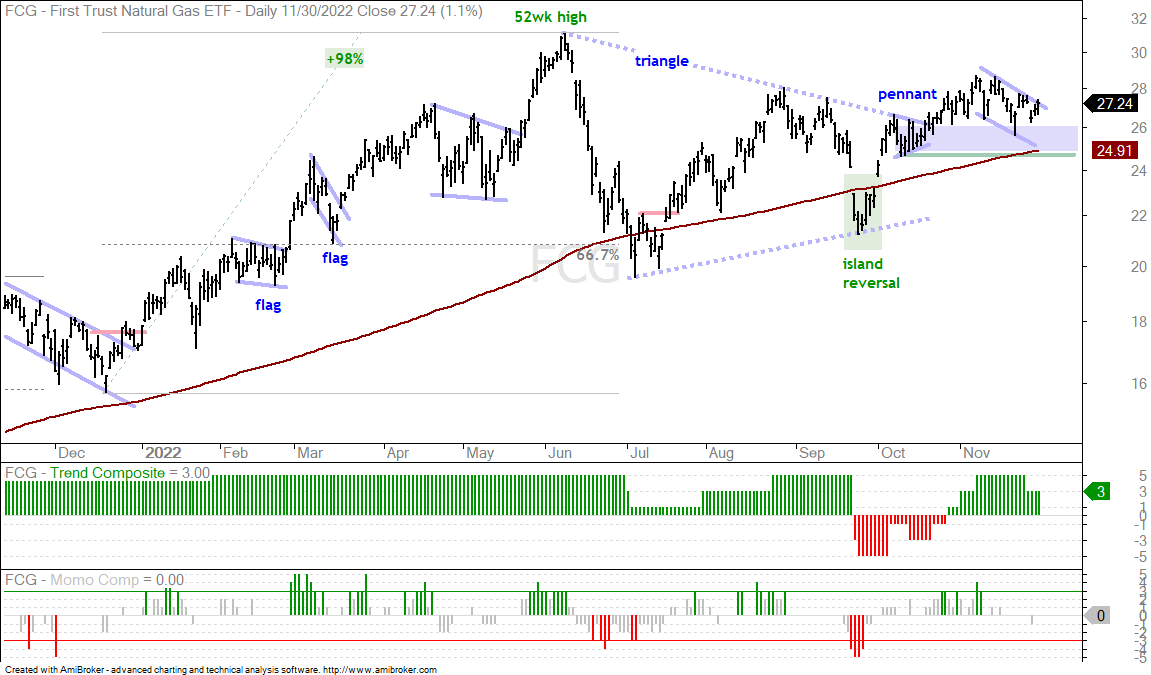
The next chart shows the Natural Gas ETF (FCG) with similar characteristics.
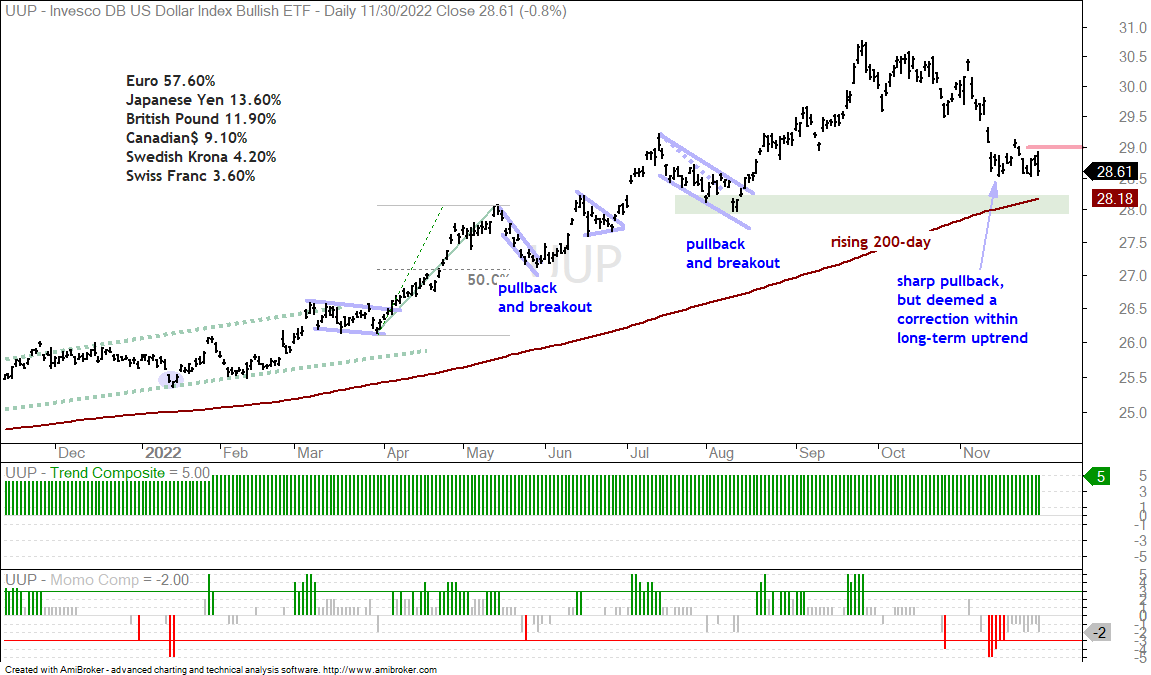
Dollar Stalls just above 200-day SMA
The Dollar Bullish ETF (UUP) fell in reaction to Chairman Powell’s nuance (and because the 10-yr Treasury Yield fell). UUP is still above its rising 200-day SMA and still in a long-term uptrend. A short-term breakout in the 10-yr Treasury Yield could lead to a breakout in UUP. Watch for a move above 29 to reverse the short-term downtrend. For now, the immediate trend is down for UUP and this is positive for metals.
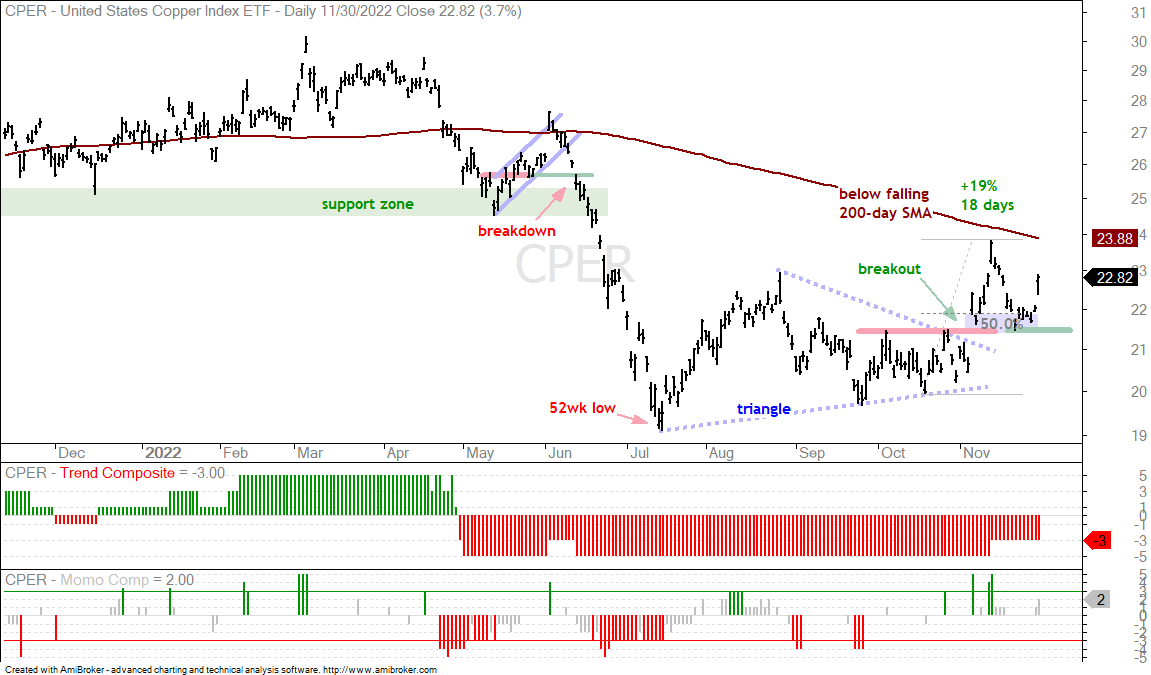
Copper ETF Surges off Breakout Zone (CPER, DBB)
The Copper ETF (CPER) clearly likes what it sees with the Dollar as the ETF broke out of a triangle on November 4th and then surged to 24 on November 11th. In the November 17th report[5], I noted that CPER became overbought and the prudent play was to wait for a pullback to the breakout zone (blue shading 21.5-22). This is one instance where the throwback worked like a charm. The breakout zone turns first support and this area also marked a 50% retracement of the prior advance. CPER firmed for a few days and then surged the last two days.
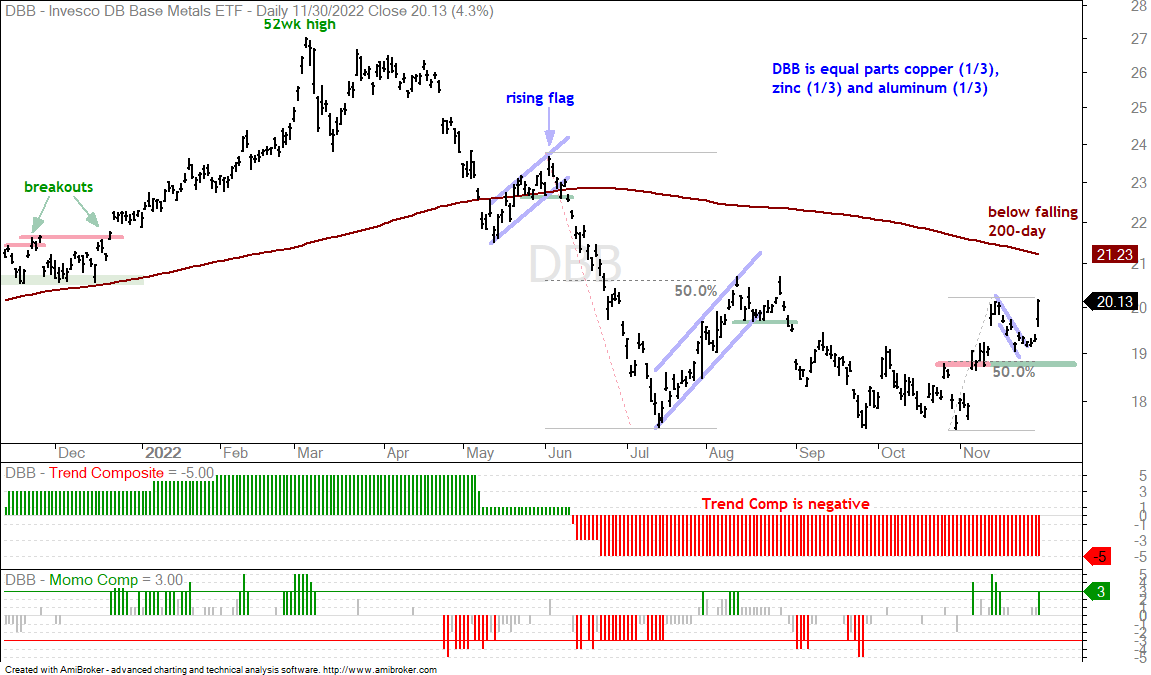
As with many of these big moves, the surge in CPER occurred below the falling 200-day and with a negative Trend Composite. Caveat emptor! The next chart shows the DB Base Metals ETF (DBB) with a similar setup and surge.
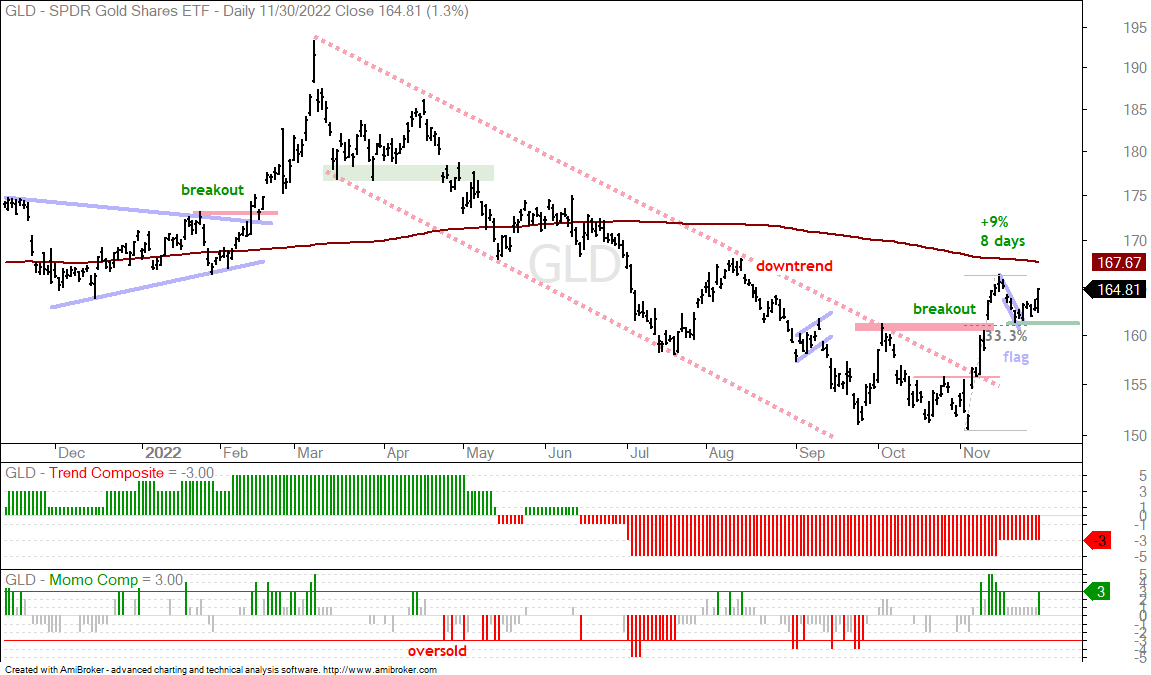
Gold, Silver and Platinum Surge with other Metals
Other metals are also on the move with the Gold SPDR (GLD) surging off its breakout zone. The ETF broke out, fell back to the breakout zone and held the breakout. This week’s surge off broken resistance affirms support here and keeps the short-term uptrend alive for gold. A close below 161 would be bearish.
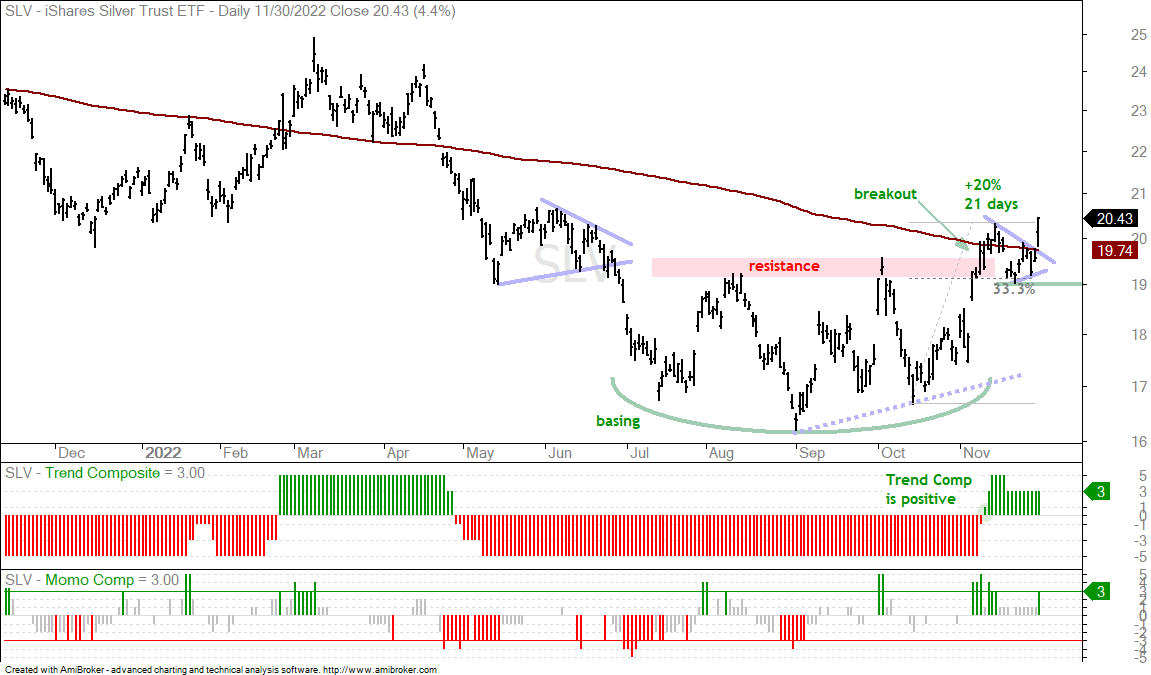
The next chart shows the Silver ETF (SLV) surging above its August-October highs and then consolidating with a pennant around the 200-day SMA. SLV joined the bandwagon yesterday with a pennant breakout.
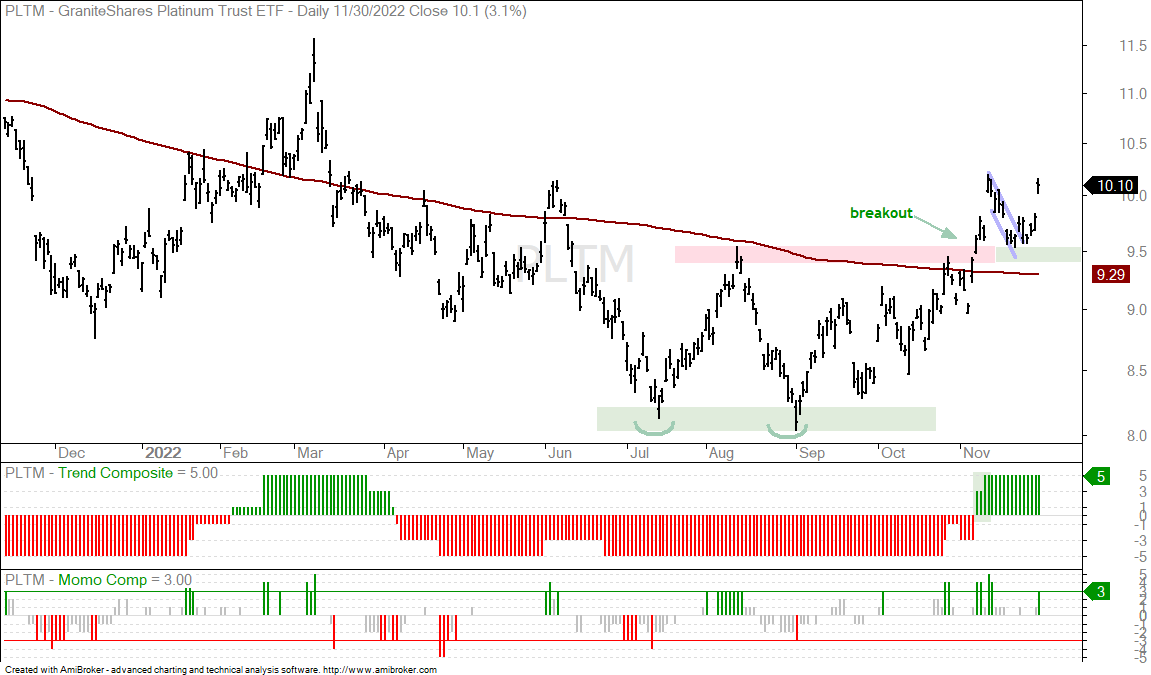
The next chart shows the Platinum ETF (PLTM) breaking out and then testing the breakout zone with a throwback to the 9.5 area. The breakout zone held as PLTM surged the last three days.