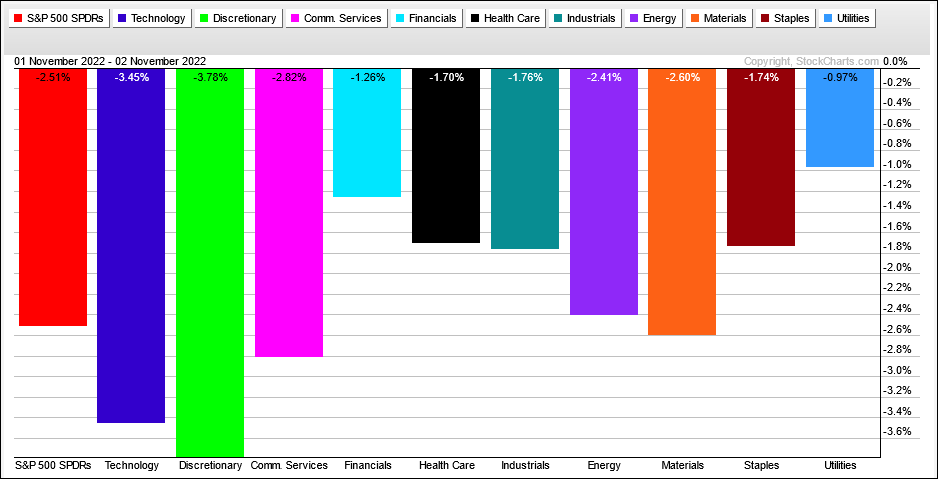
Stocks answered the Fed policy statement with a big sell off on Wednesday afternoon. All eleven sectors were down with the Consumer Discretionary SPDR (XLY) and Technology SPDR (XLK) leading the way lower by falling more than 3.5%. XLK represents tech, while XLY represents consumer spending, Amazon and Tesla. The PerfChart below shows yesterday’s losses for the 11 sectors. XLU held up the best with the smallest loss.
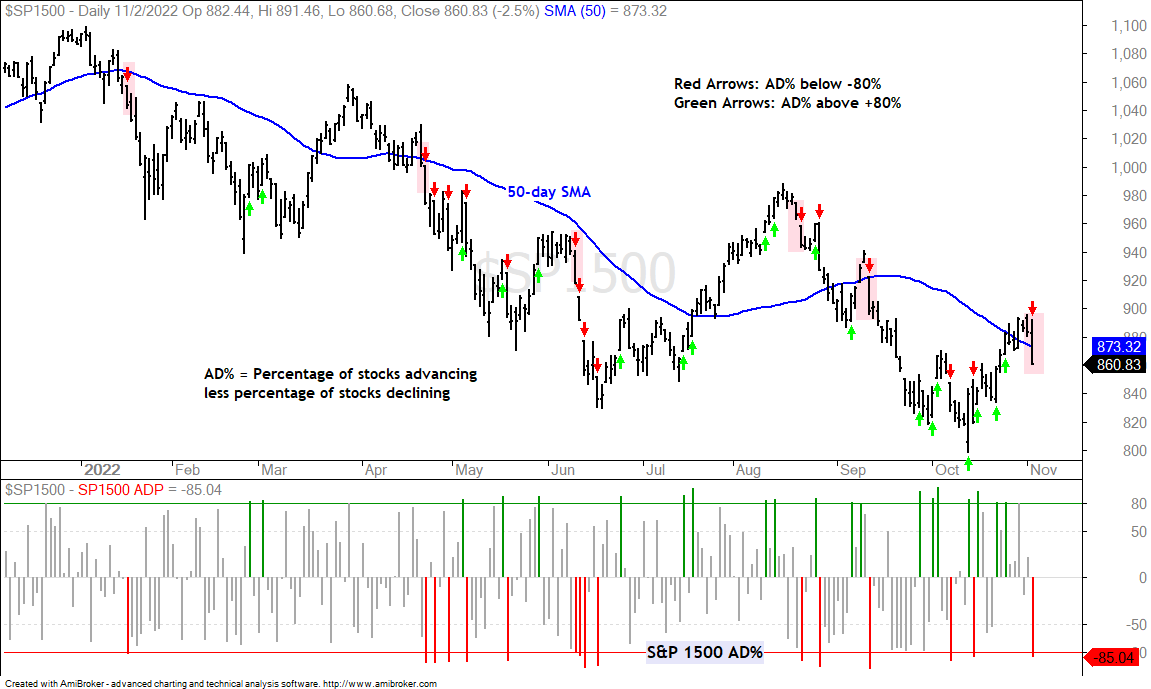
It was not just a bad day for the high beta end of the market because the vast majority of stocks fell. The indicator window in the chart below shows S&P 1500 AD% exceeding -80% on Wednesday, which means over 90% of stocks in the S&P 1500 were down. AD% is the percentage of advancing stocks less the percentage of declining stocks. After a counter-trend bounce, exceptionally strong selling pressure can signal a bearish reversal and the continuation of the bigger downtrend.
About the ETF Trends, Patterns and Setups Report
This report contains discretionary chart analysis based on my interpretation of the price charts. This is different from the fully systematic approach in the Trend Composite strategy series. In this ETF Trends, Patterns and Setups report, I am looking for leading uptrends and tradable setups within these uptrends. While I use indicators to help define the trend and identify oversold conditions within uptrends, the assessments are mostly based on price action and the price chart (higher highs, higher lows, patterns in play). Sometimes the chart assessment can be at odds with the indicators.
This Week's Commentary Schedule
Tuesday – 1 November: Market-ETF Report and Signal-Rank Table Update
Wednesday – 2 November Market-ETF Video and Market Regime Update
Thursday – 3 November: Market-ETF Report and Signal-Rank Table Update
Saturday – 5 November: ETF Signal and Rank Table
SPY Breaks Short-term Support
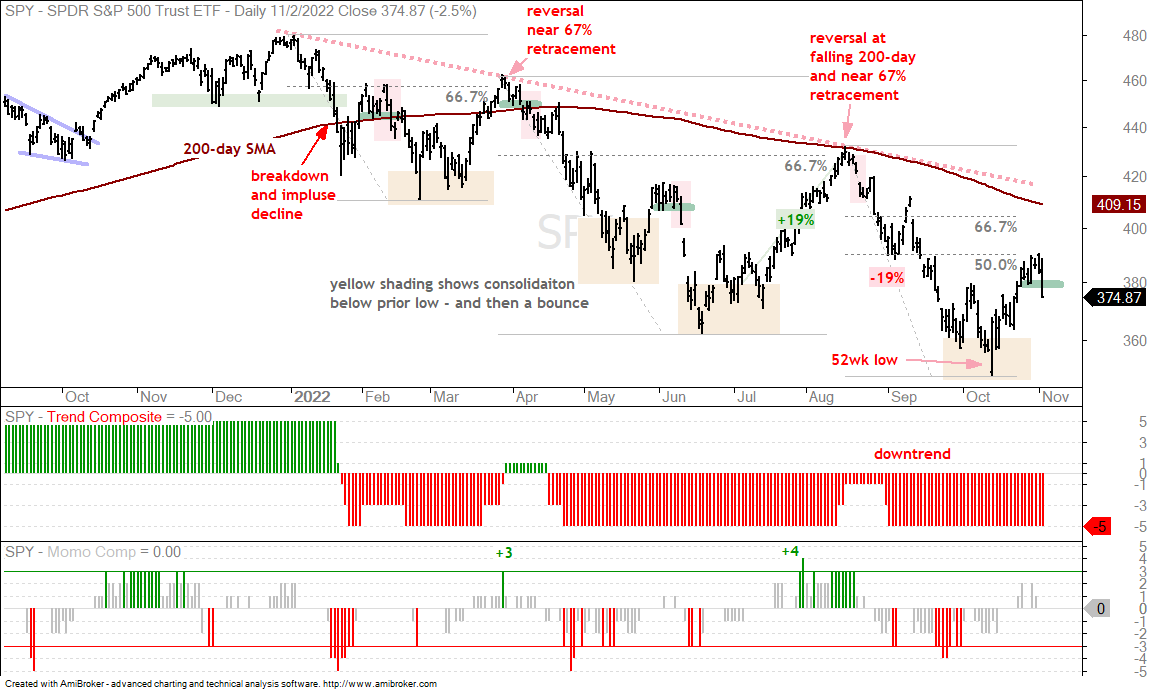
The S&P 500 SPDR (SPY) exceeded the June low and hit a new low in mid October to affirm the long-term downtrend. After becoming oversold, the ETF then bounced and retraced half of the August-October decline. This short-term uptrend reversed with a sharp decline and support break on Wednesday.
The Momentum Composite aggregates signals in five momentum-type indicators to identify short-term overbought and oversold conditions. This indicator is part of the TIP Indicator Edge Plugin for StockCharts ACP[1]
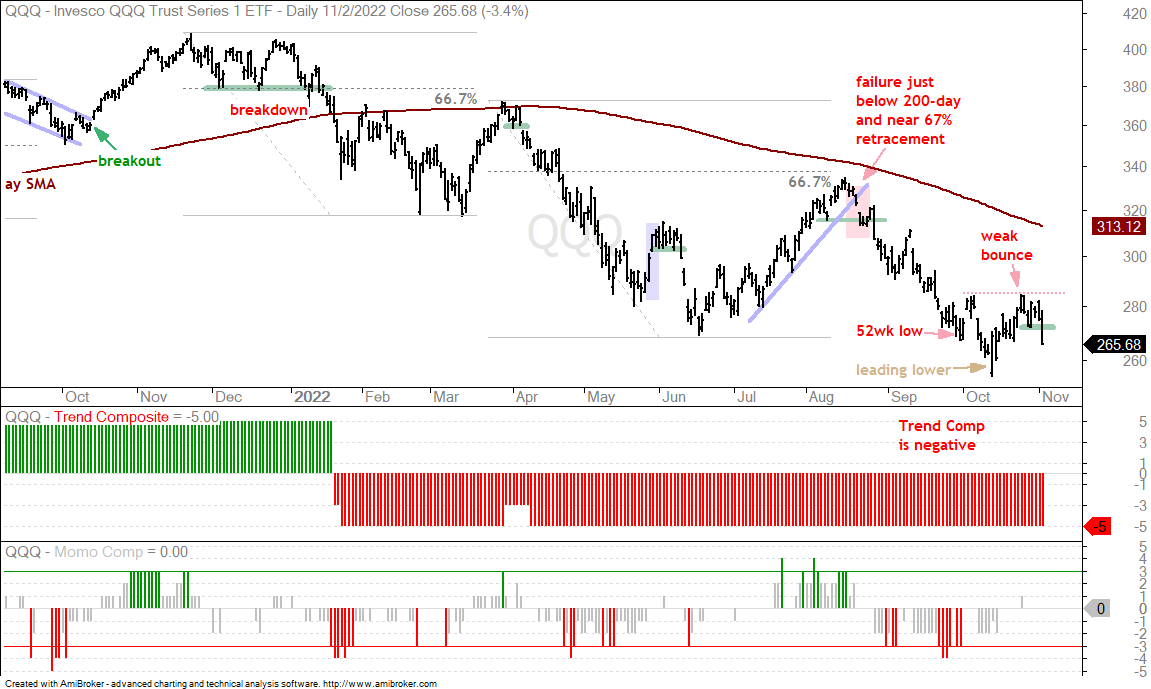
QQQ represents the large-cap tech trade and the stocks in the Nasdaq 100 account for around 2/3 of the S&P 500. QQQ performance has a big effect on SPY performance and QQQ is still lagging. The overall trend is clearly down with a 52-week low in mid October. QQQ bounced with the rest of the market, but struggled near the early October high on October 25th (red dotted line). SPY and IWM cleared this high so this mean QQQ is lagging both SPY and IWM.
The Trend Composite aggregates signals in five trend indicators: Bollinger Bands (125,1), Keltner Channels (125,2), 5-day Rate-of-Change of 125-day SMA, StochClose (125,5) and CCI-Close (125). The Trend Composite and ten other indicators are part of the TIP Indicator Edge Plugin for StockCharts ACP[1]
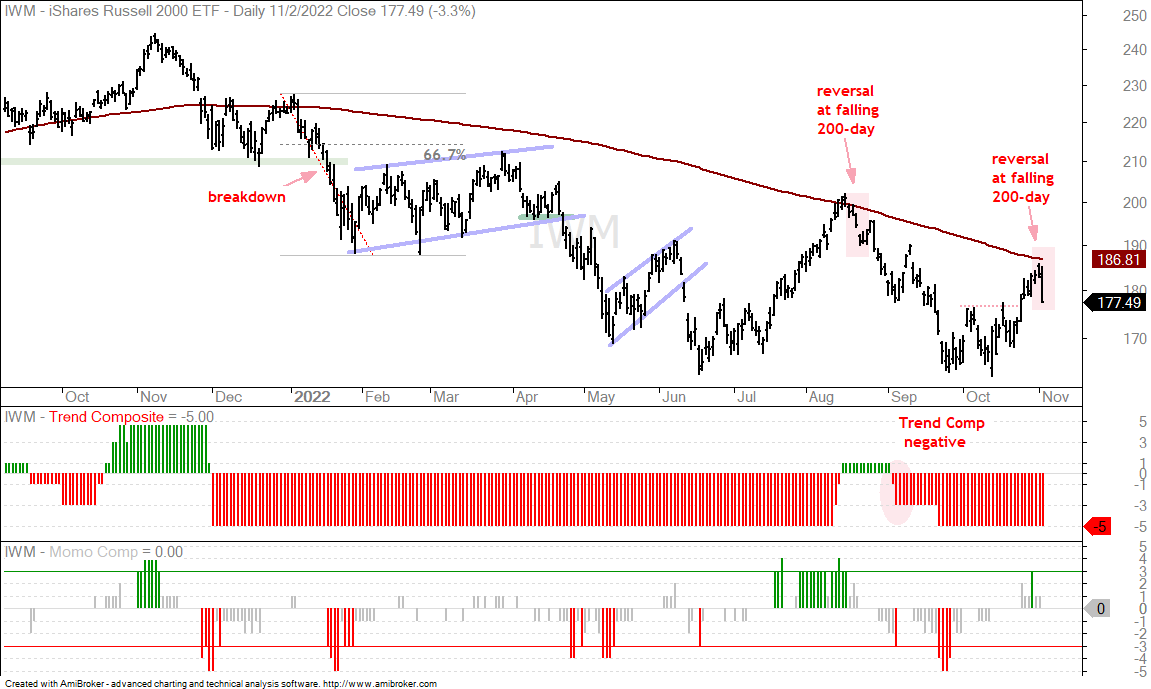
Russell 2000 ETF Fails at Falling 200-day (IWM)
The next chart shows the Russell 2000 ETF (IWM) breaking above its early October high (dotted line) with a surge into late October. This surge, however, was in the context of a larger downtrend and bear market (which makes it a counter-trend move). IWM almost tagged the 200-day SMA on Tuesday and then fell sharply on Wednesday. This amounts to another failure at the falling 200-day for small-caps.
You can learn more about my chart strategy in this article[3] covering the different timeframes, chart settings, StochClose, RSI and StochRSI.
Big Offensive Sectors Bounce from Positions of Weakness
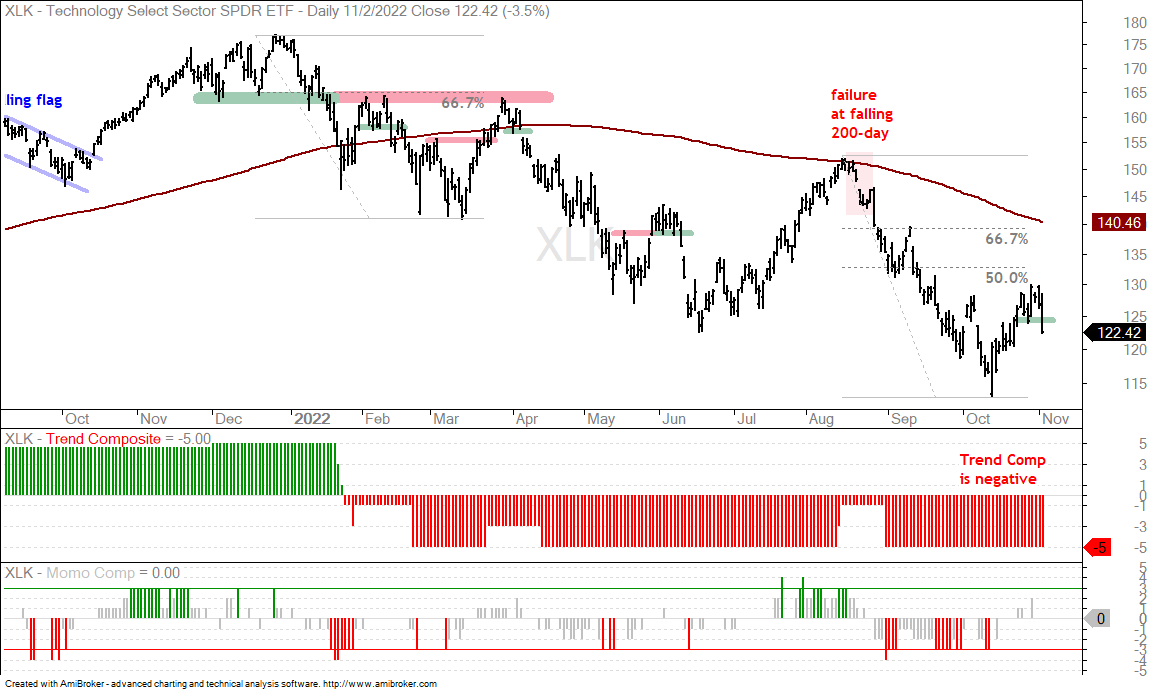
The next charts show the offensive sectors moving sharply lower on Wednesday. The offensive sectors are the Technology SPDR (XLK), Consumer Discretionary SPDR (XLY), Finance SPDR (XLF), Industrials SPDR (XLI) and Communication Services SPDR (XLC). Together, these five sectors account for 68.5% of the S&P 500. They are considered “offensive” because they represent key parts of the economy/market (tech, manufacturing, industrial production, consumer spending, banks, digital services). These are the sectors that should lead and show relative strength during a bull market. They are currently powering the bear market with downtrends and relative weakness (to varying degrees). The first chart shows XLK leading with a new low in mid October, retracing less that half of the Aug-Oct decline and breaking short-term support on Wednesday.
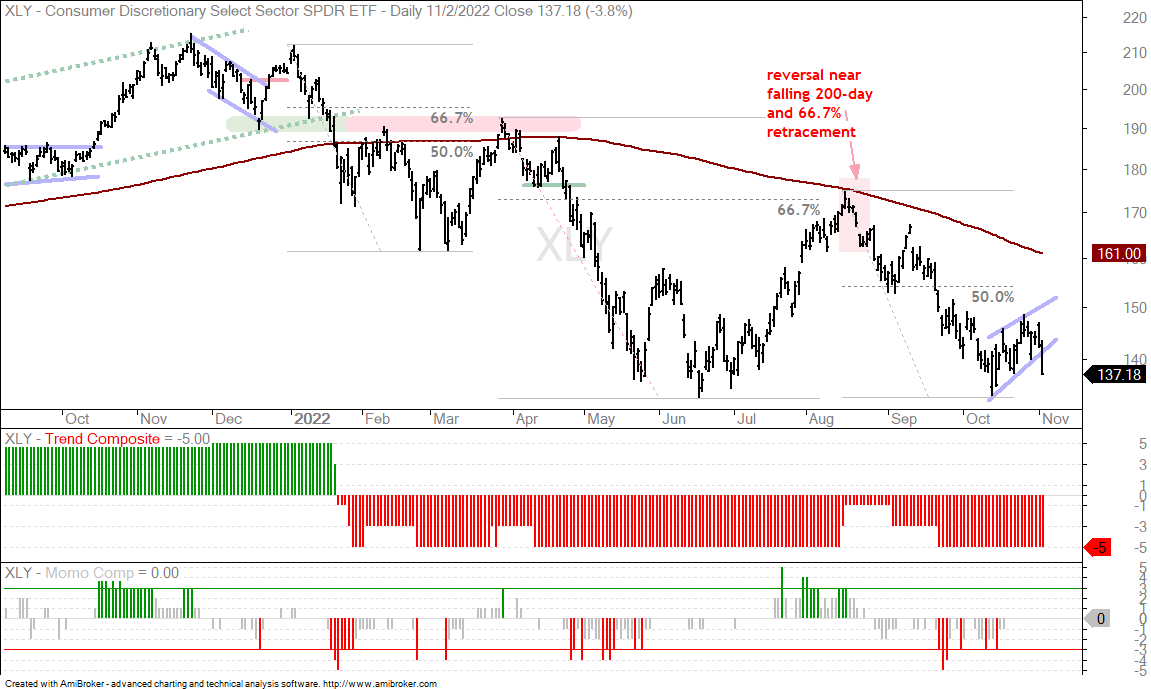
The next chart shows the Consumer Discretionary SPDR (XLY) with a very shallow bounce the last few weeks (rising wedge) and a breakdown on Wednesday. The bounce alleviated oversold conditions from mid October and the breakdown signals a continuation lower.
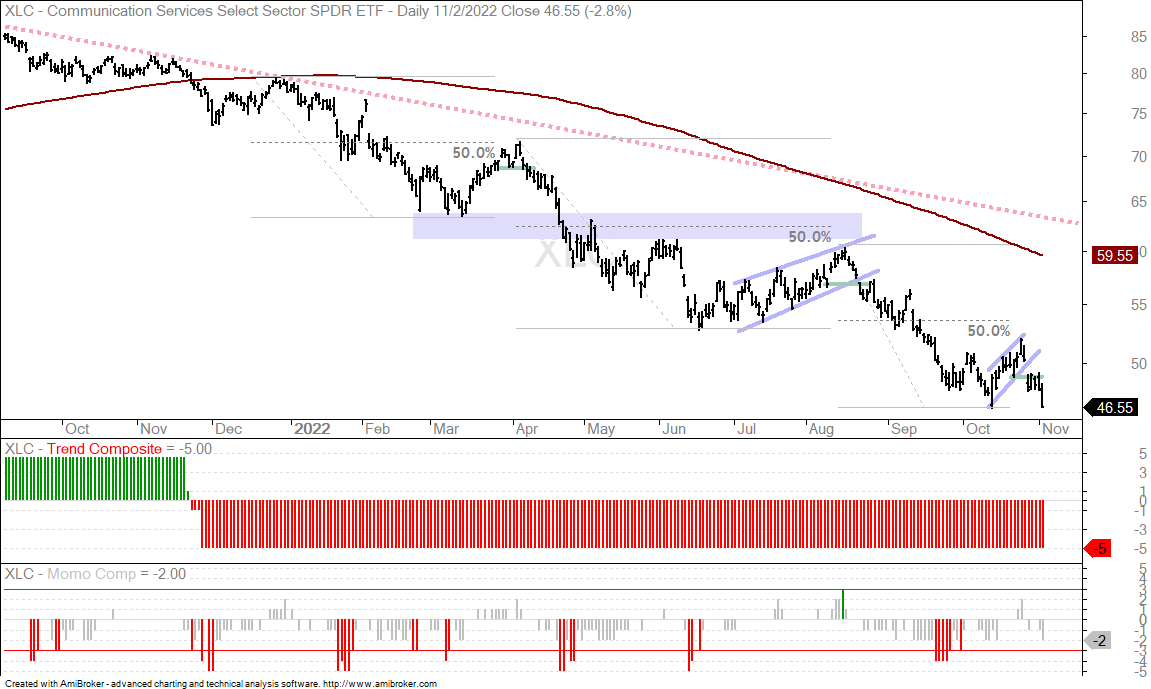
The next chart shows the Communication Services SPDR (XLC) with the weakest bounce of the 11 sectors. XLC actually broke down last week with a gap and hit a new low on Wednesday.
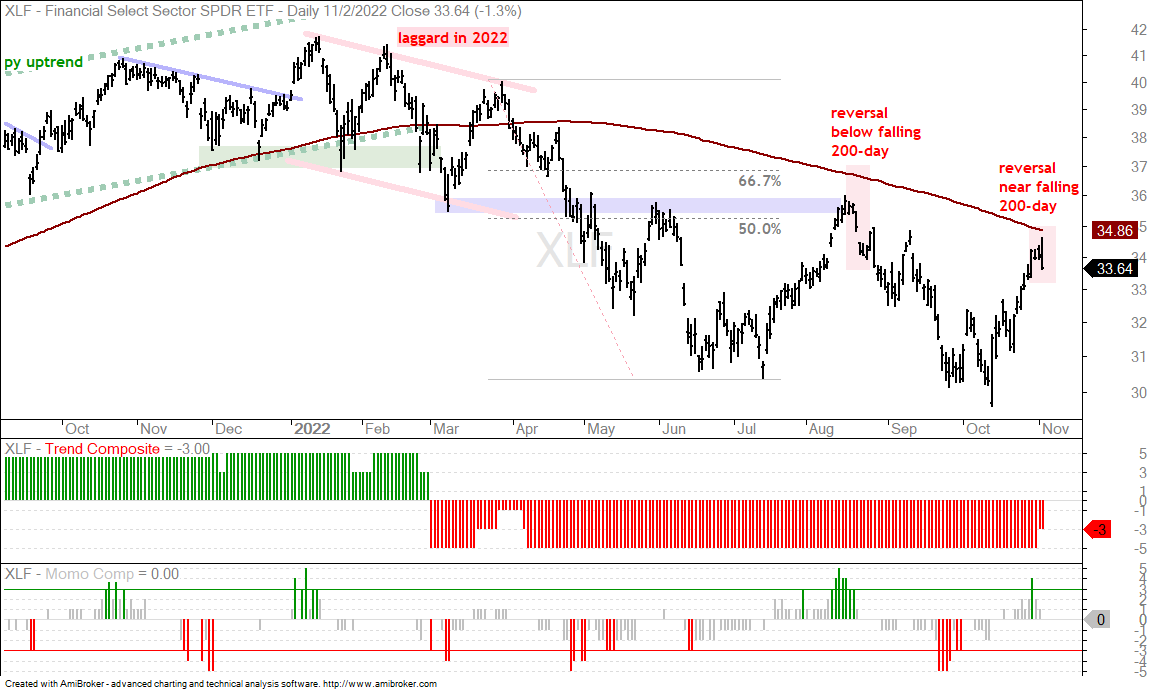
The Finance SPDR (XLF) produced one of the sharpest bounces over the last few weeks, but this bounce is also considered a counter-trend move. XLF surged to the falling 200-day SMA and then reversed with a sharp move lower on Wednesday. Also note that this surge started from a 52-week low, which is from a position of weakness, not strength.
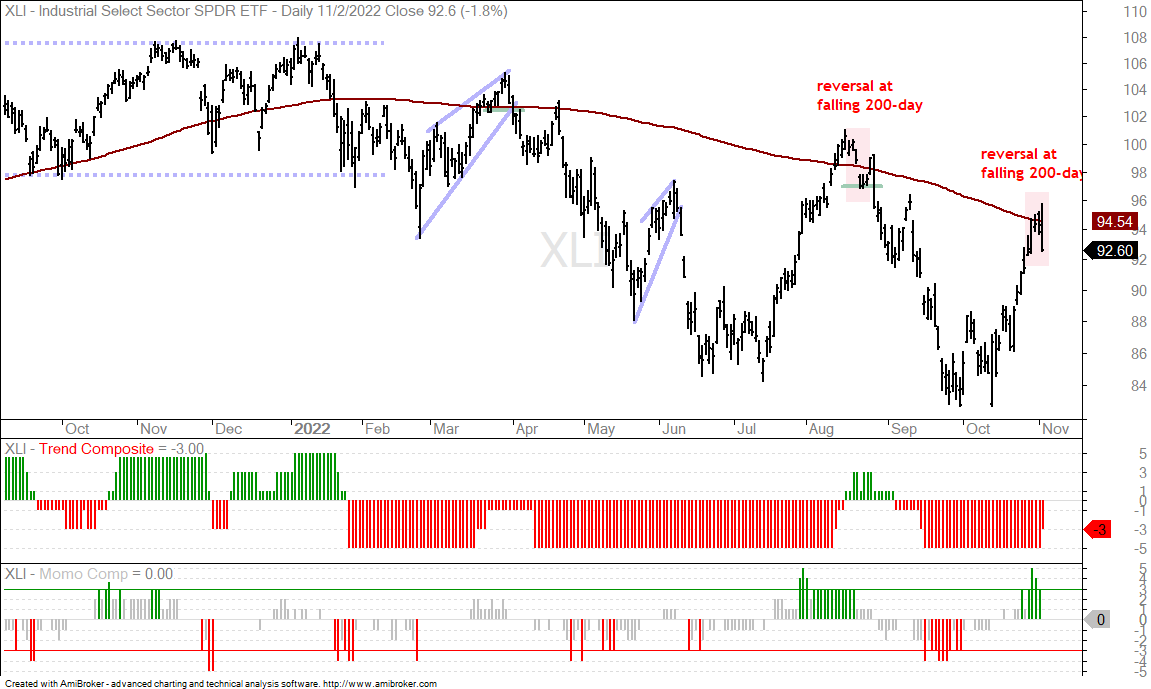
The Industrials SPDR (XLI) produced perhaps the biggest bounce as it exceeded the 200-day SMA intraday, but then sharply reversed on Wednesday with a 1.8% decline. XLI is still in a downtrend overall and the current advance also started from a position of weakness (52-week low).
You can learn more about exit strategies in this post[4], which includes a video and charting options for everyone.
DB Energy ETF Bucks the Selling Pressure (DBE)
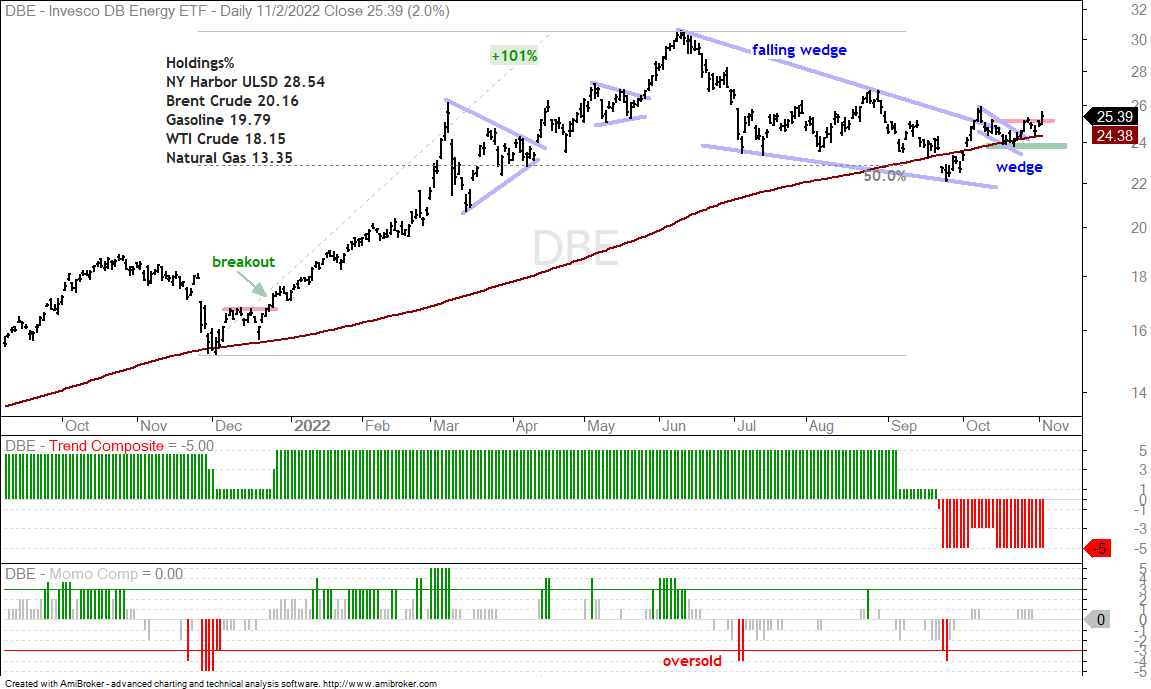
The DB Energy ETF (DBE) bucked the selling pressure on Wednesday to close with a 2.1% gain. West Texas Intermediate, Brent, Gasoline and Natural Gas were all up on Wednesday. Oil and DBE are tough calls because the trend since summer is down, but the trend since late September is up. They would be in the process of reversing the downtrends that started this summer. DBE surged some 100% from December to June and then retraced half with a falling wedge into late September. A falling wedge that retraces half is typically a correction within a bigger uptrend. Think two steps forward and one step backward. DBE broke the wedge line in early October, fell back with a small wedge and is turning back up again. DBE is also back above its rising 200-day. The late October low marks the first support level to watch going forward.
DB Base Metals ETF Leads Lower (DBB)
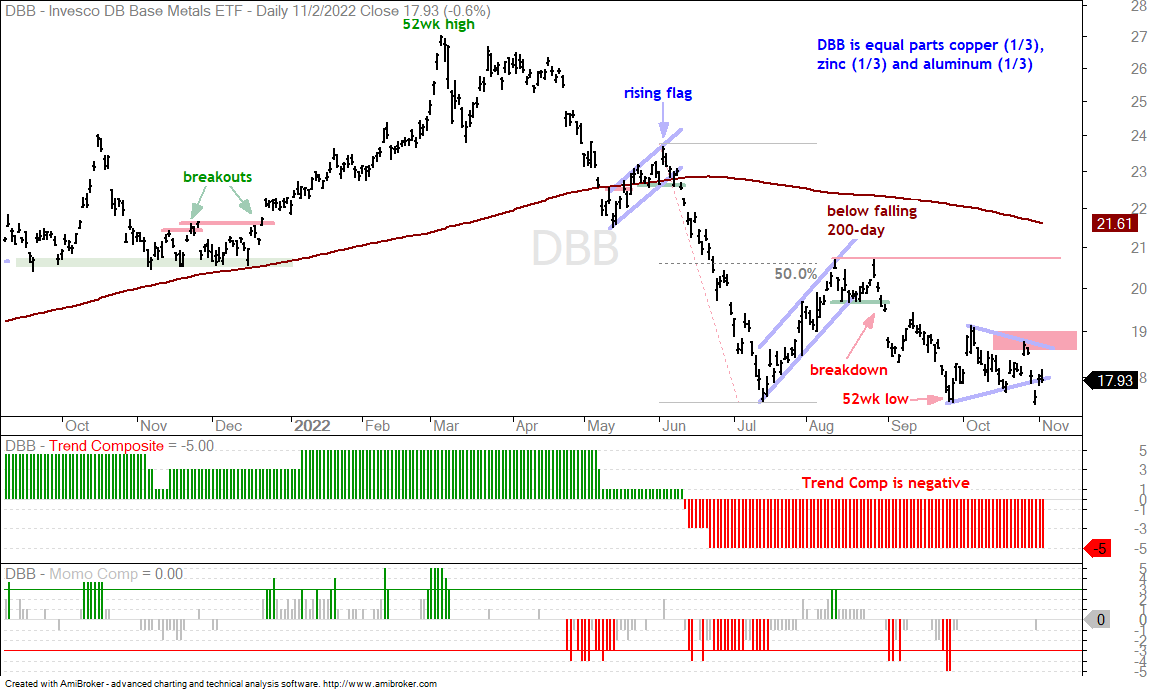
The DB Energy ETF is holding up well, but the DB Base Metals ETF (DBB) is not as it broke triangle support with a sharp decline last week. This ETF also hit a new low (intraday) and remains in a downtrend. This triangle is a short-term continuation pattern and the prior move was down, which means it is a short-term bearish continuation pattern. The break is bearish and resistance is set at 19.
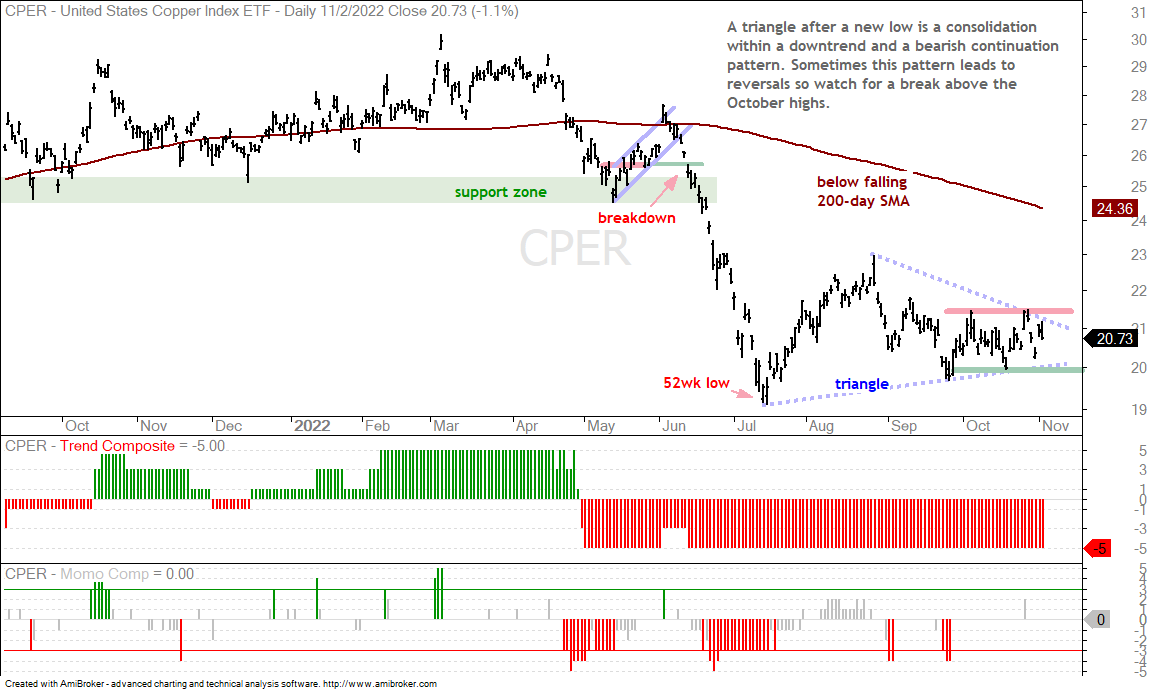
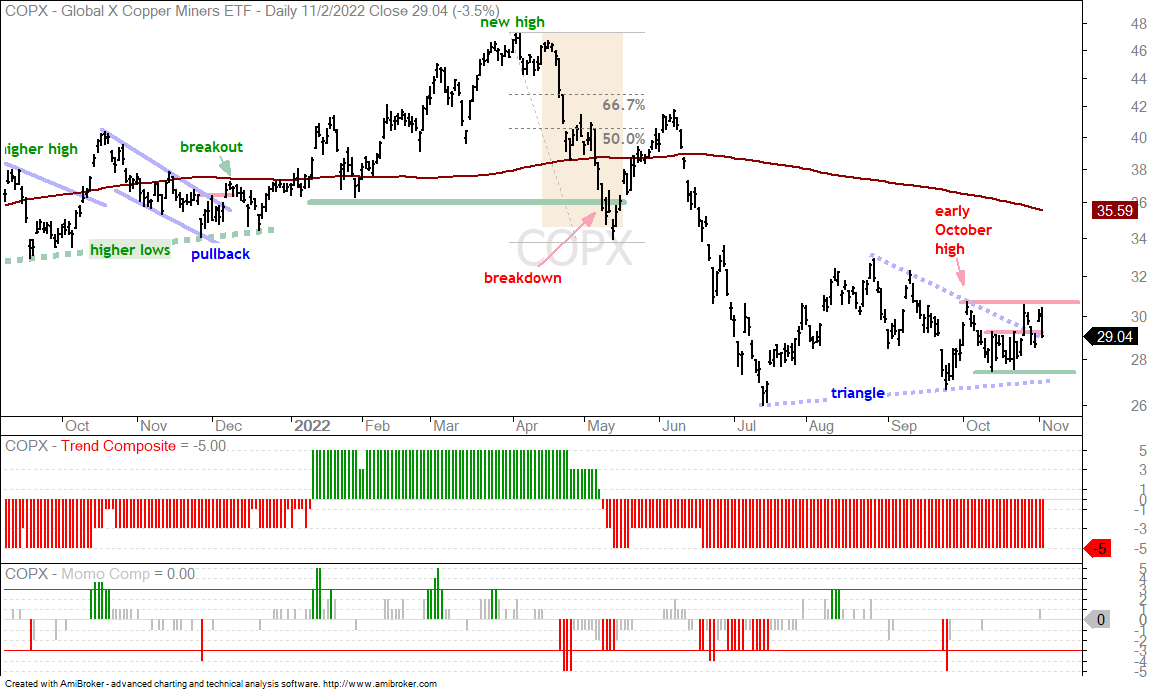
Copper Consolidates within a Downtrend (CPER, COPX)
DBB is equal parts (thirds) Copper (COPPER1!), Aluminum (ALI1!) and Zinc (ZINC1!). Zinc is leading the way lower for these three with a 8% plunge to new lows in late October. The Copper ETF (CPER) is holding up better because it has yet to breakdown to new lows, but the bigger trend is down because CPER is below the falling 200-day and the Trend Composite is negative. CPER is still consolidating with a large triangle and I am watching the October range for the next directional clue. A break above 21.5 would be bullish, while a break below 20 would be bearish.
The next chart shows the Copper Miners ETF (COPX) with similar characteristics.
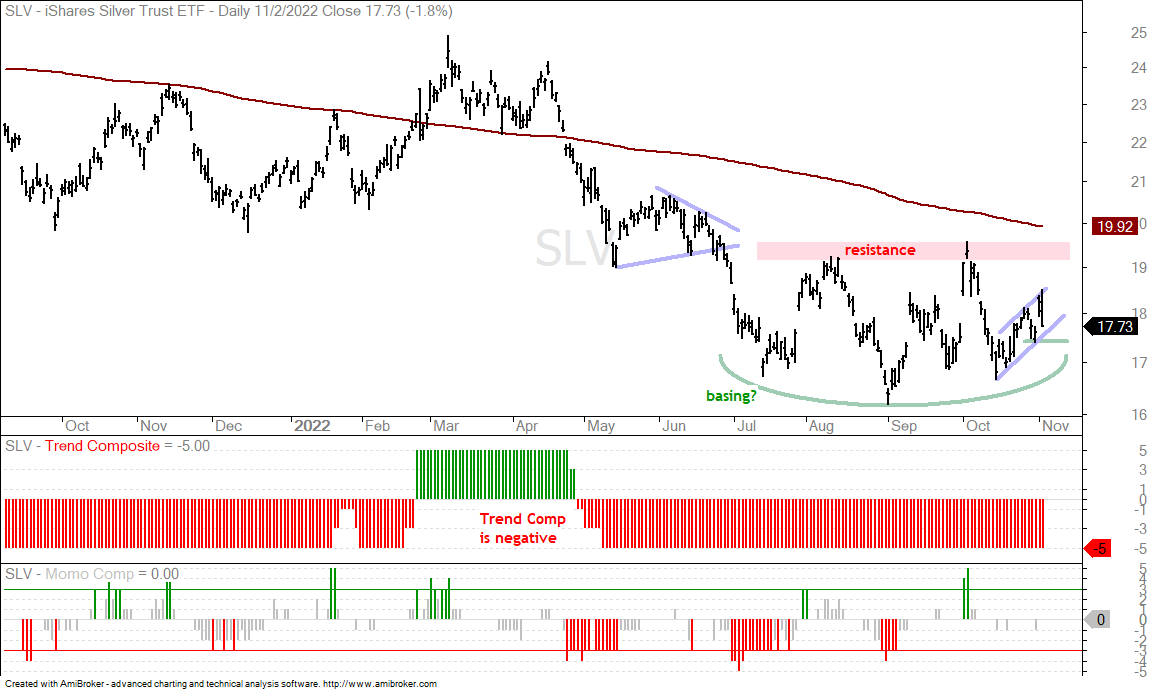
Silver ETF Firms within Downtrend (SLV)
The Silver ETF (SLV) is in a downtrend overall, but the ETF found support in the 17 area and consolidated over the last few months. Copper and silver highlight the need for some rules-based analysis. First rule: the big trend sets the trading bias. Copper is in a long-term downtrend and this means we should have a bearish bias. The triangle could result in a reversal, but the odds favor a breakdown because the bigger downtrend is the dominant force. The same goes for SLV. The green line shows support and a possible rounding bottom of sorts, but the bigger trend is down and this should set the bias. A break above the August-October highs is needed to reverse this downtrend. Short-term, SLV fell sharply in early October and then formed a rising flag, which is a short-term bearish continuation pattern. A flag break at 17.5 would signal a continuation lower.
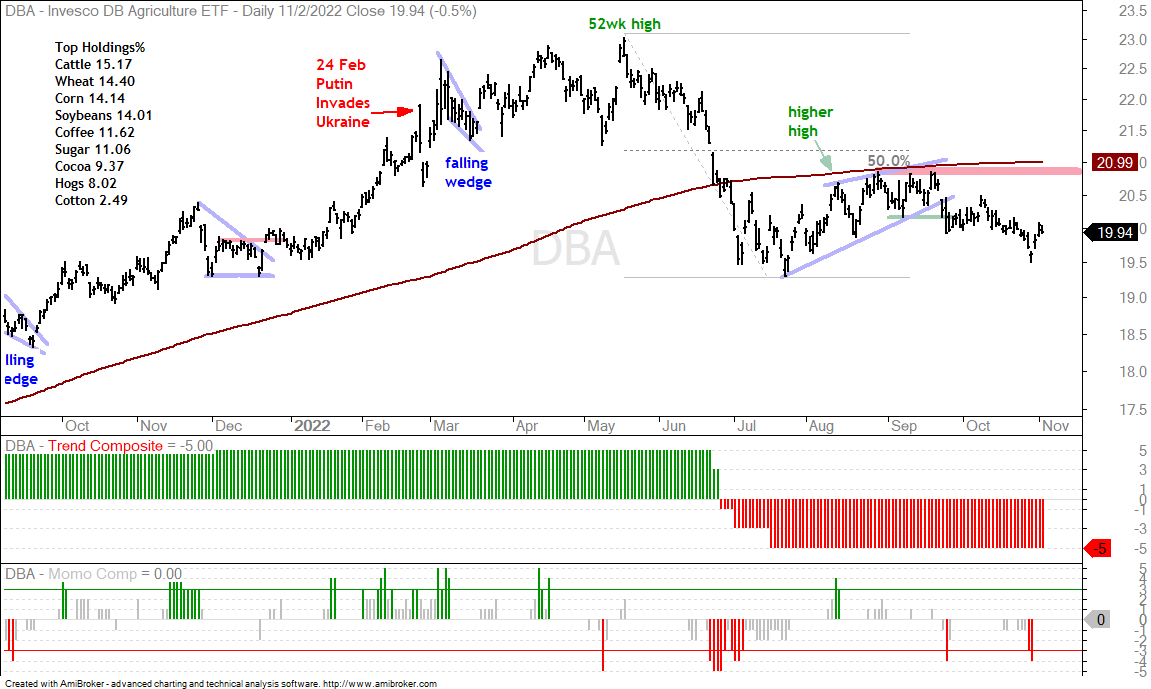
DB Agriculture ETF Holds Wedge Break (DBA)
Now let’s apply the rules to the DB Agriculture ETF (DBA). First, the long-term trend is down because DBA is below the 200-day and the Trend Composite is negative. This argues for a bearish bias and means bearish patterns carry more weight than bullish patterns. DBA formed a rising wedge into mid September and retraced a little less than 50% of the prior decline. The ETF then broke wedge support on September 26th and remains in bear mode. A close above 21 would break long-term resistance and reverse the bigger downtrend.
Soybeans and Corn Bullish, Wheat Bearish (SOYB, CORN, WEAT)
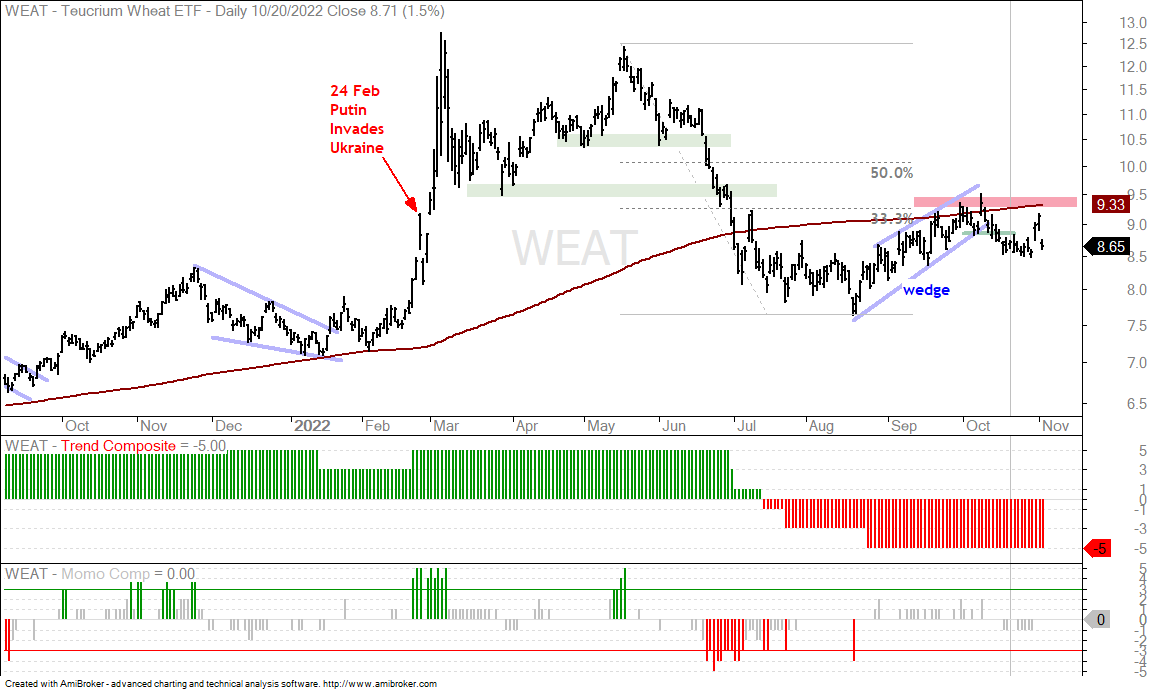
The grains are important parts of the DB Agriculture ETF, but these are split. The Soybean ETF (SOYB) and Corn ETF (CORN) are in uptrends, while the Wheat ETF (WEAT) is in a downtrend. WEAT is in a long-term downtrend because it broke down in June, is below the 200-day and the Trend Composite is negative. The ETF formed a rising wedge into October and retraced just over a third of the prior decline. WEAT broke wedge support on October 16th to signal a continuation lower. There was a pop on Monday-Tuesday after Russia decided not to honor the shipping agreement for wheat in the Black Sea. Russian then u-turned and rejoined the grain deal, causing WEAT to fall sharply on Wednesday. It is a mess, but the wedge break looks like the dominant pattern at work here. A break above 9.5 would argue for a re-evaluation.
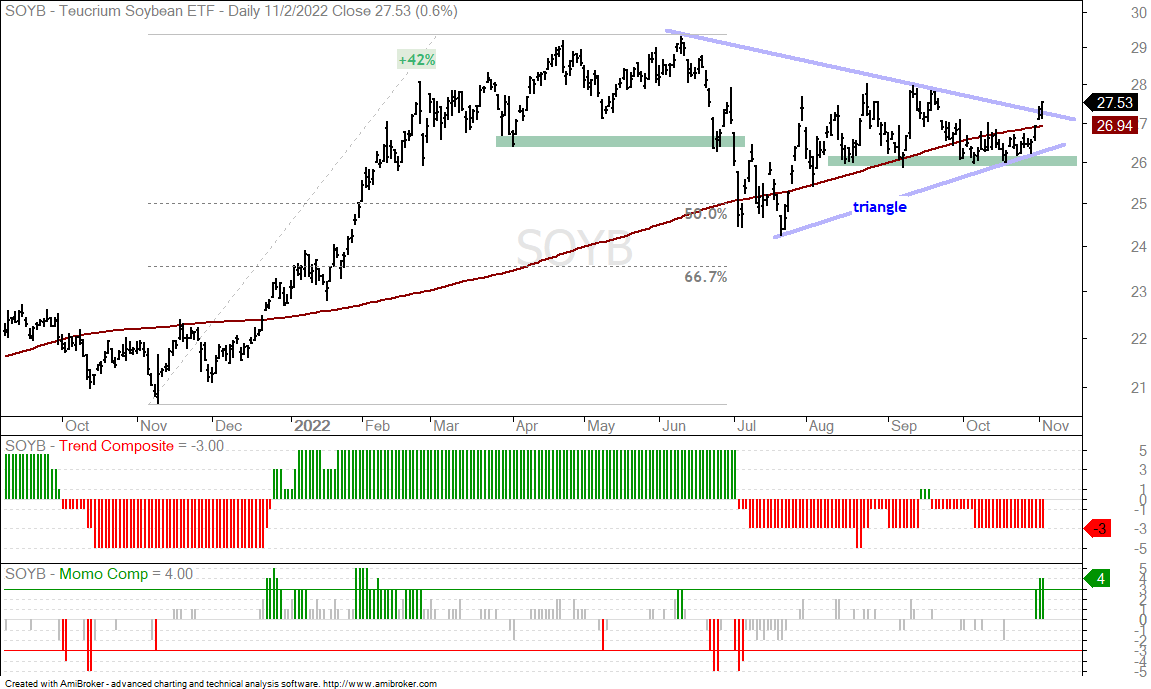
The long-term trend for SOYB is less clear. The Trend Composite is negative, but price is back above the rising 200-day SMA. SOYB is also breaking out of a large triangle and this looks like a big bullish continuation pattern. SOYB surged over 40% from November to June and then broke down with a sharp decline into July. The ETF then moved into a trading range and held support in the 26 area from mid August to October. The triangle looks like a rest after a big advance and the breakout signals a continuation higher. Support remains at 26 and a close below this level would argue for a re-evaluation.
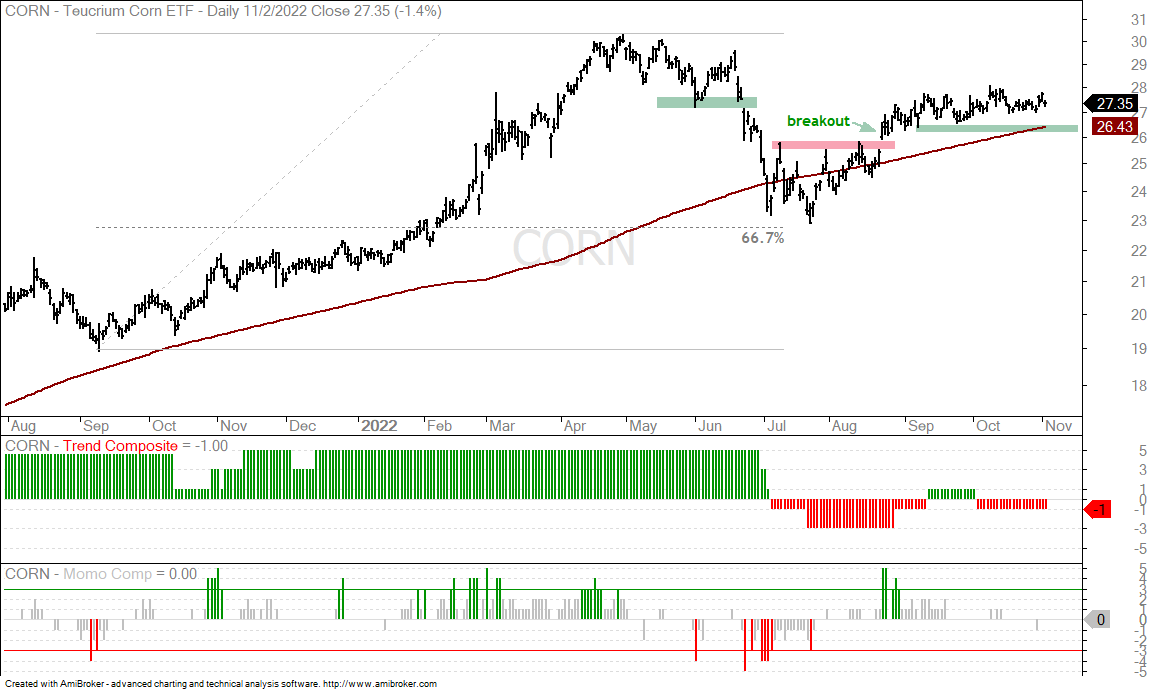
The Corn ETF (CORN) is similar to SOYB. There was a breakdown in June-July and then a recovery into August. CORN moved back above the rising 200-day and is holding above this long-term moving average, even though the Trend Composite is negative. CORN has not moved much in the last two months, but I would consider it bullish as long as it holds 26.