Market Timing Models – Three Big Sectors are Dragging – Could Tech Be Next?
Posted By
Arthur Hill, CMT
On
In
Archive |
No Comments
Average Stock Still Struggling
There are two sides to relative strength. Namely, one name is leading and one is lagging. Large-caps led the market earlier this year when it was hitting new highs, they held up better during the March swoon and they are leading again on the rebound. By extension, small-caps and mid-caps are lagging. They underperformed on the way up in February, fell harder on the way down in March and are underperforming on the current rebound.
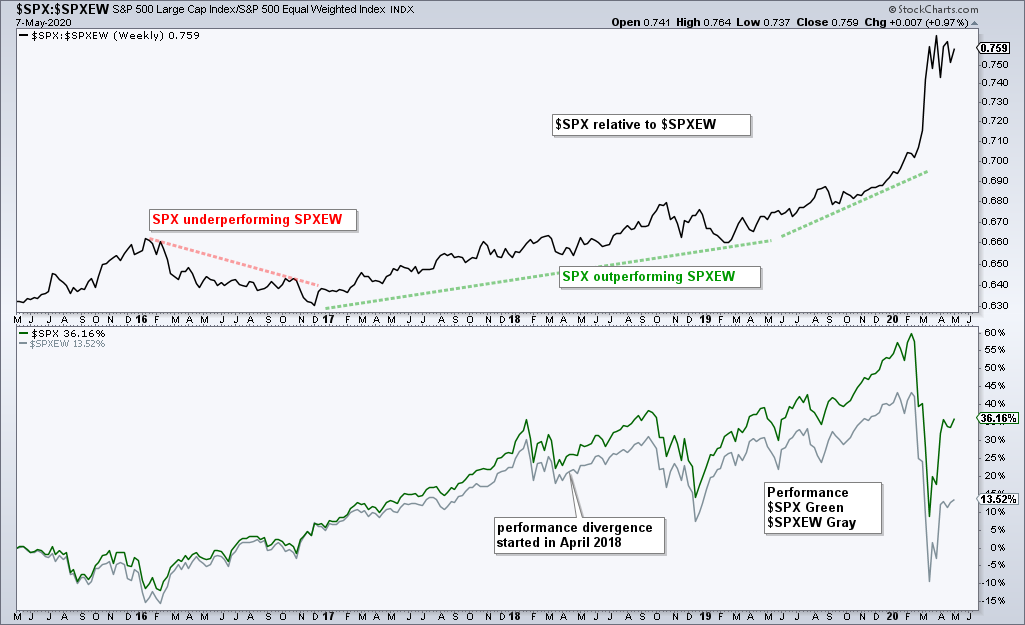
The S&P 500 is a large-cap dominated index that has been leading for as long as I can remember. Granted, my memory is not what it used to be. This is why we have historical charts: to jog the memory. The chart below shows the S&P 500 relative to the S&P 500 Equal-Weight Index in the top window and 5-year performance for each in the lower window. 2016 was the last time SPXEW outperformed its big brother, SPX.
SPX started outperforming SPXEW in 2017. This trend accelerated in 2019 and went parabolic in 2020. The bottom window shows 5-year performance with SPX up 36% and SPXEW up a mere 13.50%. What a difference. SPX generated nice returns and SPXEW generated paltry returns
Looking for the culprits? Note that the top ten stocks in the S&P 500 account for 27.66% of the index. The top 20 account for 37% and the top 50 account for 55%. The remaining 450 stocks in the S&P 500 account for less than 50%. The large get larger and their slice of the pie grows. Passive investing via ETFs has also contributed to demand for large-cap stocks.
Even though large-caps are still preferred over non-large-caps, there is still some value in the S&P 500 Equal-weight index because it reflects performance for the average stock. In addition, the sector weightings are more evenly distributed and it is more representative of the market as a whole. Technology is a mere mortal at 14.84%, Industrials is almost as big at 14.3% and Consumer Discretionary clocks in at 12.54%. Notice that the Communication Services sector is the smallest sector in the equal-weight S&P 500.
The equal-weight S&P 500 still has a bearish configuration. The index broke down with the rest of the world in late February and hit new lows in March. SPXEW is up some 25% the last seven weeks, but this massive advance retraced just half of the prior decline. It is still a two steps down and one setup up sequence. The retracement advance is still in play, but the index stalled the last four weeks (blue oval) and this bounce is getting long in tooth.
The Technology and Healthcare sectors are enough to power the S&P 500, but the equal-weight S&P 500 needs participation from the other key sectors: Consumer Discretionary, Industrials and Finance. I am not seeing this participation. In fact, these three still look bearish overall and they represent key components of the economy. We will explore this further in the commentary.
In case you missed it, I posted the backtest results for StochClose signals on Tuesday. The third installment of this series will be next week. We will look to improve returns by using a momentum concept and adding a profit target. Also, I posted an article on monthly seasonality on Thursday. These can be found on the main analysis page.[1]
Index Breadth Model Remains Bearish
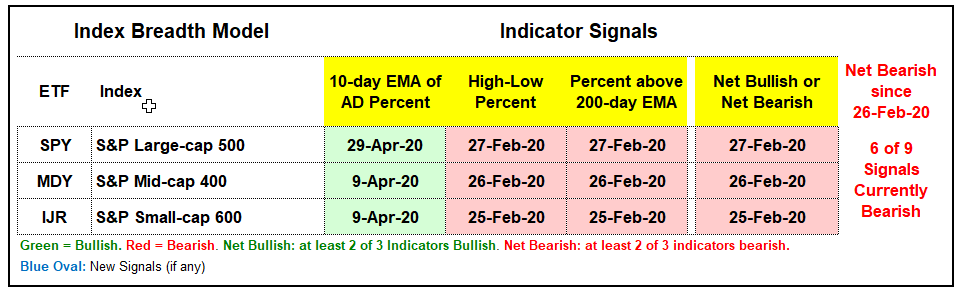
There is no change in the Index Breadth Model. The three breadth thrust signals are bullish, but the six longer term signals are still bearish. Even though the surge over the last seven weeks triggered these breadth thrusts, we need follow through and signals from the longer term indicators to make this more than just a counter-trend bounce.
Breadth Indicator Overview
The breadth thrust indicators triggered bullish for small-caps and mid-caps on April 9th, and for large-caps on April 29th. Breadth thrust signals are usually the first to trigger. This means they can offer earlier entries, but the chances of whipsaw are also higher.
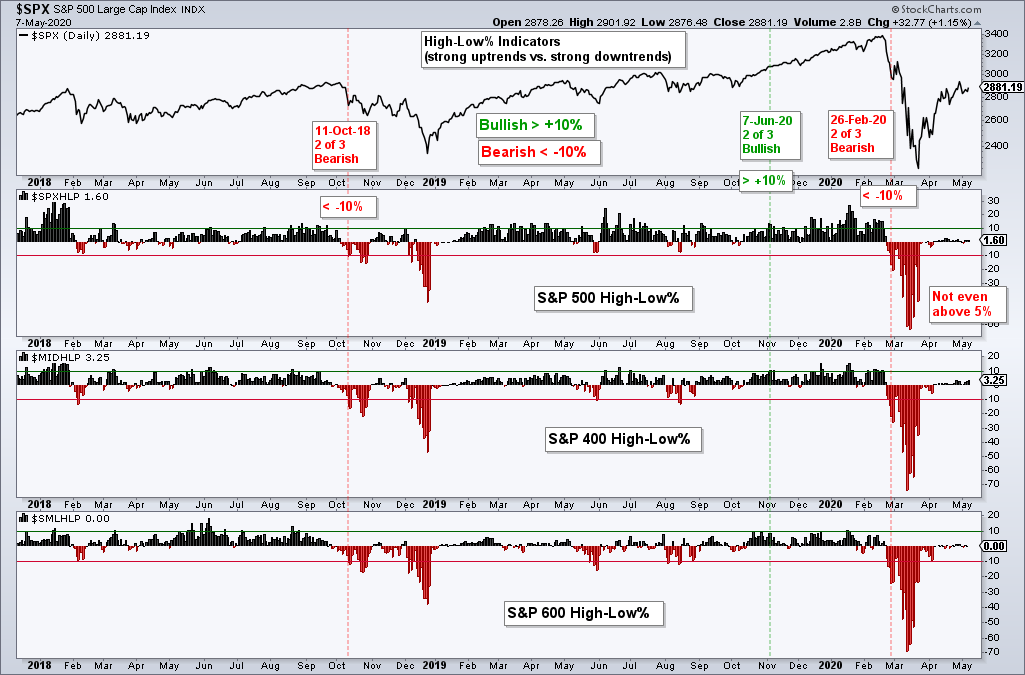
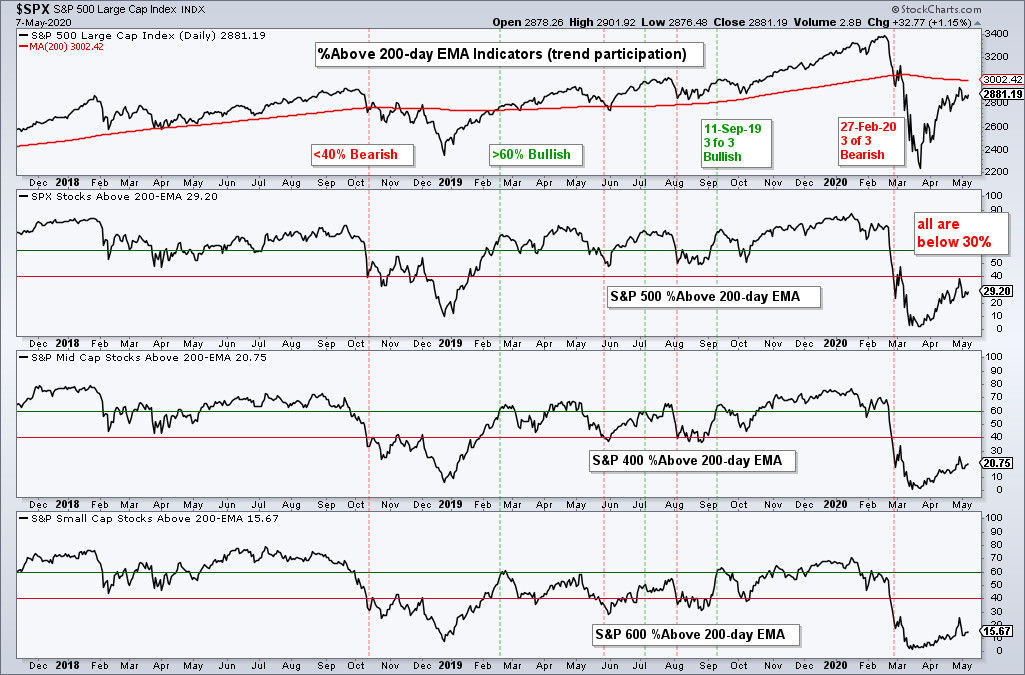
The High-Low Percent indicators are not even close to triggering bullish signals, which require a move above +10%. New highs represent leading stocks in strong uptrends and these are needed to support a bull market. In an interesting twist, S&P MidCap 400 High-Low% ($MIDHLP) is slightly stronger than S&P 500 High-Low% ($SPXHLP). S&P SmallCap 600 High-Low% ($SMLHLP) is clearly the weakest of the three.
The percent above 200-day EMA indicators are also FAR from bullish signals. Moreover, not one is above 30% (as of Thursday’s close). A move above 60% is needed to show enough stocks in uptrends to support a bull market. Much more work is required here as well.
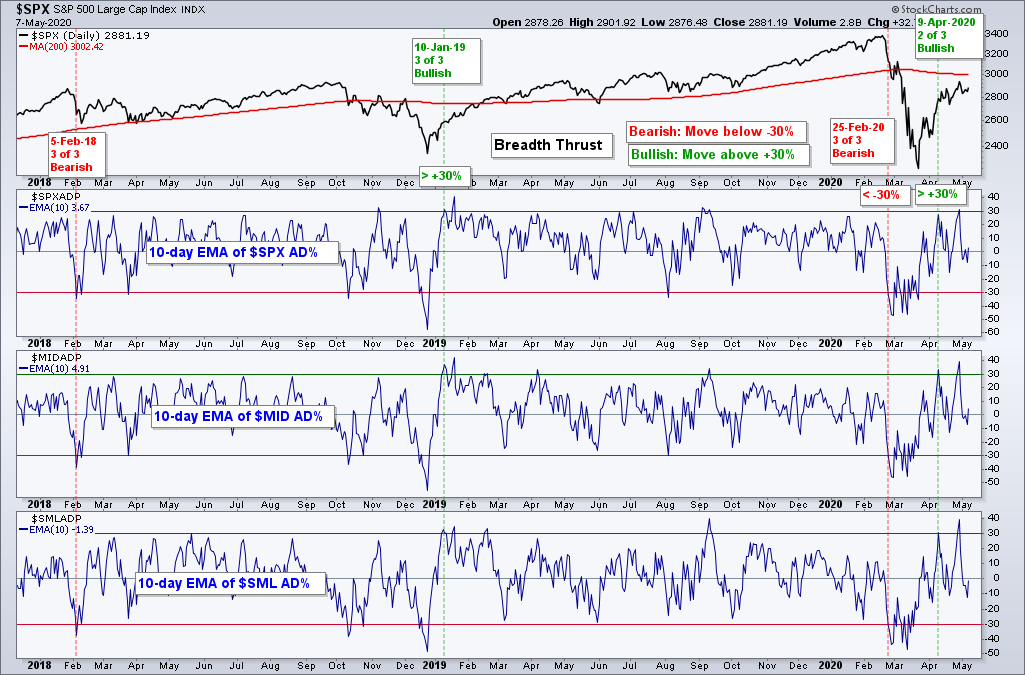
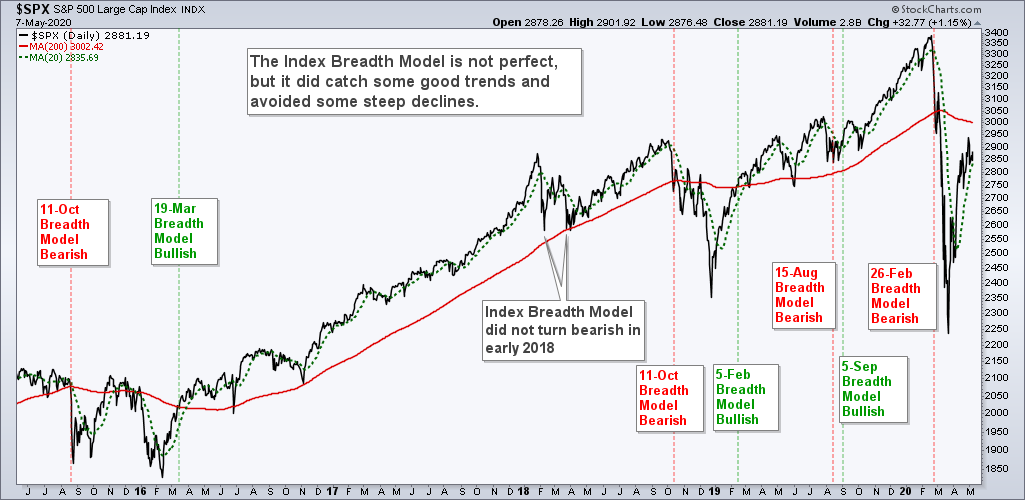
The image below shows the Index Breadth Model signals over the last five years. The S&P 500 rebounded sharply after a 52-week low and serious oversold condition in mid March, but remains below the 26-February close 3111, which is when the bearish signal triggered.
Click here for an article and video[2] explaining the indicators, signals and methodology used in the Index Breadth Model. This article also includes the signals of the last five years.
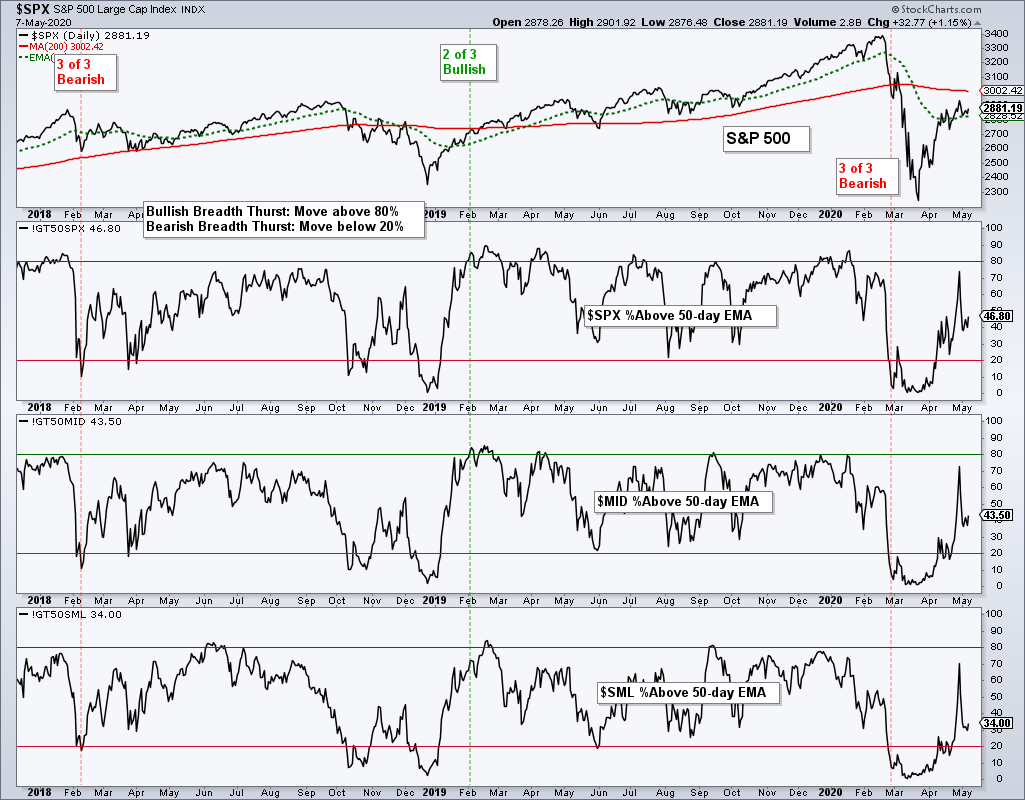
%Above 50-day EMA Indicators Deteriorate
The next chart shows the percent above 50-day EMA indicators, which require a move above 80% to trigger bullish. This indicator group is not part of the index breadth model right now. The 50-day EMA is a medium-term trend indicator and I am looking for significant shifts for signals. These indicators surged above 70% last week and fell short of bullish signals. They fell back sharply this week with moves below 50%. S&P 600 %Above 50-day EMA (!GT50SML) was cut in half with a move from 70% to 34%.
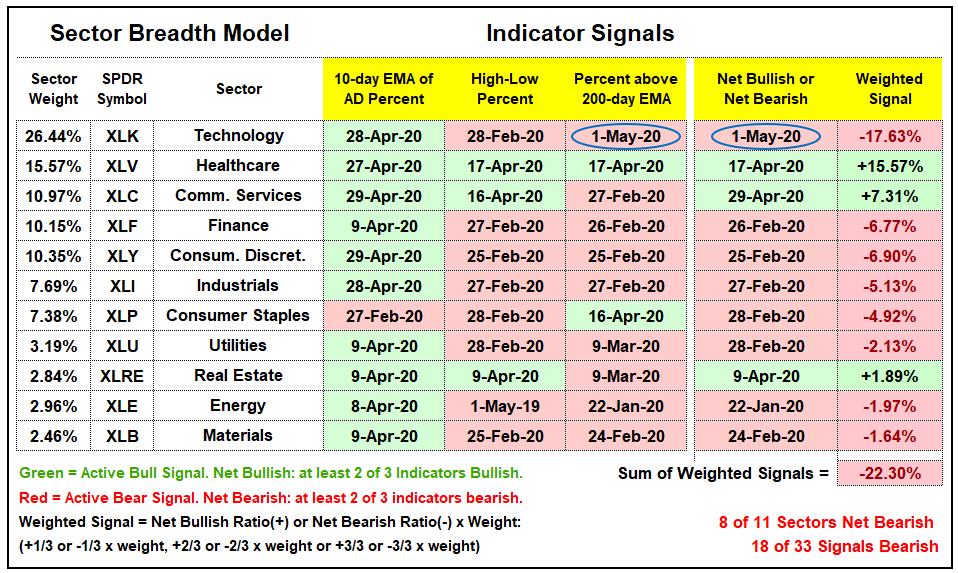
Sector Breadth Model gets Big Bearish Signal
The Sector Breadth Model was mixed last week because the sum of the weighted signals was positive, but the majority of sectors were net bearish and 17 of 33 signals were bearish. This changed as Tech %Above 200-day EMA (!GT200XLK) dipped below 40% on May 1st to trigger a bearish signal and turn the biggest sector net bearish. This one indicator caused a big shift in the sum of the weighted signals because Tech went from 2/3 bullish to 2/3 bearish. High-Low Percent stayed bearish throughout these signal changes. %Above 200-day EMA was the swing vote and the reason the group went from 2 of 3 bullish signals to 2 of 3 bearish signals.
Overall, we can see 10 bullish breadth thrust signals, but 8 bearish High-Low Percent signals and 9 bearish %Above 200-day EMA signals. The vast majority of long-term indicators are still red and bearish. Healthcare, REITs and Communication Services are the only three bullish sectors. REITs account for just 3% and XLC has just 22 stocks.
XLK Flips to Bearish
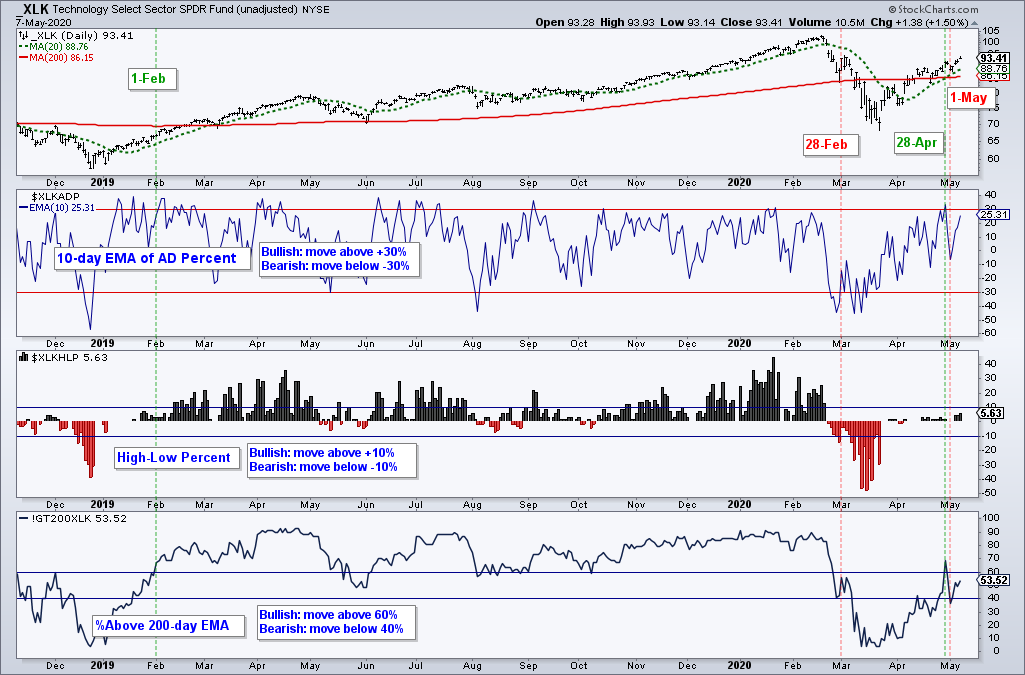
The next chart shows the three breadth indicators for XLK and four signals over the last 18 months. XLK triggered bullish on February 1st when two of the three indicators (green lines) were on active bullish signals and bearish on February 28th (red line). There was a bullish signal on April 28th when %Above 200-day EMA exceeded 60%, but this quickly reversed with a move below 40% last Friday. Lots of stocks in the Technology sector are flirting with their 200-day EMAs and a little volatility can cause these whipsaws.
Whipsaws are all part of the process and represent expenses. Trends are also part of the process and represent revenues. In theory, a few good trends should cover our expenses and leave something left over. In any case, the flip in Technology is important because it is the biggest sector and the current leader.
Weakness in 3 Key Sectors
With Technology flipping back to bearish, four of the six biggest sectors are net bearish and four of the five offensive sectors are net bearish. Healthcare is the second biggest sector, but it is not part of the offensive group. Within offense, Consumer Discretionary, Finance, Industrials and Technology are net bearish. Communication Services is the only one still net bullish. This is not a bullish configuration for the broader market.
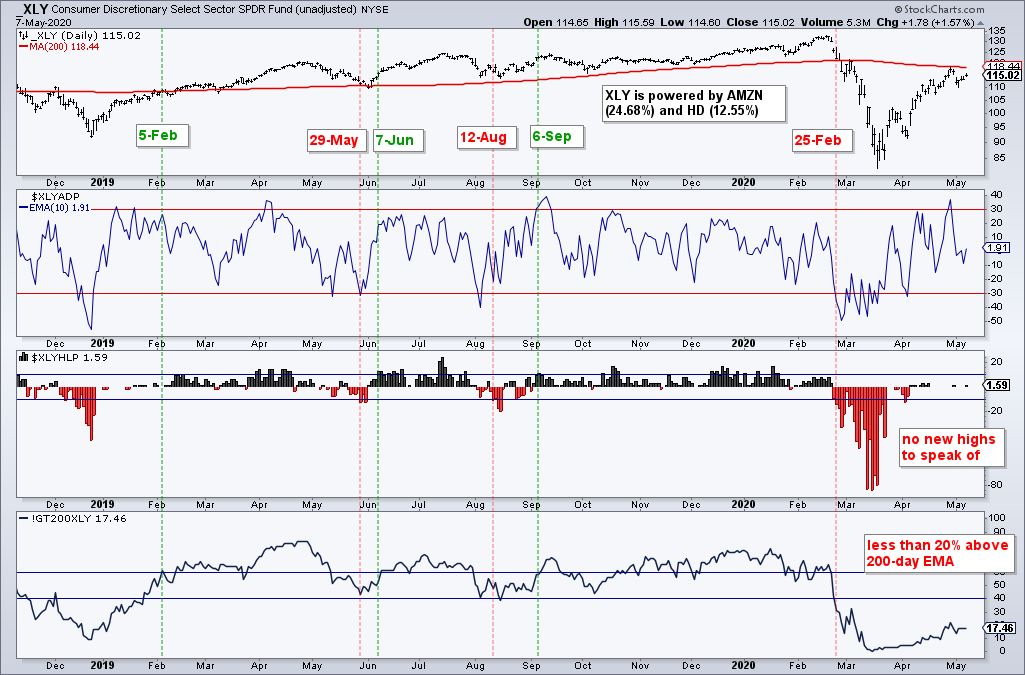
XLY is powered by Amazon and Home Depot, which account for 24.68% and 12.55%, respectively. Thus, XLY is not exactly representative of the Consumer Discretionary sector as a whole. The breadth indicators even the score by treating all stocks equally. On the charts below, the green lines show when the breadth indicators turned majority bullish and the red lines show when they turned majority bearish. XLY turned net bearish on February 25th. There was a bullish breadth thrust in late April, but there are no new highs to speak off and %Above 200-day SMA is below 20%. The longer-term indicators are clearly bearish.
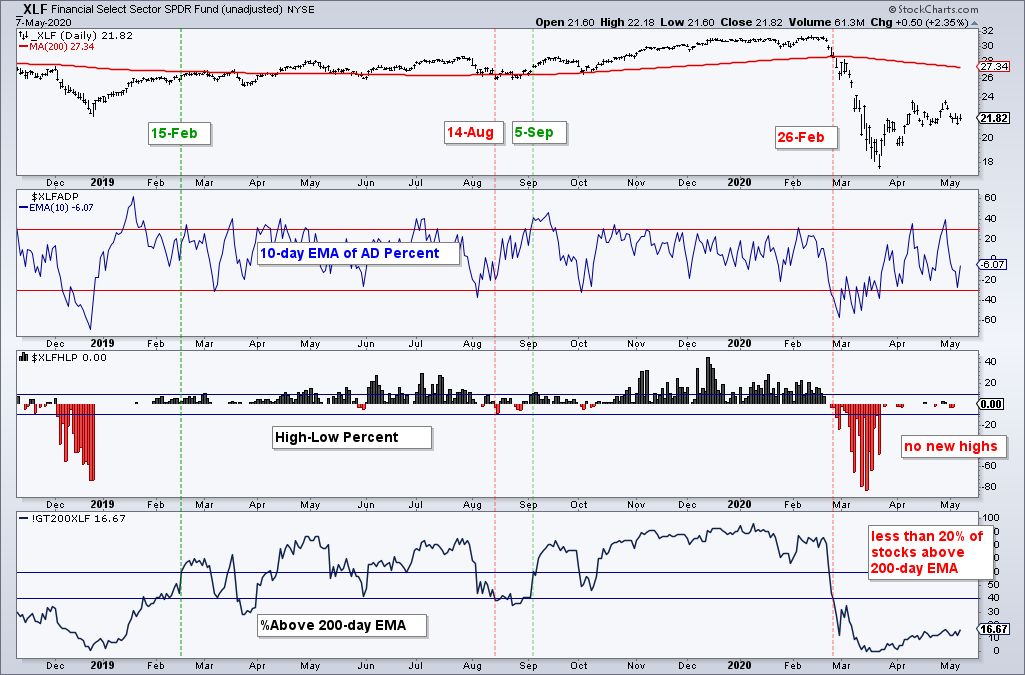
XLF turned net bearish on February 26th. There was a bullish breadth thrust in early April, but new highs never expanded and %Above 200-day EMA never got above 20%.
XLI turned net bearish on February 27th. There was a bullish breadth thrust in late April, but High-Low Percent and %Above 200-day EMA are nowhere near bullish signals. There were a few new highs in XLI this week, but %Above 200-day EMA has yet to exceed 40%.
Price Divergence in Key Sectors
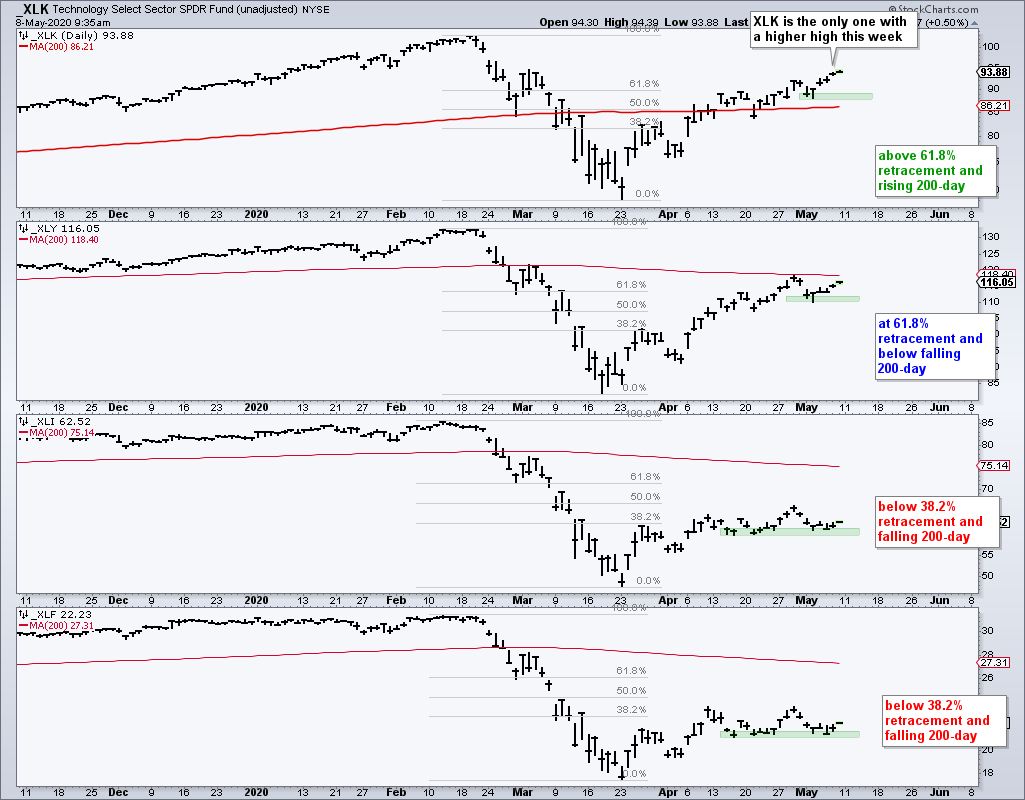
XLK forged a higher high this week and leads, but this new high was not confirmed by XLY, XLI or XLF. Even though these non-confirmations are quite short-term, they show a divide in the broader market. The green zones on the charts mark support for each. XLY and XLI are at support and SPY is still in a short-term uptrend. Thus, a bounce off support is possible. Notice that I am using the Friday-Monday lows to mark support for XLK and XLY, but the mid April lows to mark support for XLI and XLK. The latter two have gone nowhere for four weeks now. Support breaks would be negative and could signal the end of this big counter-trend bounce.
Yield Spreads and Fed Balance Sheet
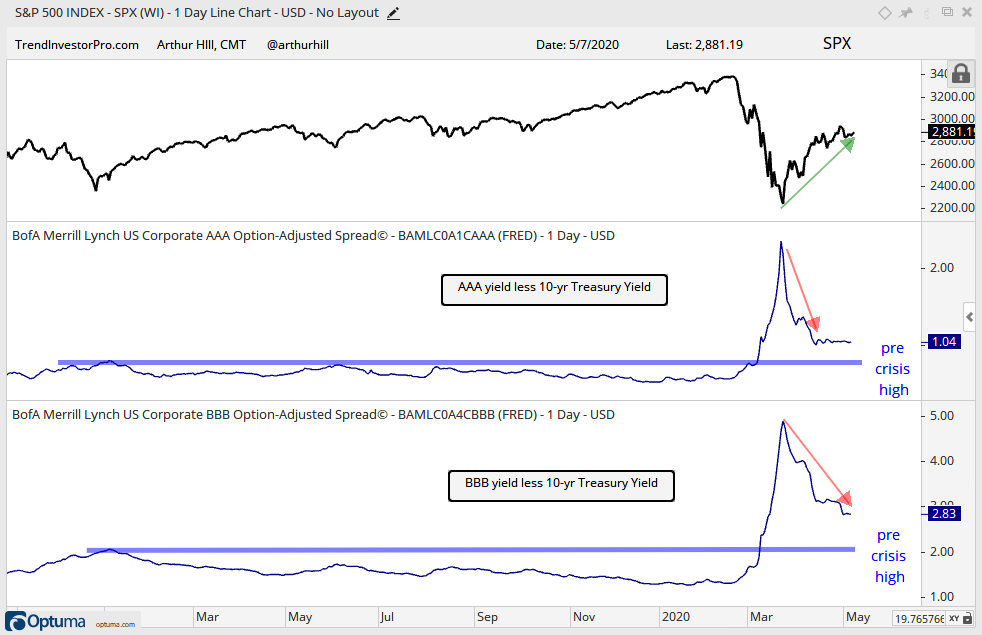
The next chart shows the S&P 500, the AAA bond spread and the BBB bond spread with the blue lines marking the pre-crisis highs. BBB bonds are the lowest rated of the investment grade bonds. Both bond spreads surged in the first half of March, peaked on March 23rd and fell sharply. The AAA bond spread stabilized around 1% and just above the pre-crisis high. The BBB bond spread fell further the last few weeks, but remains well above its pre-crisis high. Nevertheless, it is falling and this shows positive developments in the credit markets. An upturn in spreads would be negative.
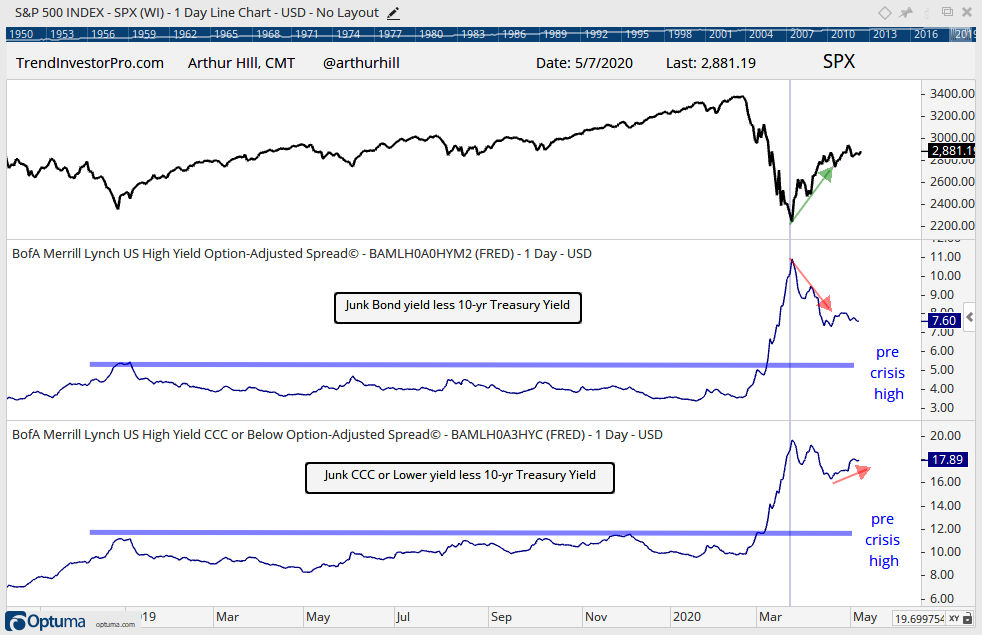
The next chart shows the junk bond spread and the CCC or lower spread. Junk bonds carry the highest risks and CCC bonds represent the junk of the junk. The picture is a little different here. These junk bond spreads also fell, but they hit a low on April 17 and bounced. The CCC or lower spread is back above 17% and this shows some stress in the highest risk bonds.
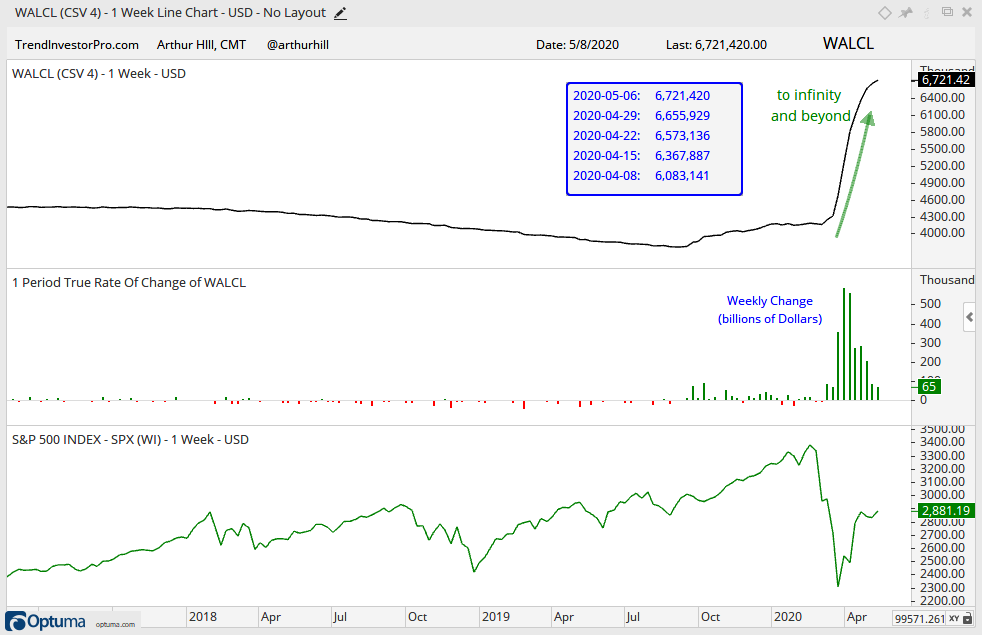
The Fed balance sheet also expanded again this week, but this week’s $65 billion increase was the smallest since February. Overall, we still have a moon shot with the balance sheet expansion over the last two months and this money is finding its way into financial assets.
As noted before, monetary policy can prevent a meltdown in the credit markets (financial crisis) and fiscal policy can lessen the pain of an economic contraction. Together, these two can put a floor on stocks and bonds, but they do not remove the ceiling. Moreover, monetary and fiscal stimulus were ramping up in October 2008 and the S&P 500 did not bottom until March 2009.