A changing of the guard may be in the works as small-caps, banks and utilities take the lead short-term. It all started on 25-Sept when the small-cap and banking ETFs surged from their lagging positions. Large-caps and large-cap techs participated in this surge, but many did not exceed their early September highs. IWM, KRE and XLU exceeded these highs and showed short-term leadership. Can it continue?
Stocks largely surged from 25-Sept to 12-Oct and then largely consolidated the last seven days. Traders interested in the short-term can analyze 30 minute charts on the 25 day timeframe to see the falling flags and wedges that formed. It is also worth noting that the S&P SmallCap 600 SPDR is consolidating at resistance with an Ascending Triangle taking shape.
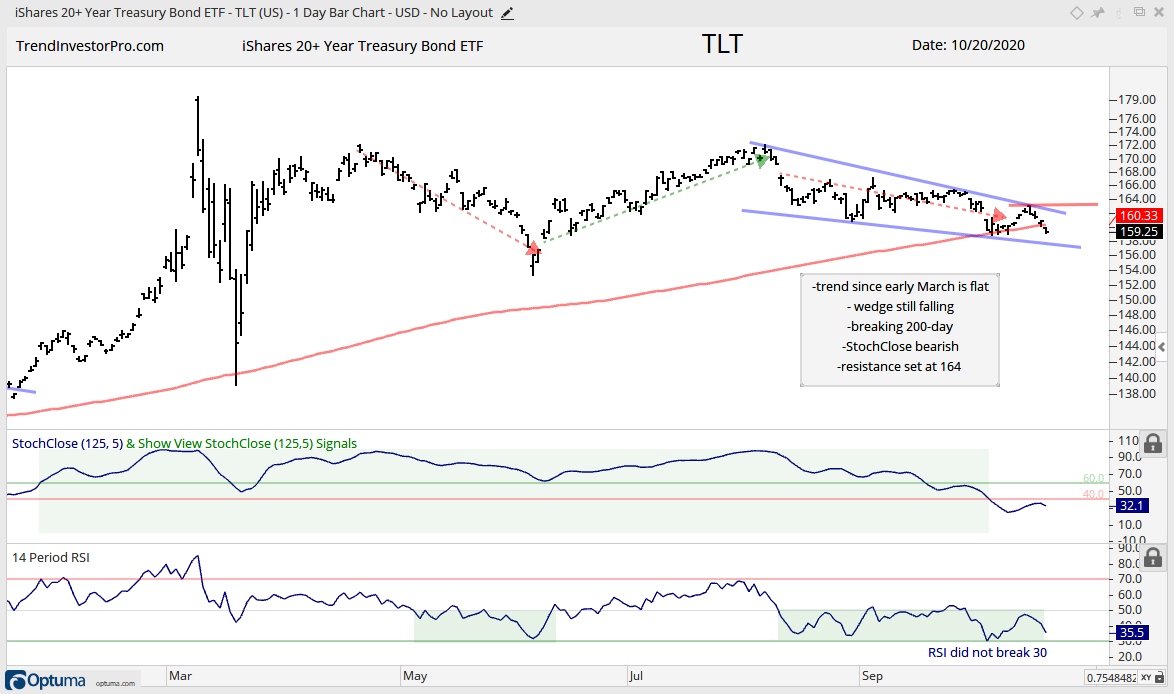
The Treasury bond and investment grade corporate bond ETFs continue to struggle as their corrections extended this week. Given strength in the stock market and the resurgence in small-caps, it is unsurprising to see money wander away from these safe-haven assets. I suspect that TLT will not break out unless we see a bearish reversal in the stock market, and I do not see that happening right now.
ETF Grouping and Ranking by Trends, Patterns and Setups
The first group of ETFs tagged new highs in October and are leading the pack. After tagging these new highs in mid October, these ETFs pulled back or consolidated over the last week or so. The new highs affirm the overall uptrends and make them leaders.
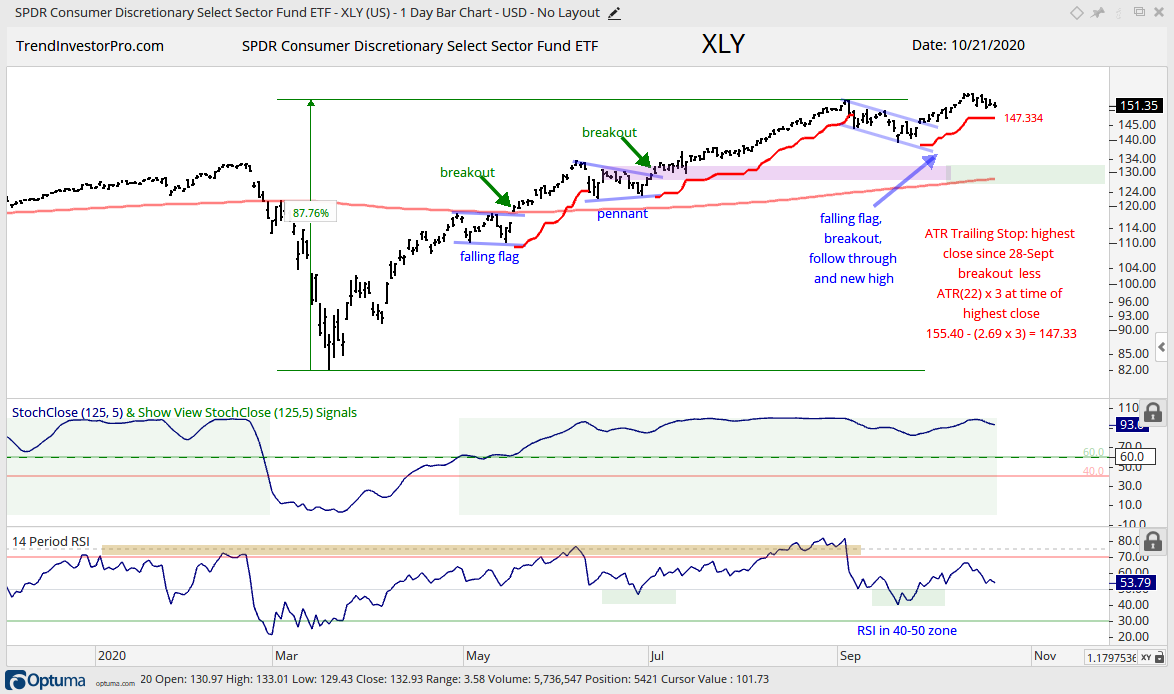
The chart below shows the Consumer Discretionary SPDR (XLY) with a falling flag breakout on 28-Sept and follow through to new highs. The red lines show the ATR Trailing Stop placed on the last three breakouts (flag, pennant, channel). This indicator is three ATR(22) values below the highest close since the breakout and the ATR values are those at the time of the highest close (13-Oct in this case). I used three as the ATR multiplier to set the initial stop just below the low of the flag. Notice how the other three stops start just below the low prior to the breakout. The ATR Trailing Stop rises when prices rise and keeps you in the position as long as it works. Currently, a close below 147.33 would trigger this stop. Such a move would not, however, reverse the uptrend. The ATR Trailing Stop is just a trade management tool to consider.
You can learn more about trailing stops in Tuesday’s post[1], which covers four different exit strategies (trend reversal, Chandelier, Parabolic SAR and ATR Trailing Stop).
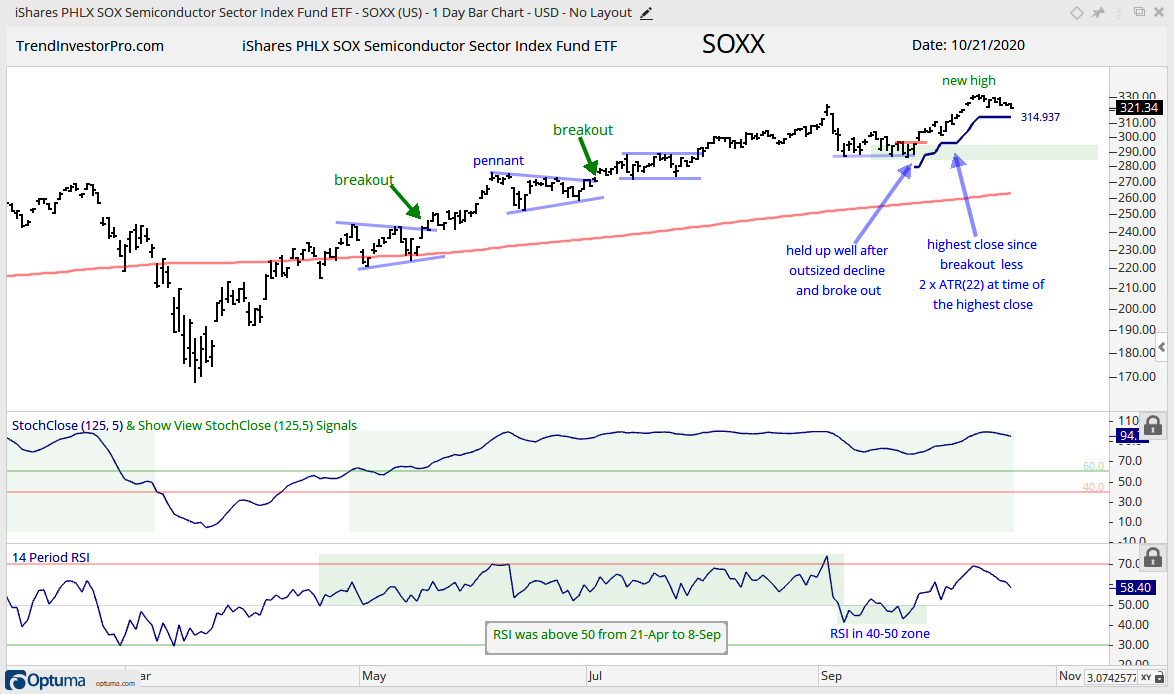
The next chart shows the Semiconductor ETF (SOXX) breaking out on 28-Sept and moving to a new high. Not all tech-related ETFs recorded new highs in October. SOXX, IPAY and FINX did and they are leading. The September lows mark long-term support for SOXX. Short-term, the ETF followed through on the breakout and remains just above the ATR Trailing Stop, which uses 2 as the ATR multiplier. A close below 314.93 would trigger this stop, but not reverse the long-term uptrend.
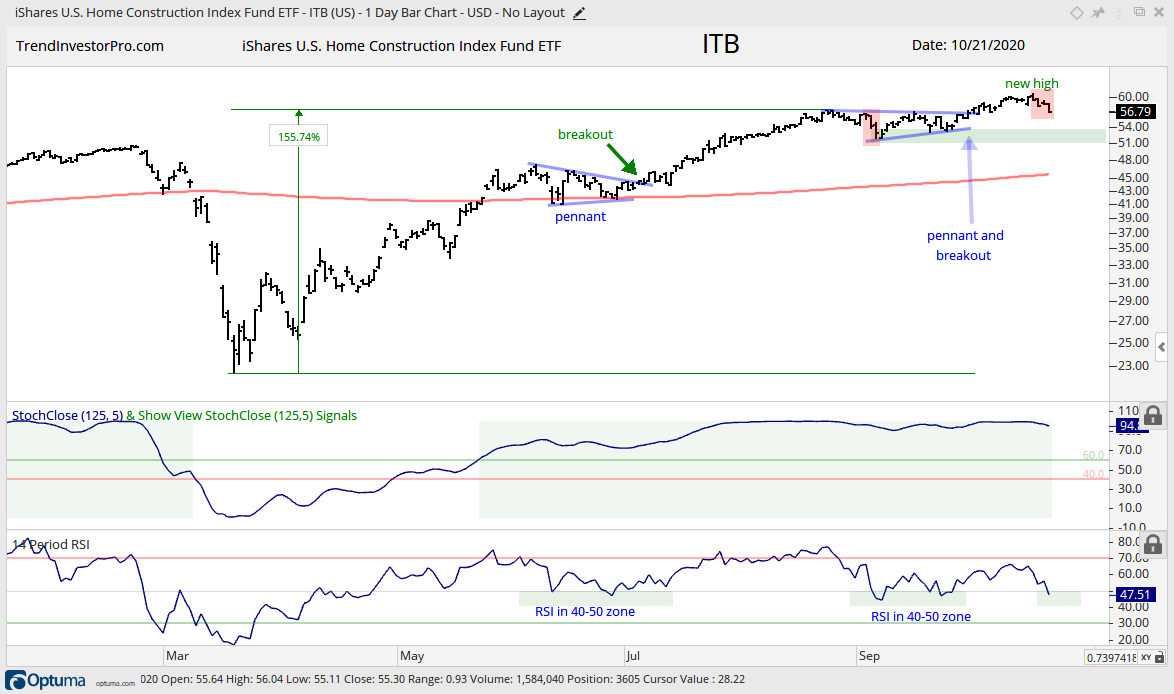
The Home Construction ETF (ITB) fell pretty hard with a 5+ percent decline the last four days. Sharp declines from new highs are not always negative. ITB also fell more than 5% in early September and this decline evolved into a pennant consolidation (red shading). At this stage, the long-term trend is up and I do not see a short-term bullish setup yet. RSI dipped below 50 on Wednesday and this means a mean-reversion setup could evolve. Note that it took three to four weeks for bullish pennants (patterns) to emerge the last two times RSI dipped below 50.
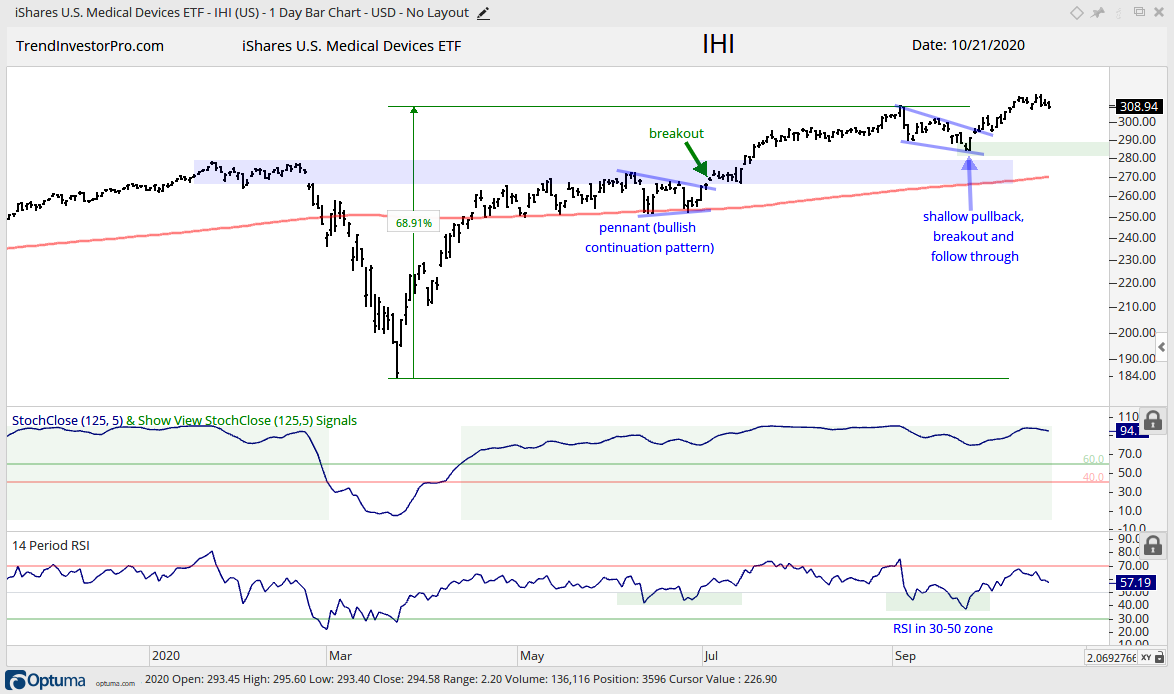
The next chart shows the Medical Devices ETF (IHI) with a falling wedge breakout and follow through to a new high. IHI stalled the last week or so, but remains in a clear uptrend and is a clear leader right now. As with ITB, there is no bullish setup right now and this ETF is in the trend-monitoring phase. Note that the pennant in June and falling wedge in September evolved over three to four weeks and RSI flirted with the 30-50 zone as these patterns formed.
Well Above 200-day, but did not Exceed September High
The next group of ETFs are not exactly weak, but they are not as strong as those in the first group because they did not record new highs in October. Some came very close to their September highs (IGV, SKYY) and one fell well short (XLC). The long-term trends are up for these ETFs because they are well above their rising 200-day SMAs. The short-term trends are also up since the 28-Sept breakouts. These short-term uptrends are in the trend-monitoring phase and short-term traders can consider a trailing stop.
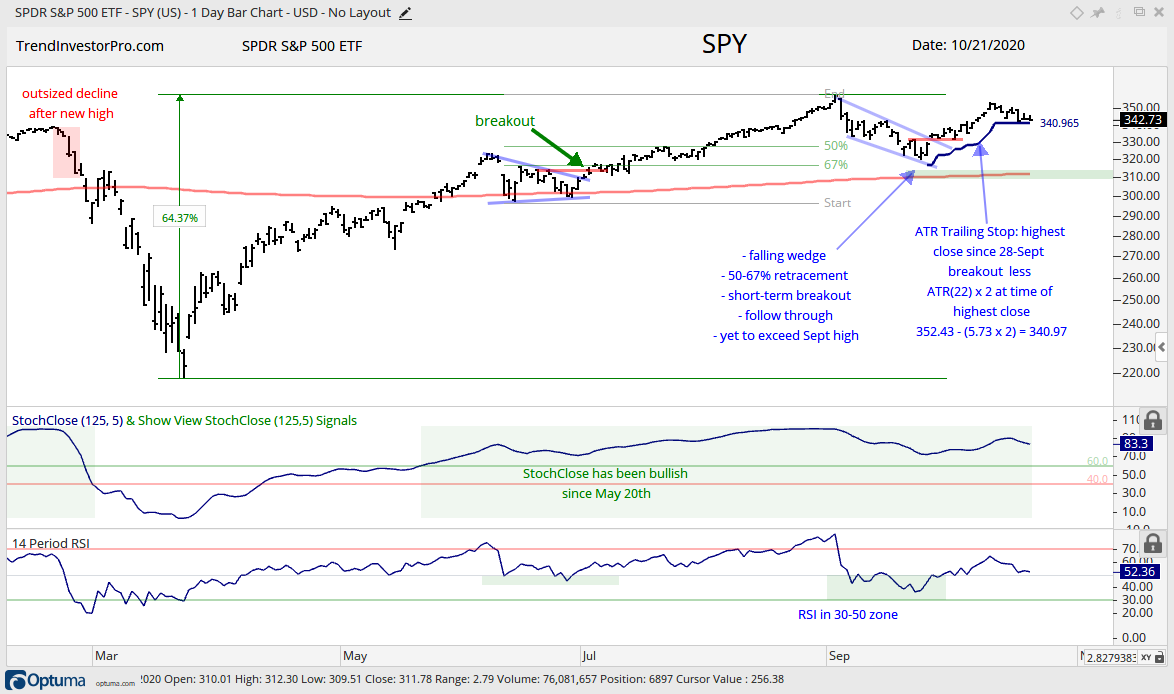
The first chart shows SPY following through on the 28-Sept breakout and hitting a high for the move on 12-Oct. Since then the ETF closed near the low six of the last seven days and the last four days straight. Closes near the low of the day reflect selling pressure into the close and this is negative. The long-term trend is up so I am not on the prowl for bearish setups. However, a failure to exceed the September high and a short-term trend reversal at this stage could lead to a test of the rising 200-day SMA.
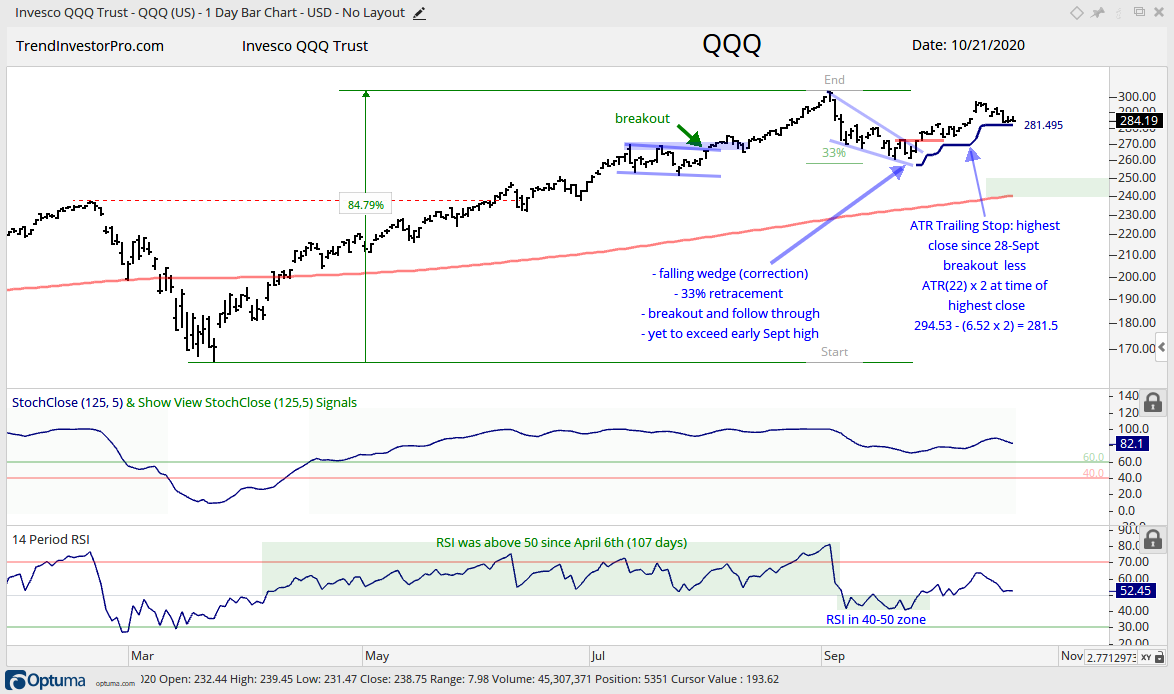
QQQ is in the same boat as SPY. The falling wedge breakout on 28-Sept is bullish and QQQ has yet to exceed the September high. QQQ closed weak six of the last seven days and the last four days straight. A short-term trend reversal could lead to a test of the rising 200-day SMA.
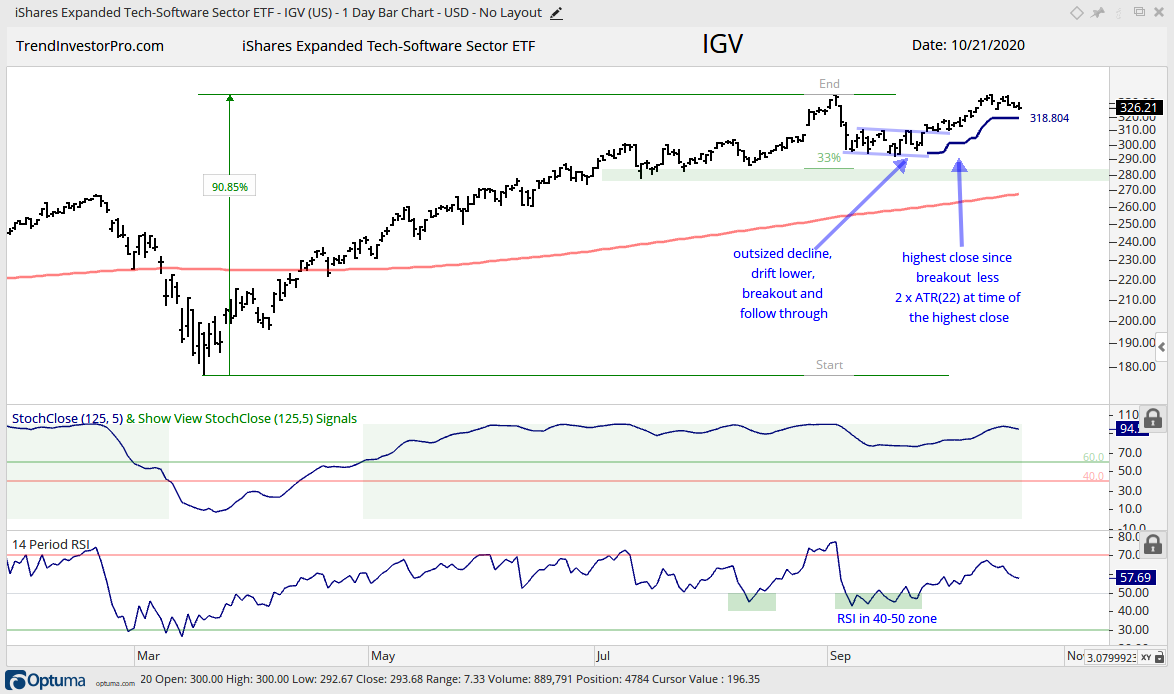
The Software ETF (IGV) is a little stronger than SPY and QQQ because it reached its early September high (but did not exceed it). IGV is also in the trend monitoring phase since the 28-Sept breakout and follow through.
Higher High from Sept to Oct, Short of New High
MDY, IWM, XLI
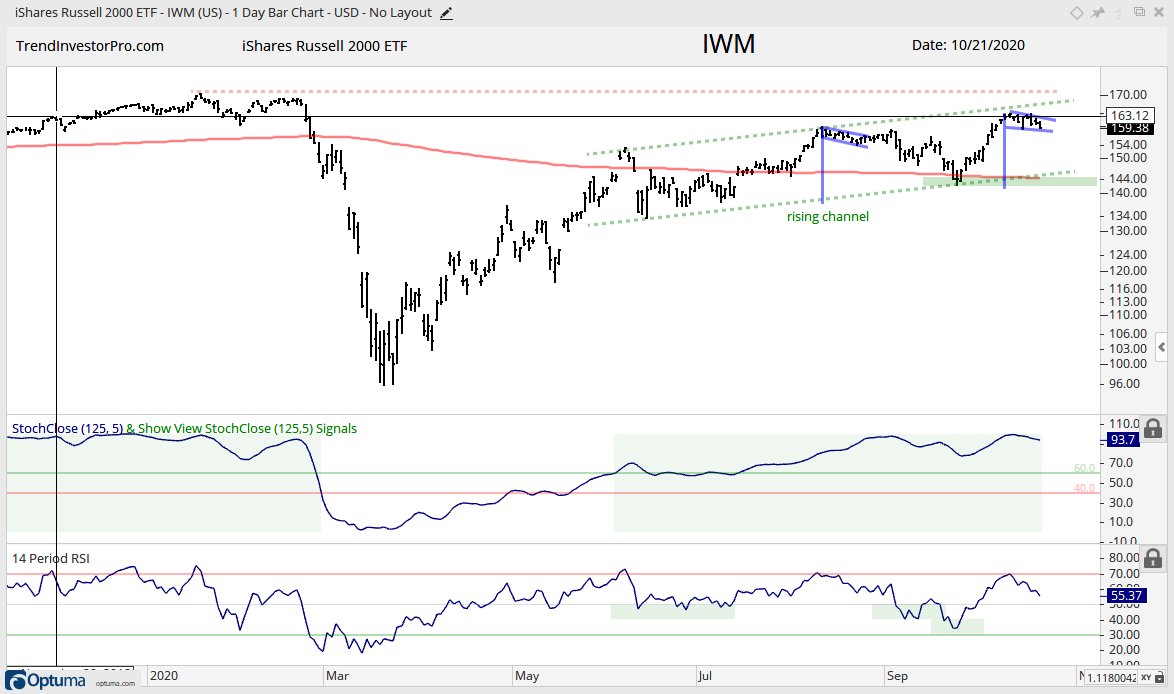
ETFs in this next group have higher highs and higher lows working since June. Most recently, they exceeded their Aug-Sept highs with market-leading surges from 25-Sept to 12-Oct. They have since consolidated the last week or so with trading ranges. The chart below shows IWM with a rising channel to define the uptrend. The 200-day, which is still falling, and September low mark key support.
There is also a possible bull flag taking shape as IWM surged over 10% and then edged lower the last seven days. A breakout at 164 would signal a continuation higher and open the door to new highs. As noted earlier, the sudden surge in IWM, which started below the 200-day, may have signaled a change in the broader market. It was as if the market saw an event on the horizon that could benefit financials, industrials and small-caps.
Broke out of Long Triangle Consolidation
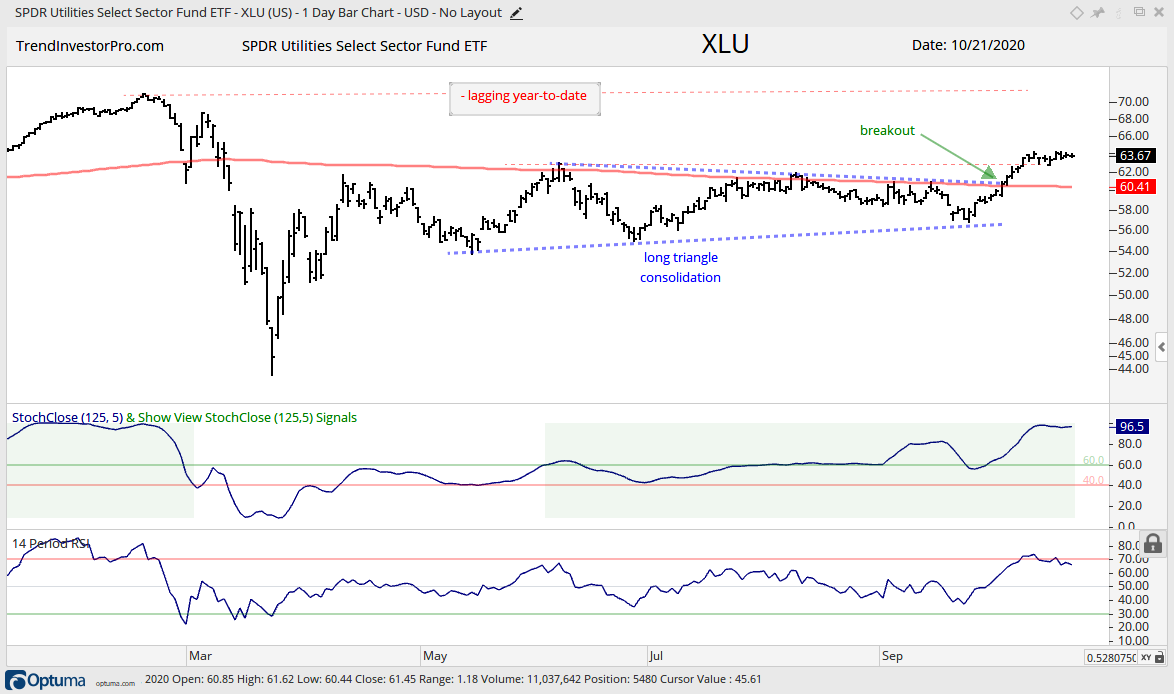
XLU
The Utilities SPDR (XLU) gets its own spot because it broke out of a long triangle and RSI exceeded 70 for the first time since February. The ability to become “overbought” shows strong upside momentum. This condition is short-term neutral because the ETF is overextended, but long-term bullish because it represents a momentum thrust that may have legs. On the price chart, the breakout is bullish and the breakout is holding as the ETF consolidates above the breakout zone. The breakout zone (60-61) and 200-day mark first support to watch should we see a throwback.
Ascending Triangle
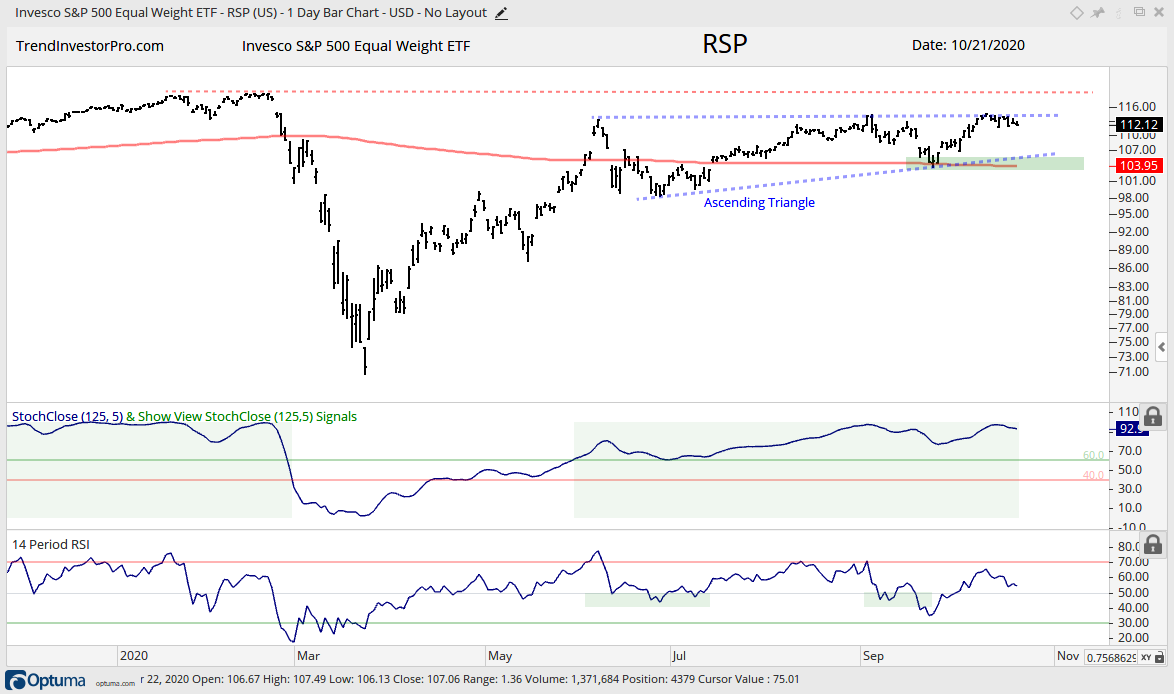
RSP, IJR
The S&P 500 EW ETF (RSP) and S&P SmallCap 600 SPDR (IJR) surged from late March to early June and then formed large Ascending Triangle patterns. These are bullish continuation patterns that form as a rest within a bigger uptrend. The upper line represents resistance (overhead supply), while the rising lower line shows demand coming in at higher levels (accumulation). The chart shows RSP hitting the upper line and stalling the last seven days, much like IWM above. A breakout would signal a victory for demand (buying pressure) and a continuation higher.
Biotech ETFs Diverge
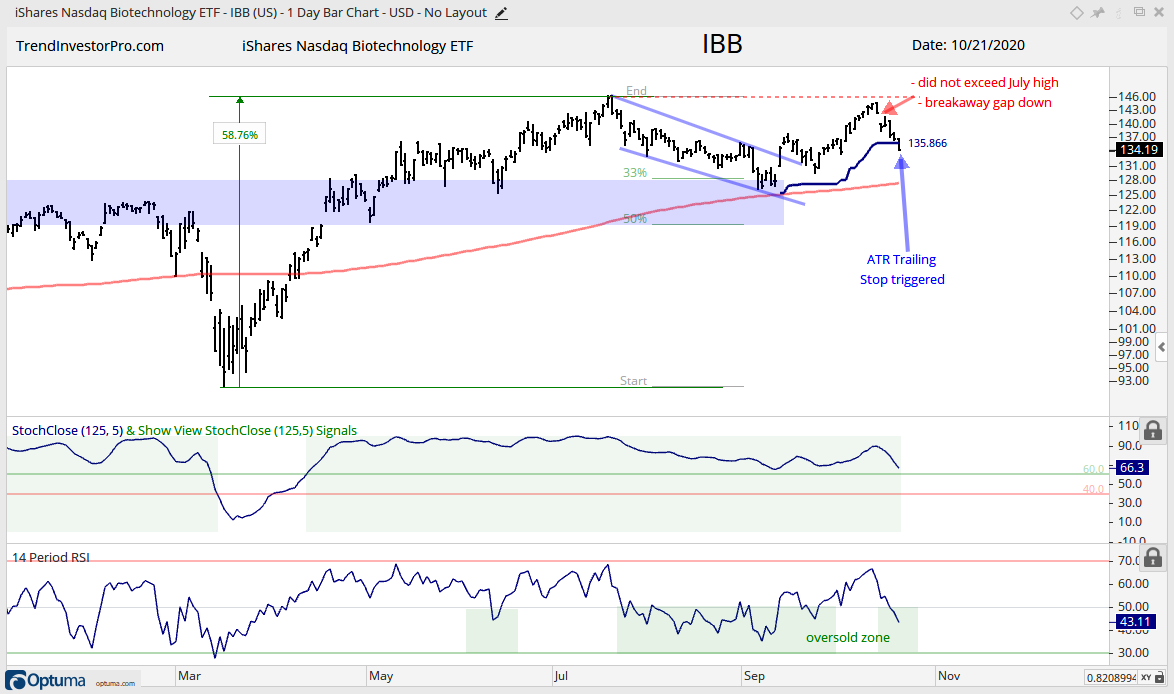
IBB, XBI
It has been a rough five days for the Biotech ETF (IBB) and Biotech SPDR (XBI) with both falling some 5%. Weakness in big biotechs is also weighing on XLV, which fell 1.7% the last five days. Again, perhaps we are seeing the market price in an event that could weigh on biotechs and big pharma. Note that MRK, JNJ and AMGN are below their 200-day SMAs.
The chart below shows IBB failing to exceed its July high, gapping down last week and continuing lower the last four days. This is a breakaway gap at resistance and a sudden outsized decline. Such price action is usually not part of a normal correction within an uptrend. IBB also closed below the ATR Trailing Stop. Even though RSI entered the oversold zone and IBB is above the rising 200-day, the ETF needs some time to stabilize before considering a bullish setup. XBI is holding up better than IBB, but these two are highly correlated and unlikely to diverge.
Stalling Above 200-day
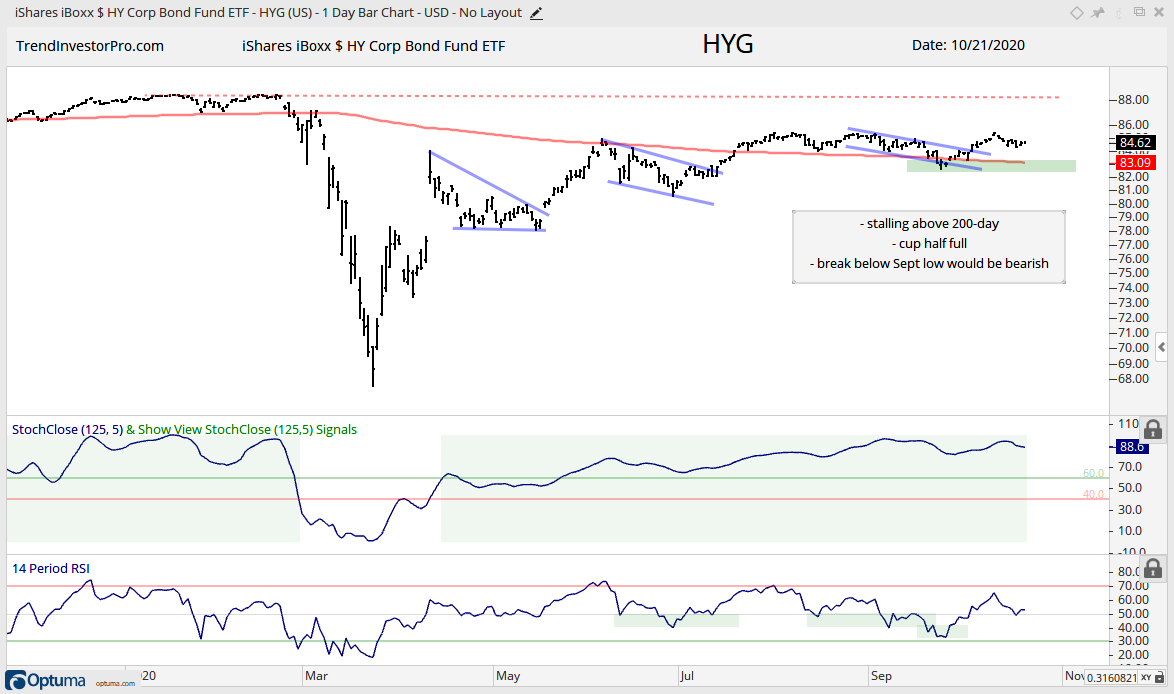
XME, REMX, HYG
The High-Yield Bond ETF (HYG) joined small-caps and banks with a move higher from 25-Sept to 12-Oct. The ETF broke out of a falling channel during this move and then edged lower the last seven days. There is not much happening here, but I do consider the cup half full and this bodes well for the broader market. Junk bonds represent the worst credits in the bond market and they are the first to fall should economic conditions deteriorate. A break below the 200-day and September low would reverse this uptrend and turn HYG bearish.
Before we get to gold and bonds, note that I covered TLT, some commodity ETFs and the Dollar in detail on Wednesday[2].
Falling Wedge Correction and Breakout
GLD
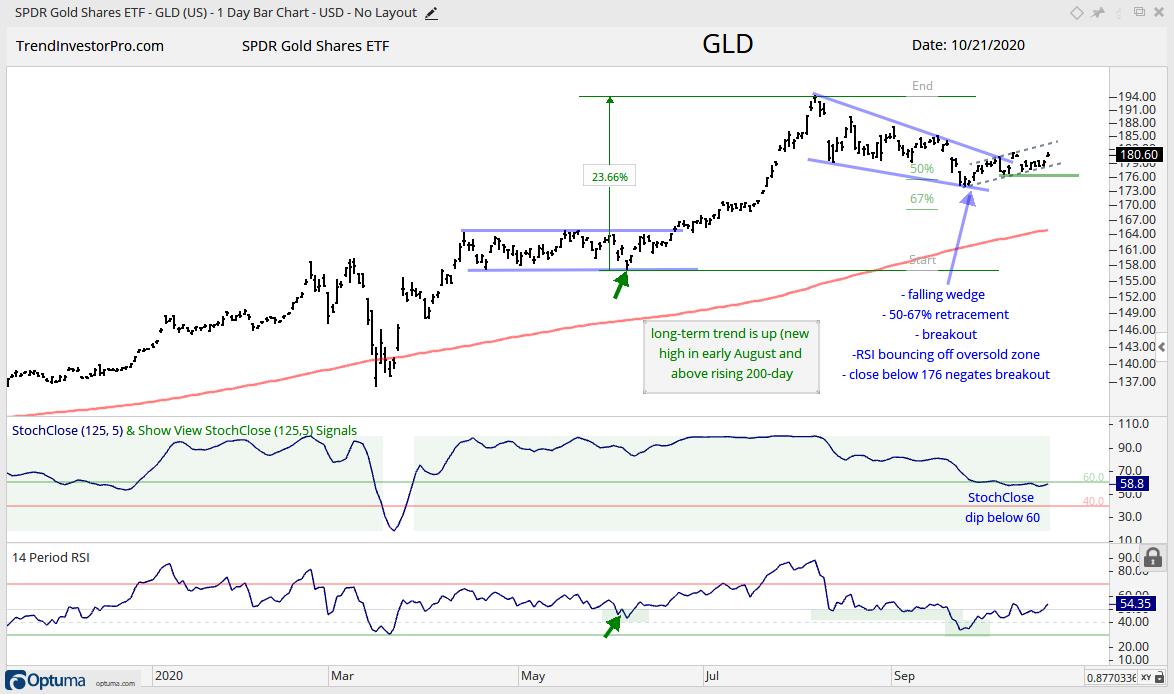
The cup remains half full for the Gold SPDR (GLD) because the falling wedge breakout is largely holding. Follow through has not been inspiring, but there is clearly an uptrend working since 25-Sept, which is also when small-caps and banks started their run. Now for the tricky part: managing the breakout and trade. We could use the ATR Trailing Stop, but this would put an initial stop just below the wedge low, which is a bit far. Instead, I would watch the four week advance and support at 176. A close below this level would negate the breakout and call for a re-assessment.
Big Falling Wedge and Breakout, but below 200-day
KBE, KRE
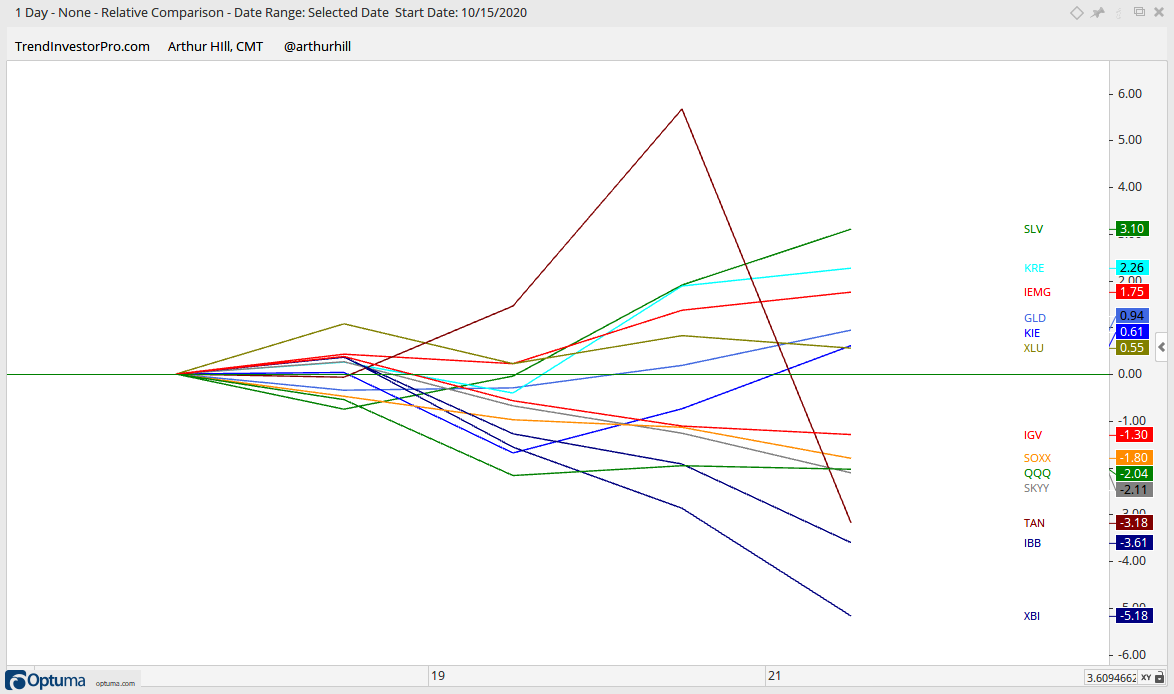
The Bank SPDR (KBE) and Regional Bank ETF (KRE) were elevated a notch because they broke out of big falling wedges and bounced the last five days, In fact, KRE and KBE are part of a handful of ETFs sporting gains the last five days. Others include: GLD, SLV, KIE, IEMG, REMX, XLU. The leading losers include: IBB, TAN, XBI, ITB, HACK, SKYY and QQQ.
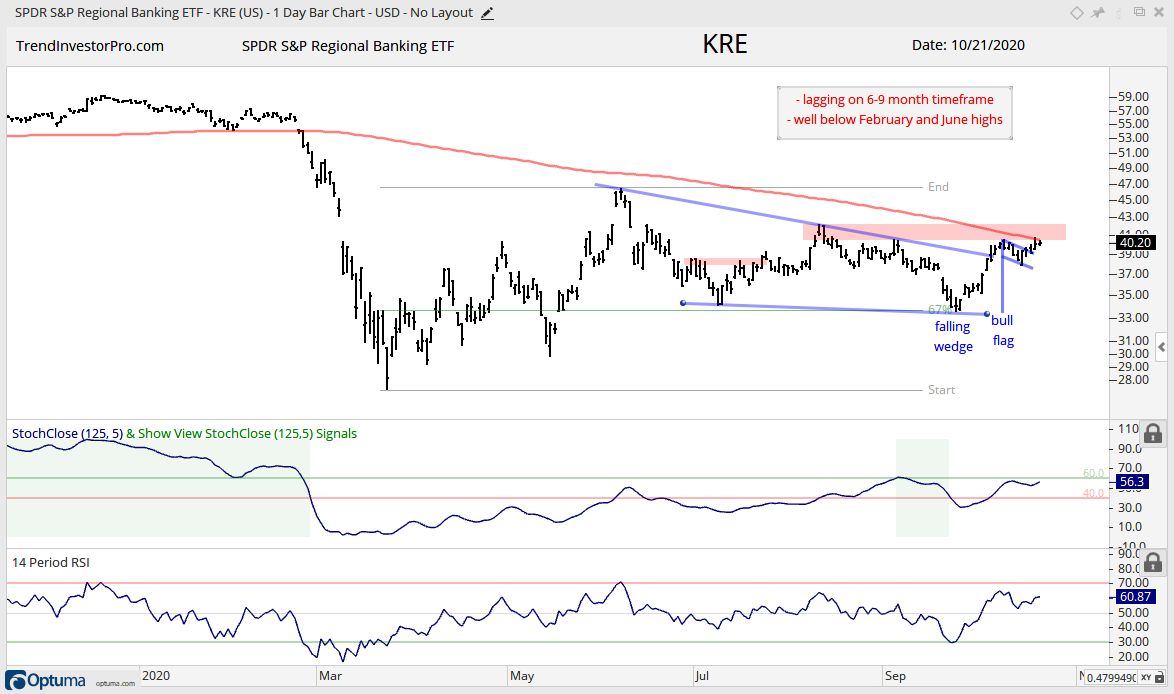
The chart below shows KRE surging over 15% and breaking the falling wedge line. I drew this falling wedge because the decline from June to September did not come close to the March low and retraced 2/3 of the prior advance. Falling wedges are associated with corrections, as are 2/3 retracements. KRE then formed a small bull flag and broke out this week. Even though KRE is still lagging overall, it is showing relative strength short-term and on the verge of breaking the resistance zone. A close below the flag low would call for a reassessment.
Stuck in Falling Wedge/Channel Correction
GDX, TLT, AGG, LQD
The 20+ Yr Treasury Bond ETF (TLT), Aggregate Bond ETF (AGG) and Corporate Bond ETF (LQD) peaked in early August and fell the last two months. TLT broke its 200-day, but AGG and LQD remain well above their rising 200-day SMAs. This is a tough call because TLT is the main driver in the bond market (not including junk bonds). In other words, TLT is the long-duration hyper-sensitive instrument that sets the tone for the other fixed income ETFs. One thing is clear: the immediate trends are down as long as the wedges fall. With further weakness the last five days, all three established resistance levels based on their mid October highs. Breaks above these highs are needed to reverse the fall.
Lagging, Downtrends and Off my Radar
The remaining ETFs are not on my radar because they are seriously lagging and/or in long-term downtrends. MJ could be ripe for an oversold bounce and perhaps the oil-related ETFs will bounce should crude hold its breakout.
Stuck in Long Triangle Consolidation, Near 200-day: XLF, XLRE, KIE, REM, XAR
Higher Low and Short-term Breakout (still dangerous): MJ