Even though the Composite Breadth Model is net bearish, the stock market seems to be more split than anything. This means we could see some sort of rotation instead of a broad bear market. In fact, we are already seeing some signs in December and there are splits within sectors. In Consumer Discretionary, the Home Construction ETF (ITB) broke out to new highs and the Retail SPDR (XRT) broke its October low. Within Technology, the Semiconductor ETF (SOXX) remained near its highs as the Software ETF (IGV) broke its October low. It is a split market at best and this means we need to be extra careful with our selections.
December Scheduling
Note that I usually take off between Christmas and New Year, but will make time on Wednesday, December 29th for a commentary/update. The normal commentary schedule will resume on Monday, January 3rd. The holiday scheduling will be as follows:
Wednesday 22-Dec: ETF Commentary
Thursday 23-Dec: Weekly Video
Friday 24-Dec: Christmas Eve (day off)
Saturday 25-Dec: Christmas Day (day off)
Wednesday 29-Dec: ETF/Market Commentary
Toying with the 200-day and AD% Divergences
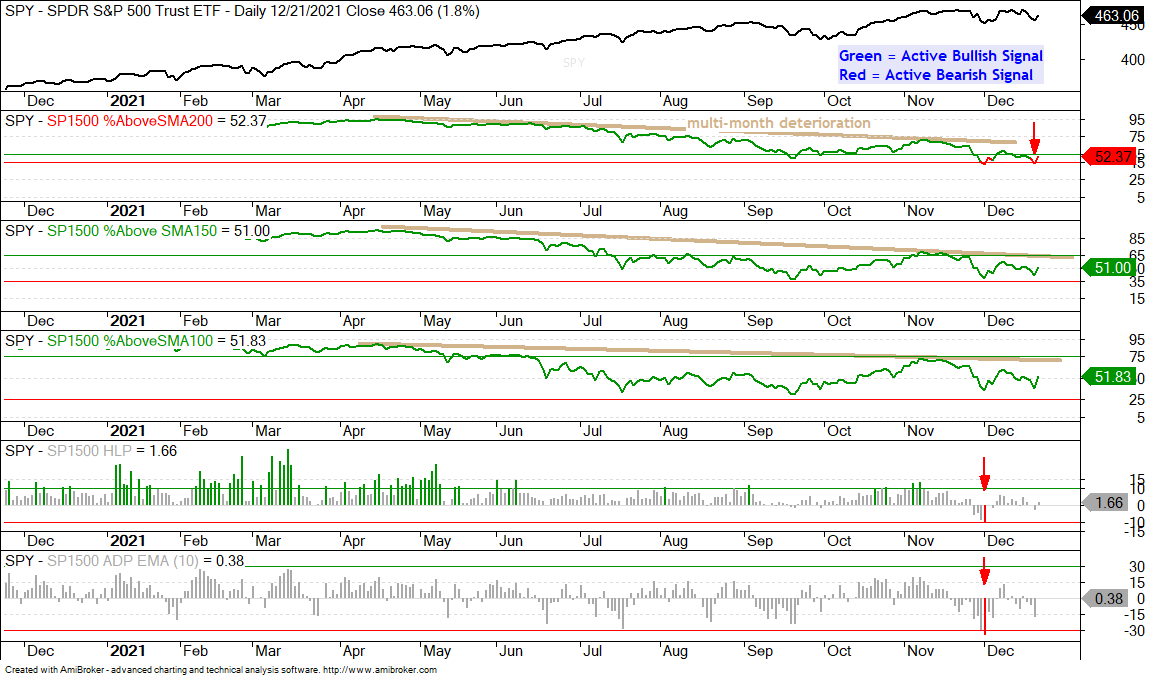
First, note that S&P 1500 %Above 200-day SMA is the indicator in the S&P 1500 Trend Model that is causing the recent whipsaws in the S&P 1500 Trend Model and the Composite Breadth Model. It dipped below 45% on December 1st (bearish), exceeded 55% on December 6th (bullish) and dipped back below 45% on December 20th (bearish). A lot of stocks are flirting with their 200-day SMAs right now and this is causing the indicator to whipsaw. Currently, some 52.4% of S&P 1500 stocks are above their 200-day SMAs and it would not take much to push this back above 55% for another whipsaw. Ugh! Perhaps I need to use a 5/200 cross to smooth out these whipsaws, as I do for the S&P 500.
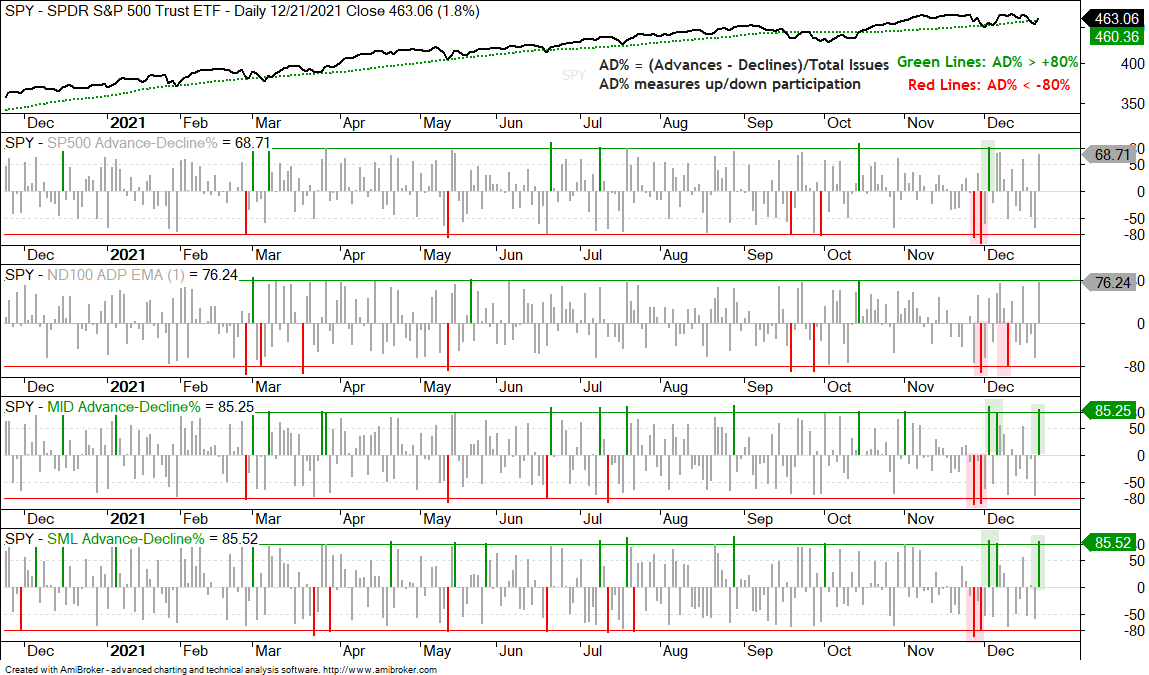
I am also seeing more upside participation in mid-caps and small-caps in December. The next chart shows Advance-Decline Percent for the S&P 500, Nasdaq 100, S&P MidCap 400 and S&P SmallCap 600. SPX AD% surged above +80% on December 1st, but has yet to exceed this level since. NDX AD% did not surge back above +80% in December and even plunged below -80% on December 9th. The lower windows show MID and SML AD% surging above +80% three times this month. Thus, small-caps and mid-caps show broader participation than large-caps and large-techs.
You can learn more about my chart strategy in this article[1] covering the different timeframes, chart settings, StochClose, RSI and StochRSI.
The defensive groups are leading the market with Utilities, REITs, Healthcare and Staples trading near new highs. We are also seeing leadership in the Networking ETF (IGN) and Dollar Bullish ETF (UUP). There are no setups on these charts, just leading uptrends. They are shown in candleglance format below:
Leadership in defensive groups is not necessarily bearish for the broader market. Bear markets require breakdowns and downtrends in some of the key offensive groups, which we are seeing in some of the Tech, high-beta and Consumer Discretionary groups (FDN, ICLN, XRT). Other offensive areas, such as banks, infrastructure and metals are not breaking down yet, but their uptrends are hardly inspiring.
The Healthcare SPDR (XLV) is part of this move into defensive areas of the stock market. The chart shows XLV reversing the downswing within the triangle with a breakout on December 7th and breaking out of a triangle a week later. The ETF hit a new high last week and is clearly leading.
The split in the market can be seen when we compare the Home Construction ETF (ITB) to the Retail SPDR (XRT). Both ETFs are part of the Consumer Discretionary sector, but they are clearly not on the same page. The first chart shows ITB breaking out of a triangle in mid November and surging to new highs with a 25% advance. The ETF became quite extended after this move and fell back with a 50% retracement. There is support in the 75 area from broken resistance as well. This pullback was quite steep and I do not see a bullish continuation setup on the chart now (bull flag, falling wedge, oversold condition).
The Retail SPDR (XRT) mimicked the Russell 2000 ETF (IWM) with a breakout and new high in November, and then a plunge into December. These ETFs went from new highs to support breaks in a matter or weeks. This is not normal price action for a bull market that lifts all boats. At best, it shows above average volatility and risk in the market right now. At worst, it shows a leading group breaking down. A surge back above the December 16th high would suggest a bear trap (failed support break).
You can learn more about exit strategies in this post[4], which includes a video and charting options for everyone.
We can also see a split within the Technology sector. The Next Gen Connectivity ETF (FIVG) and Semiconductor ETF (SOXX) consolidated near their highs, while the Software ETF (IGV) and Cloud Computing ETF (SKYY) broke their October lows in mid December. The chart below shows FIVG surging some 15% from early October to late November and then consolidating with a pennant. Trading within this pennant is a bit volatile, but the pattern is still viewed as a bullish continuation pattern. However, given broad market conditions, I am refraining from breakout signals because the reward-to-risk ratio is not that great. In contrast, the reward-to-risk ratio is better with a falling wedge and pullback that creates an oversold condition (such as Sep-Oct).
IGV and the March-May Consolidation (plus SKYY)
History does not always repeat, but sometimes rhymes. The sharp decline from mid November to early December is looking similar to the sharp decline in February-March. The latter foreshadowed an 11 week consolidation and prices did not break out until early June. The chart below shows IGV with the yellow shading marking the two periods. Both declines were around 15% and both broke a prior low or support level. Notice how IGV surged on March 31st (green arrow) and continued higher into mid April. IGV surged on December 21st and a Santa Clause rally could carry this bounce. The main point is that the 15% decline did its damage and more time may be needed to set up the next move. Corrections can be time or price based and a three month consolidation after a 35% advance would be pretty normal.
TGhe Global Carbon ETF (KRBN) and DB Agriculture ETF (DBA) are also leading with strong uptrends and new highs recently. Both fell back in December, but did not become oversold. Note that KRBN did not become oversold once this year, which is testament to the strength of the uptrend. The first chart shows KRBN with a bull flag forming and a breakout would be bullish. The second shows DBA with a triangle/wedge of sorts and the mid December high marking resistance.
The Water Resources ETF (PHO) is also leading with a fairly steady uptrend over the past year. There is a clear ebb-flow in this uptrend with the triangle in early 2021, the smaller triangle in May-June, falling flag/channel into early October and falling wedge (now). These are all bullish continuation patterns that represent a rest within the bigger uptrend.
The Metals & Mining SPDR (XME) does not have a consistent uptrend on the chart, but it does sport a large Ascending Triangle, which is a bullish continuation pattern. The swing within the pattern was down and XME reversed this downswing with a breakout on Tuesday. This is the early signal and argues for a challenge to the bigger resistance zone at 48. A move below Monday’s low would call for a re-evaluation.
The Uranium ETF (URA), Lithium Battery Tech ETF (LIT) and Strategic Metals ETF (REMX) represent the exotic metals group. LIT and REMX were hit hard with big down gaps on Monday. Both became oversold as the Momentum Composite dipped to -4. These ETFs were already in the high-beta group and represented above average risk. LIT and REMX are near their October lows and oversold. I do not see a nice falling flag or wedge and the big gap down makes me hesitant because it means an uptick in volatility. After an oversold condition, I look for a StochRSI pop above .80 to signal a short-term momentum thrust that could jump start an oversold bounce.
The Uranium ETF (URA) looks a little stronger short-term because it has been firming near the early October low the last few weeks (green zone). This zone also represents a 50-67% retracement of the Aug-Nov advance. URA became oversold on November 30th and there was a StochRSI pop on December 7th, but we have yet to see a short-term breakout. Watch for a move above 25.
The Momentum Composite aggregates signals in five momentum indicators. RSI(10) is oversold below 30 and overbought above 70. 20-day StochClose is oversold below 5 and overbought above 95. CCI Close (20) is oversold below -200 and overbought above +200. %B (20,2) is oversold below 0 and overbought above 1. Normalized ROC (10) is oversold below -3 and overbought above +3. Normalized ROC is the 10-day absolute price change divided by ATR(10). -3 means three of the five indicators are oversold and +3 means three of the five are overbought.
The Momentum Composite and StochClose are part of the TIP Indicator Edge Plugin for StockCharts ACP. Click here for more details.[5]
Oil is getting caught up in recent volatility as West Texas Intermediate ($WTIC) fell over 5% on Friday-Monday and then bounced with a 3.5% gain on Tuesday. The chart shows WTI with an uptrend over the past year and bounces off the lower line (higher lows). The lower window shows DBE with a short-term breakout, deep dip on Monday and recovery on Tuesday. A break above the mid December highs would further the short-term upswings for WTI and DBE.
The Energy SPDR (XLE), Oil & Gas Exploration & Production ETF (XOP) and Natural Gas ETF (FCG) extended their pullbacks with lower lows on Monday, but rebounded sharply on Tuesday. Overall, all three have falling flag type pullbacks and flag breakouts would signal an end to the pullbacks and a resumption of the bigger uptrends.
The Oil & Gas Equipment & Services ETF (XES) dipped back to its support zone on Monday and surged on Tuesday with a 5.8% gain. This move reinforces the support zone and a move below 45 would break support. This is about 10% below current prices and shows above average volatility in this ETF.
Now we get to some of the more inconsistent uptrends. The Infrastructure ETF (IFRA) and Materials SPDR (XLB) broke out of large consolidation patterns and hit new highs in November. They then fell back and formed rather noisy triangles with erratic price action the last few weeks. Both are trading near their May-June highs and have little to show for the last six months of trading. The uptrend is not very consistent and it is hard to find a clear ebb-flow on the chart (contrast these charts with PHO above). Even so, the triangle is viewed as a consolidation after a big advance and this makes it a bullish continuation pattern (until proven otherwise). A break below Monday’s low would be negative.
The Regional Bank ETF (KRE) and Bank SPDR (KBE) broke out in early October and hit new highs in November, but were hit hard in December and are back below their May-June highs. This is not a consistent uptrend with a clear ebb-flow. As with IFRA and XLB, the pullback after the new high is still considered a bullish continuation pattern (correction after big move). KRE and KBE formed falling flags and flag breakouts would reverse the short-term downswings.
The DB Base Metals ETF (DBB) is taking the lead with a break above its November high this week. The overall trend was up after the new high and DBB fell back quite hard with the decline to the 20.5 area in early November. DBB firmed for several weeks and held support. The breakout is bullish and chartists can re-evaluate on a close below 20.90.
The Copper ETF (CPER) is also going for a breakout after a deep intraday dip last Wednesday. Overall, CPER broke out of a big falling wedge in October and fell back hard into November. A smaller falling wedge took shape and CPER ultimately held above the August-September lows (green shading). The ETF broke above the wedge line on Tuesday and a follow through breakout at 27 would further this bullish signal.
The Biotech ETF (IBB) is going for a breakout and performing pretty good in December. The ETF led the market lower from September to early December as it fell to support from the spring lows (green zone). IBB then forged a three bar reversal as it became oversold in early December (red arrows) and followed thru with a short-term breakout the last three days. Note that IBB is one of the top performers the last two weeks.