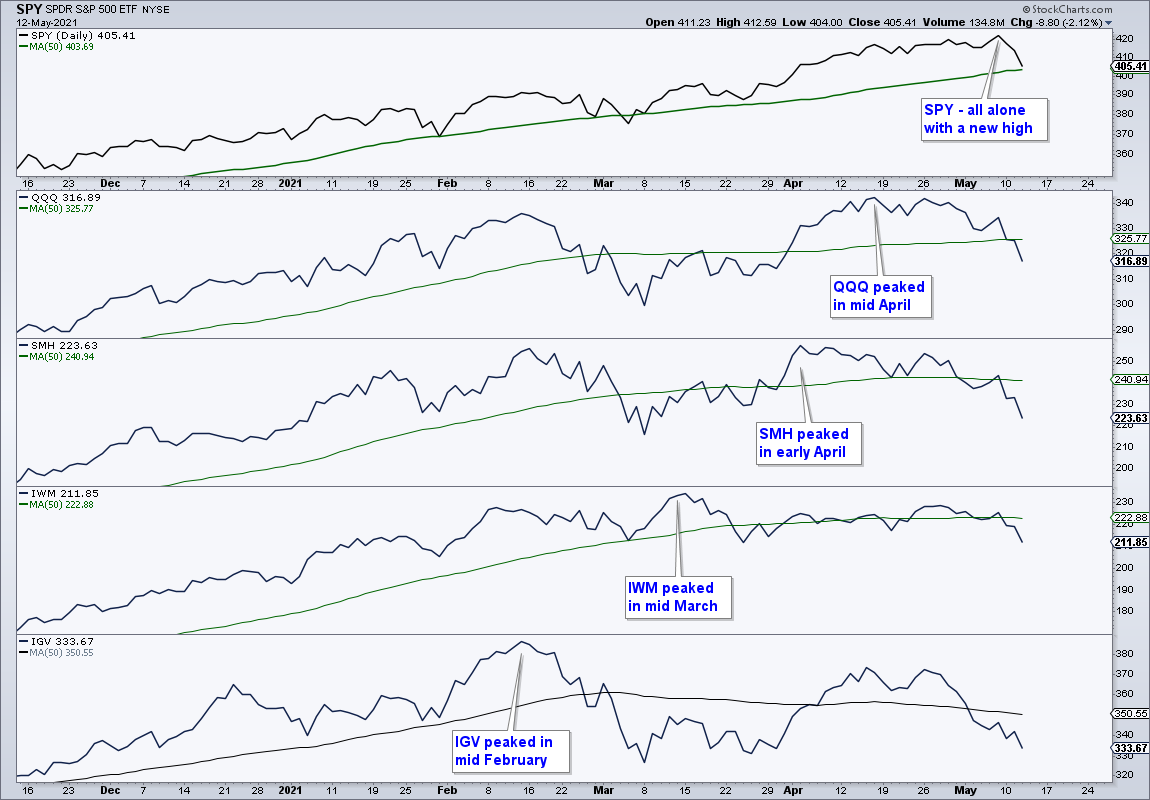
There is a lot going on in the market here in May, but the action started in February with the peak parade. The market was hit hard from mid February to early March and this February high marked an important peak for several high-flying and tech-related ETFs (TAN, IGV). Next, the Russell 2000 ETF (IWM) peaked in March and small-caps started to lag. The Semiconductor HOLDRS joined with a peak in early April and QQQ peaked in mid April. SPY hit new highs in March, April and May, but fewer groups joined the market benchmark with new highs as the months wore on. Participation was narrowing.
Other groups picked up the slack with ETFs related to industrials, finance, materials, healthcare, housing, copper, metals and energy hitting new highs here in May. ETFs related to these groups are still in uptrends, but they were all hit this week with many forming breakaway gaps on Tuesday. These are short-term bearish patterns and the outsized declines over the last three days suggest that the broader market is moving into correction mode. Oversold conditions may give way to a short-term bounce in the coming days, but I expect a corrective period over the next few weeks. Sorry, I cannot put an exact time on it because all corrections are a little different.
The name of the game is bullish setups within bigger uptrends. There are still lots of long-term uptrends out there and there are lots of short-term mean-reversion setups right now. These mean-reversion setups, however, are very short-term (a few days). One would be buying now and selling on the first bounce. I prefer bullish setups that extend a few weeks and there are very few right now (JETS is one[1]). This means it is time to wait and monitor price action.
Today’s report will look at the broader market first and then cover ETFs that hit new highs in May and are still leading longer-term (KRE and IBB are the exceptions).
You can learn more about my chart strategy in this article[2] covering the different timeframes, chart settings, StochClose, RSI and StochRSI.
Mind the Gap in SPX
The S&P 500 gapped down .90% on Tuesday and fell 4% in three days. This was the biggest down gap and sharpest 3-day decline since October 28th. Context matters when looking at such moves and this one argues for a corrective period. An outsized gap and decline after an extended advance can signal the start of a corrective period. Conversely, an outsized gap and sharp decline after an extended decline can signal capitulation and lead to a reversal.
Stocks were moving higher from mid June to August and were suddenly hit with strong selling pressure in early September. This led to a two month correction. Stocks were moving higher from late March to mid June and were suddenly hit with a big gap and outsized decline on June 11th. This led to a three week consolidation (triangle). Sudden downside hits after an advance derail the bulls and it takes time to stabilize before resuming.
There was also an outsized gap and decline in late October and the S&P 500 reversed a few days later with a surge in early November. The overall context was different in late October as the index was already in correction mode and near support from the September low. Also note that November is the second strongest month from a seasonal perspective. May-June are seasonally weak months (see report here[3])
Price Action First, Corrections Targets Second
So now we can look forward to correction targets from all the pundits, myself included. Targets, by definition, are an attempt to predict the future and you know how that goes. An 8% pullback and 33% retracement would extend to the 389 area. Take all price targets with a grain of salt and instead focus on developing price action for signs that the correction is coming to an end, which could take 1-2 months. Short-term, SPY is oversold because price is near the 50-day SMA and RSI is at 41, its lowest level since early March. Thus, SPY is prime for a 1-3 day bounce. There are mean-reversion strategies that catch these types of falling knives and then sell 1-3 days later. There is no trailing stop here. The exit is simply a profit target that is 1-2 ATR(22) values above entry. Kind of like scalping.
The indicator window shows RSI and the blue shadings mark “W” reversals in the indicator. The W means there was an initial move lower, a momentum bounce, a second move lower and then a reversal. First, notice that the W in early September did not lead to a bounce and SPY continued lower after a week of choppy trading. The other W’s show this short double dip. Thus, we could see an initial bounce in the coming days and then another dip to form the W.
You can learn more the StochClose indicator and strategies in this post.[4]
Expect more Beta from IJR and QQQ
When it comes to correction targets, the S&P 500 is pretty much the only game in town because it is the most widely followed benchmark. Small-caps (IJR, IWM) and QQQ are more erratic and prone to over/under shoots. In general, I would expect IWM and QQQ to fall more than SPY during a broad market correction, perhaps 1.5x.
The next chart shows IJR failing to hold the triangle breakout and triggering the ATR Trailing Stop. Also notice that IJR is well below its 50-day SMA and underperforming (SPY is just above its 50-day SMA). The new pattern at work is a bearish wedge and the break signals a continuation of the mid March decline. The break zone around 109-110 turns first resistance on a bounce. On the downside, a 12% decline (1.5x an 8% decline in SPY) would target a move to the 99 area, which also marks a 33% retracement of the September-March advance.
You can learn more about ATR Trailing stops in this post[5], which includes a video and charting option for everyone.
The QQQ chart sports a breakaway gap last week and a continuation lower this week. The ETF is down around 7% in 12 days and RSI is at its lowest level (34) since early March. The stage is set for a 1-3 day bounce or perhaps a choppy range, such as late February (pink shading). Overall, this is the second gap-laden decline since late February when QQQ fell 11%. Medium-term, one to two months, I think QQQ needs some time to find its footing and reset (corrective period).
Correlations Rise when the Major Index ETFs Weaken
Ten of the eleven sector SPDRs were down on Wednesday. Of the 120 ETFs in the core list, only three were up on Wednesday: the Energy SPDR (XLE), the DB Energy ETF (DBE) and the Dollar Bullish ETF (UUP). All but one equity-related ETF was up on Wednesday (XLE). Note, however, that XLE is down 2% over the last three days. There were few places to hide this week and this means there will be few places to hide should a correction unfold.
XLE broke out of a falling wedge on April 27th and continued higher with a new high on Monday. The breakout is holding and still bullish with the red line marking the ATR Trailing Stop for reference. XES, XOP and FCG have similar wedge breakouts working.
Corrections alleviate overbought conditions and pave the way for the next bullish setups. Note that many ETFs are up sharply since early March and they have earned the right to correct. The Industrials SPDR (XLI), Finance SPDR (XLF) and Healthcare SPDR (XLV) were leaders with new highs on Monday. They are still in long-term uptrends, but all three gapped down on Tuesday and continued lower on Wednesday. These are short-term reversals and not enough to affect the long-term uptrends.
The chart below shows XLF with a 66% advance from September to May. A normal 1/3 retracement would extend to 33 and lead to a 13% decline. As with all corrections, spend more time analyzing price action as it develops and put the target on the back burner. At this stage, I will wait for a bullish setup to materialize.
ITB Gets Rattled the Most
The Home Construction ETF (ITB) was taken out to the woodshed for a 9.6% beating the last two days. The ETF closed below the ATR Trailing Stop on Tuesday and then fell another 6% on Wednesday. The red shading shows the last two-day 9% decline in early November, which amounted to a test of the late October low. ITB is already oversold with RSI in the low 40s so a bounce in the coming days is likely. The long-term trend is up, but the uptrend has been rattled and some time is needed to let the dust settle.
KRE Tests Breakout Zone
The Regional Bank ETF (KRE) held up better than most the last two days and did not trigger the ATR Trailing Stop. Even so, I have my doubts that it can withstand a broad market correction. The candlestick chart shows the breakout zone turning into support and KRE is testing this zone right now.
ITA Fails to Hold Breakout
The Aerospace & Defense ETF (ITA) broke out of an Ascending Triangle on Friday, but reversed on Monday and gapped down on Tuesday. ITA followed through on the gap with a big decline on Wednesday. The failed breakout, gap and sharp decline put ITA on the back burner. This means the setup/signal failed and it is time to wait for the next setup to materialize.
Water Resources not Immune
The Water Resources ETF (PHO) was not immune to broad market selling pressure as it fell 3.3% on Wednesday. The story is the same: long-term uptrend, new high in May, short-term shock. This is still deemed a pullback within a bigger uptrend. The breakout zone around 49-50 is the first area to watch for support. This area also marks a 50-67% retracement of the prior 15% advance.
Copper Complex ETFs Hold Up
ETFs in the copper-complex also fell over the last two days, but held up better than most. The chart below shows Spot Copper ($COPPER), the Copper Miners ETF (COPX), the DB Base Metals ETF (DBB) and the Copper ETF (CPER) with their 50 and 200 day SMAs. All three are well above their rising 50-day SMAs after big moves the last five to six weeks. The ATR Trailing Stops are shown for reference. These ETFs are still in the trend-monitoring phase because the setups and signals triggered long ago. Now is the time to decide if you want to use the ATR Trailing Stop (traders) or use long-term trend signals (investors).
RSI Exceeds 80 for DBA
The DB Agriculture ETF (DBA) also held up relatively well the last few days, but remains very extended after a vertical advance the last six weeks. The red line shows the ATR Trailing Stop for reference. The indicator window shows RSI moving above 80 twice. A move above 70 is overbought that signals strength with the prospects for more gains. A move above 80 is the overbought that flashes a warning because the odds of a correction or pullback are above average.
IBB Battles 200-day
Note that I covered IBB and its top components in a video (click here[6])