The Composite Breadth Model flipped back to bullish with the bounce in stocks over the last five days (see Market Regime page[1]). Even so, the market remains quite divided right now. Large-caps are still leading, small-caps are still lagging and mid-caps remain caught in the middle. The divide is visible within some sectors as well. Retail is weak and housing is strong (Consumer Discretionary). Semis are strong and Fintech is weak (Technology). Railroads are strong and airlines are weak (Industrials).
Overall, the weight of the evidence is clearly bullish for large-caps, but mixed for small-caps and the broader market (large, small and mid). This means there are sizable pockets of strength, and sizable pockets of weakness. It is unclear which pocket will ultimately prevail and take the broader market with it. Or, if we will just see some sort of rolling correction where the broader market churns as some groups remain strong and some remain weak. This would make it an ETF/Stock pickers market.
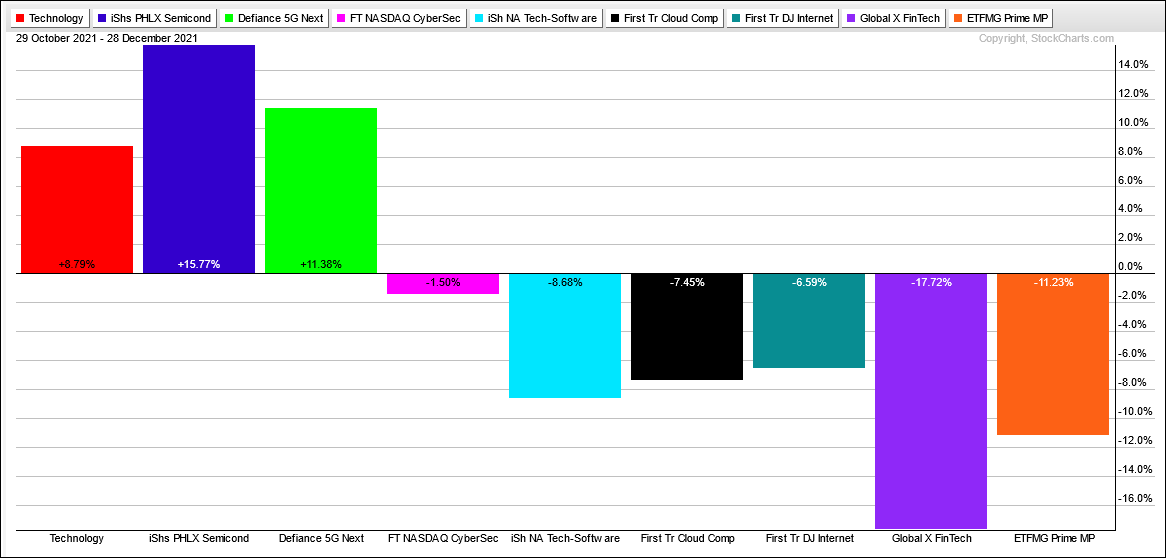
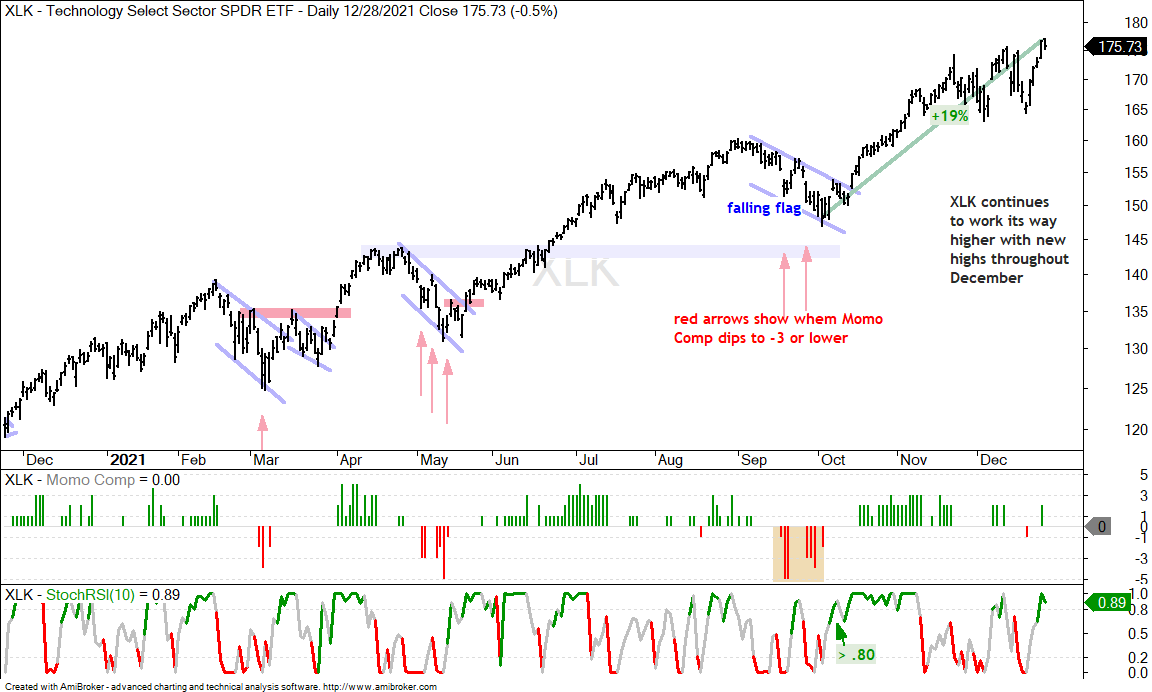
The Technology sector is the largest sector in the S&P 500 and a clear split developed the last two months. The Semiconductor ETF (SOXX) and the Next Gen Connectivity ETF (FIVG) are holding strong with double digit gains, and the Technology SPDR (XLK) is up 8.8% since November.
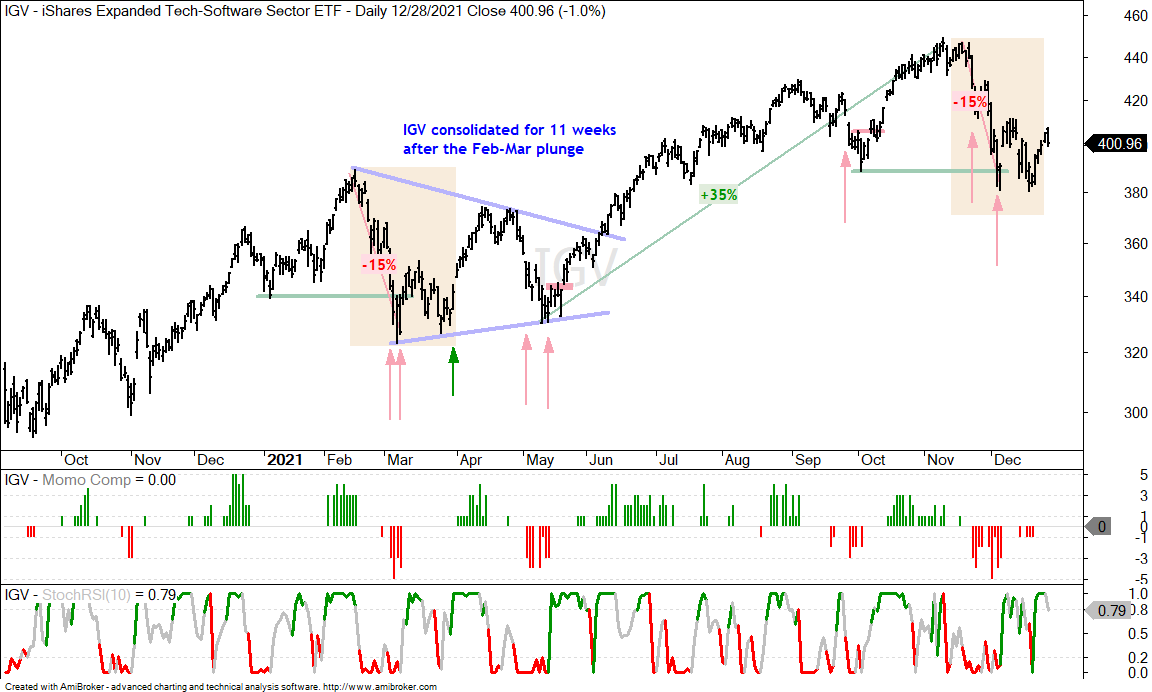
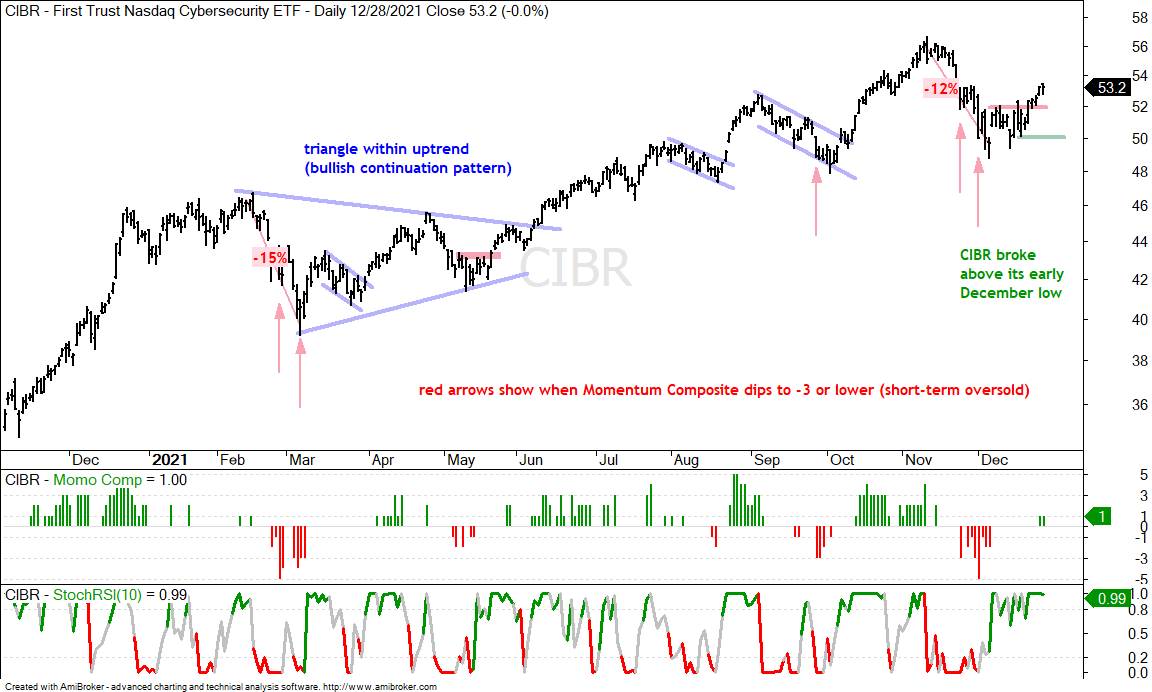
The other tech-related ETFs, however, are seriously lagging. The Cybersecurity ETF (CIBR) is holding up the best with a 1.5% decline since October 29th. The Software ETF (IGV), Cloud Computing ETF (SKYY) and Internet ETF (FDN) are down between 6.5 and 8.7 percent. The FinTech ETF (FINX) and Mobile Payments ETF (IPAY) are the weakest with double digit declines.
Yearend Scheduling
Note that I usually take off between Christmas and New Year because we all need a break from the markets at some point. The markets do not always oblige and this December was more volatile than average so there is an update today. The normal schedule will resume in January with the next ETF/Market Commentary on Tuesday, January 3rd.
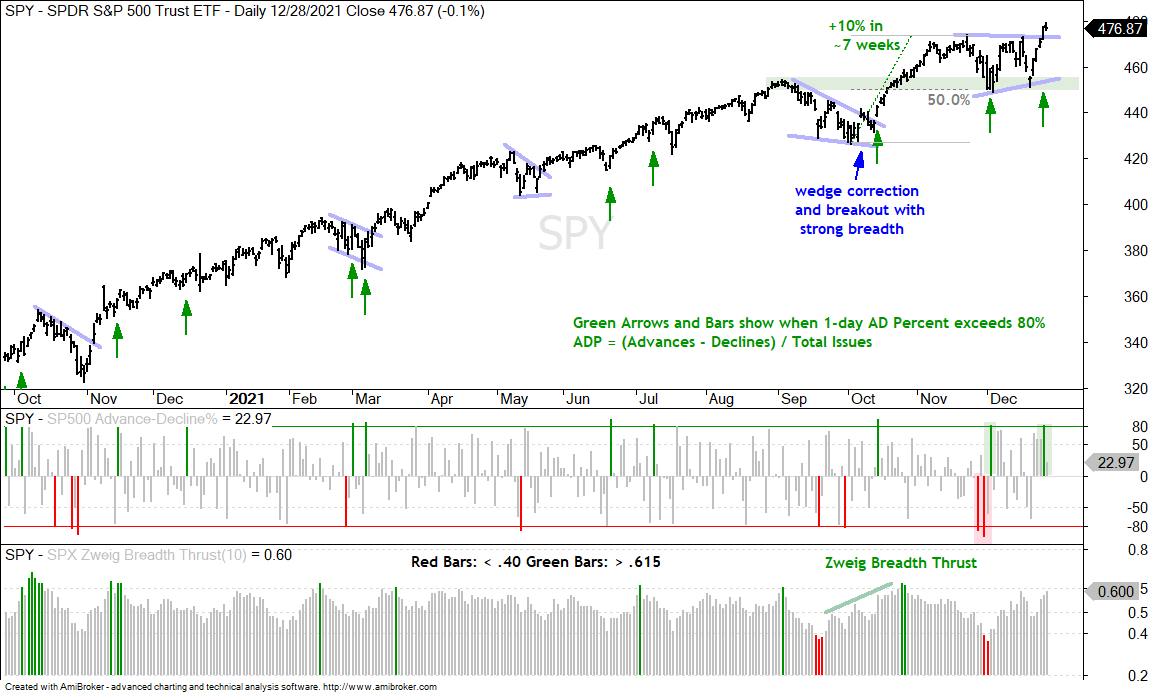
The first chart shows SPY with a 10% surge to new highs in November and then a rather choppy triangle consolidation into December (blue lines). This is a consolidation within an uptrend and a bullish continuation pattern. The breakout signals an end to the corrective period and a resumption of the trend. Also notice that Advance-Decline Percent exceeded +80% on Tuesday’s breakout. The December lows now mark a clear support zone to watch going forward.
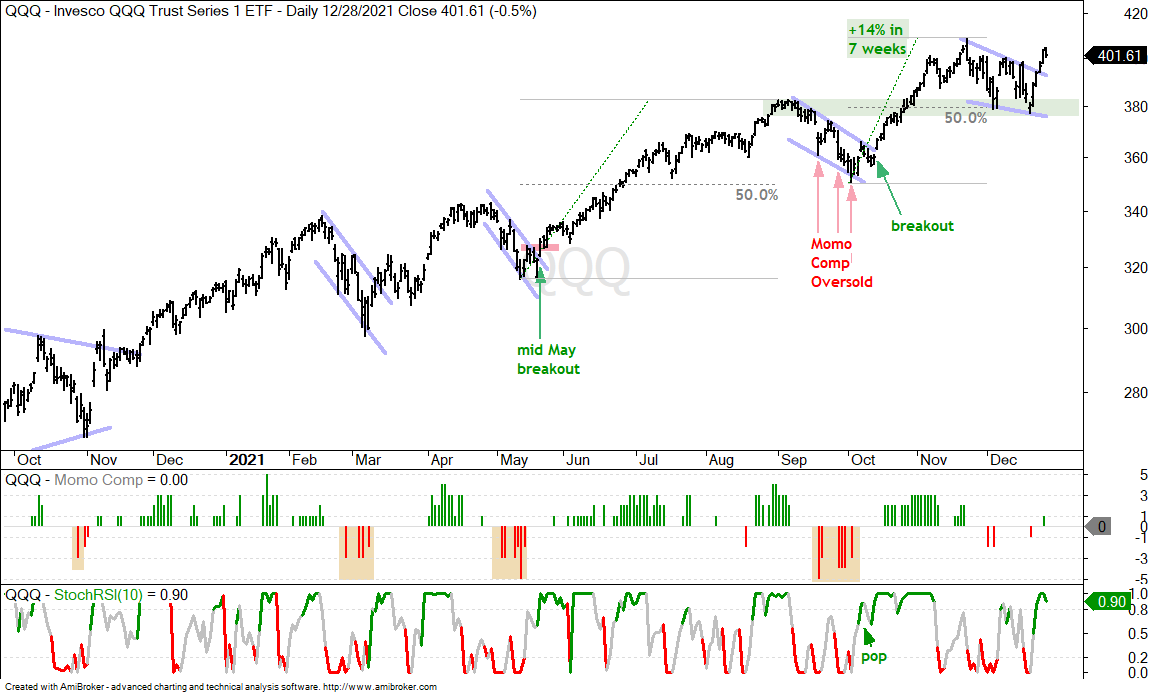
QQQ formed a falling wedge in December and broke out with a surge the last five days. As with SPY, QQQ fell back to its prior breakout zone, which turns support. The ETF also retraced half of the prior advance (14%). The wedge breakout signals an end to this corrective period and a resumption of the bigger uptrend. Again, the December lows mark a clear support zone to watch going forward.
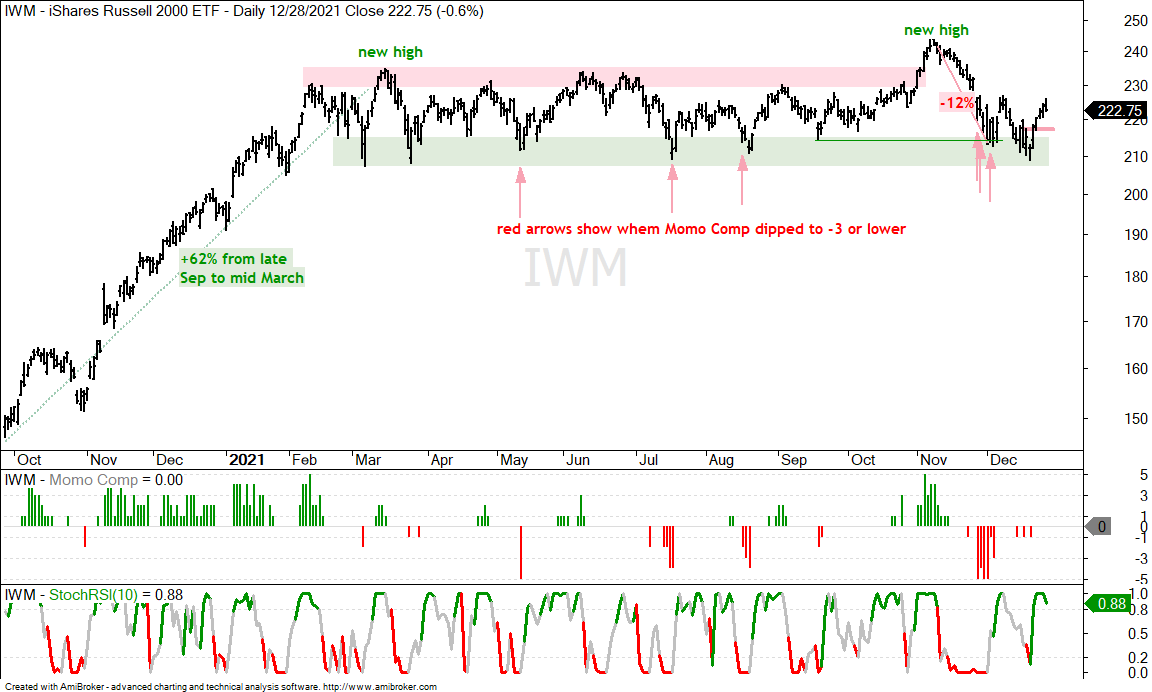
The market is not firing on all cylinders. New highs in SPY, QQQ and the S&P 500 EW ETF (RSP) indicate that there are still some sizable pockets of strength. The S&P SmallCap 600 SPDR (IJR), Russell 2000 ETF (IWM) and Russell Microcap ETF (IWC), however, are lagging because they remain well short of their mid November highs and they did not even break above their early December highs on the recent bounce. This means there are still some sizable pockets of weakness.
The next chart shows IWM becoming oversold and hitting support in late November (red arrows). The ETF then tested this support zone after a dip to 210 in mid December and turned up the last five days. The red line marks the 15-Dec close and IWM closed above this level on 21-Dec for a short-term breakout. Even so, I am not impressed with small-caps and will keep them on the avoid list for now.
You can learn more about my chart strategy in this article[3] covering the different timeframes, chart settings, StochClose, RSI and StochRSI.
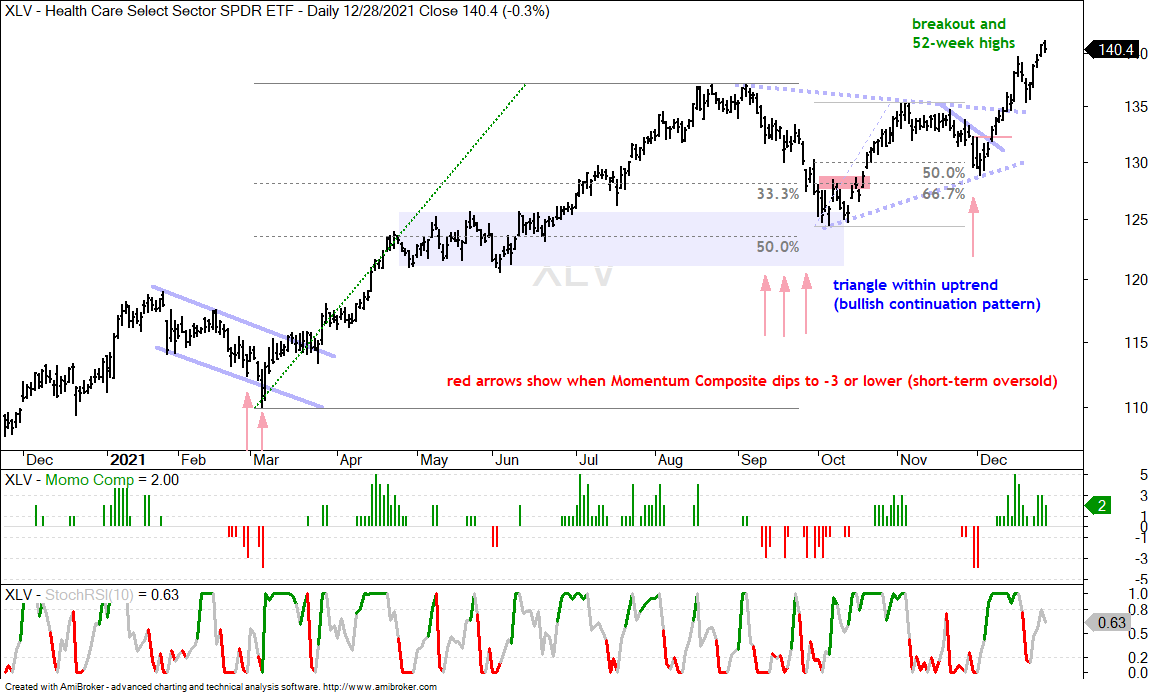
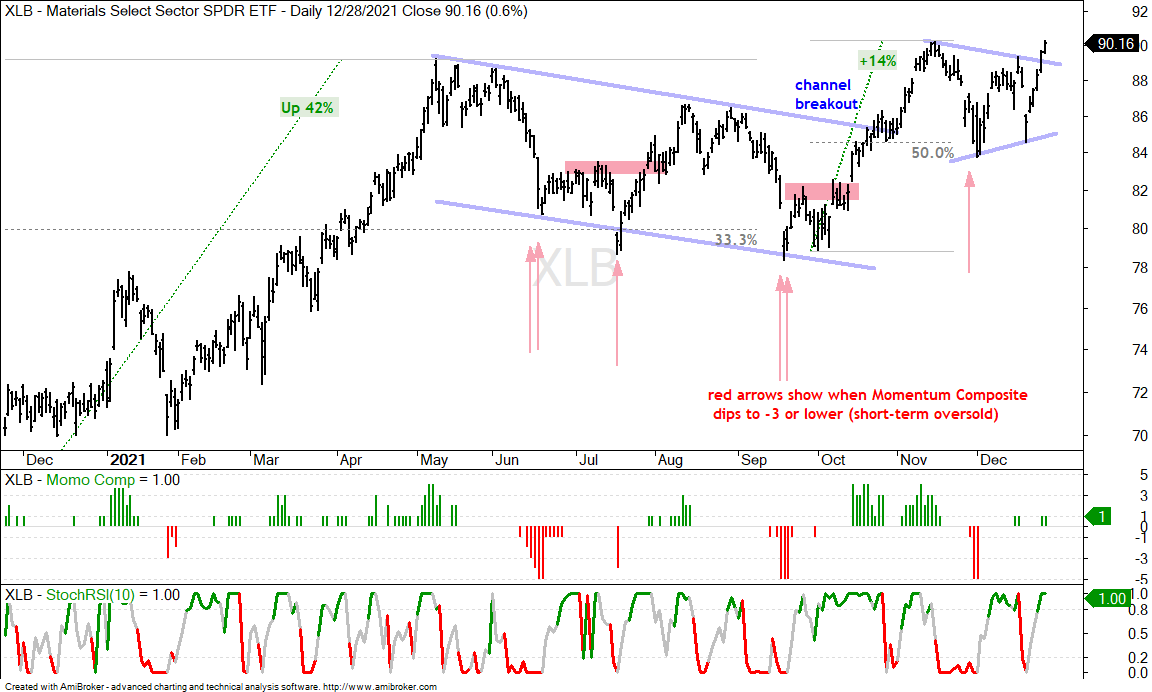
The S&P 500 is still dominated by the tech sector, and now more than ever because XLK accounts for 29.36% of SPY. Healthcare is the second largest sector (13.2%). Staples (5.8%), REITs (2.7%) and Utilities (2.45%) together account for around 11%. Even though these are defensive sectors, they are part of the S&P 500 and enough to push the leadership group past the 50% weighting. The Materials SPDR (XLB) is not a defensive sector, but it is pulling its tiny weight (2.5%) with a 52-week high this week. All told, these five sectors account for 56% of the S&P 500.
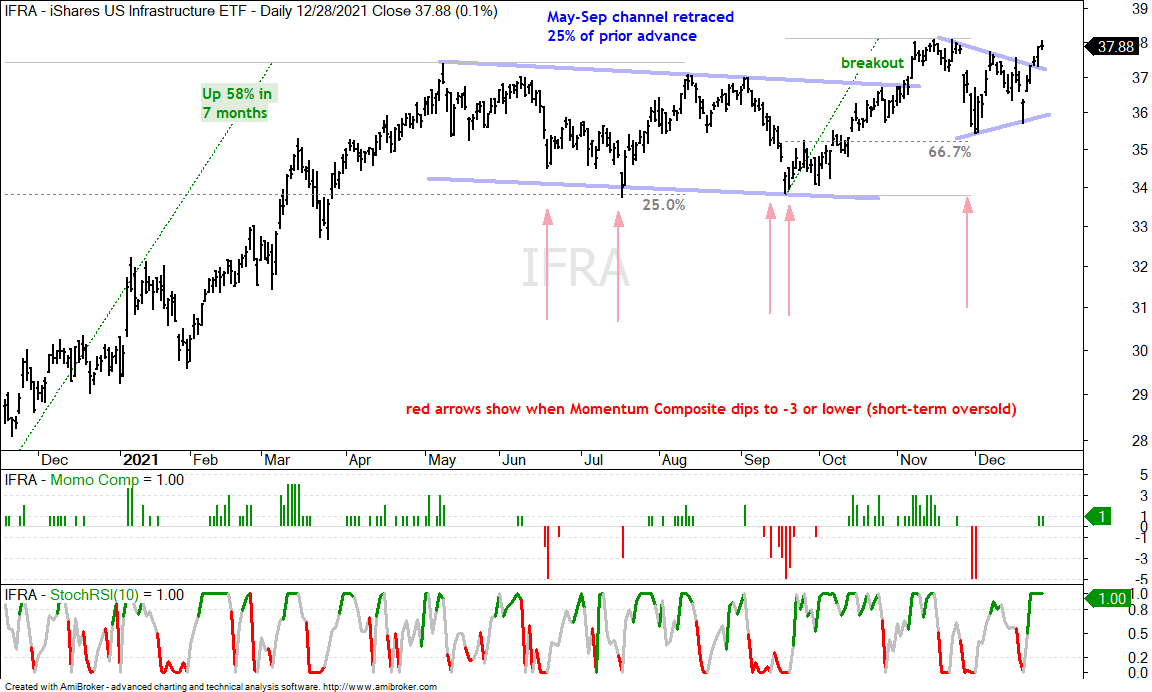
I do not see any setups in XLRE, XLP or XLU. They are simply in uptrends and leading with new highs in the second half of December. The same goes for some related ETFs (REZ, IYR, PBJ). The next chart shows the Materials SPDR (XLB) with a channel breakout in early November. After a 14% surge, the ETF consolidated with a triangle and broke out of this triangle on Monday. The Infrastructure ETF (IFRA) sports a similar chart configuration.
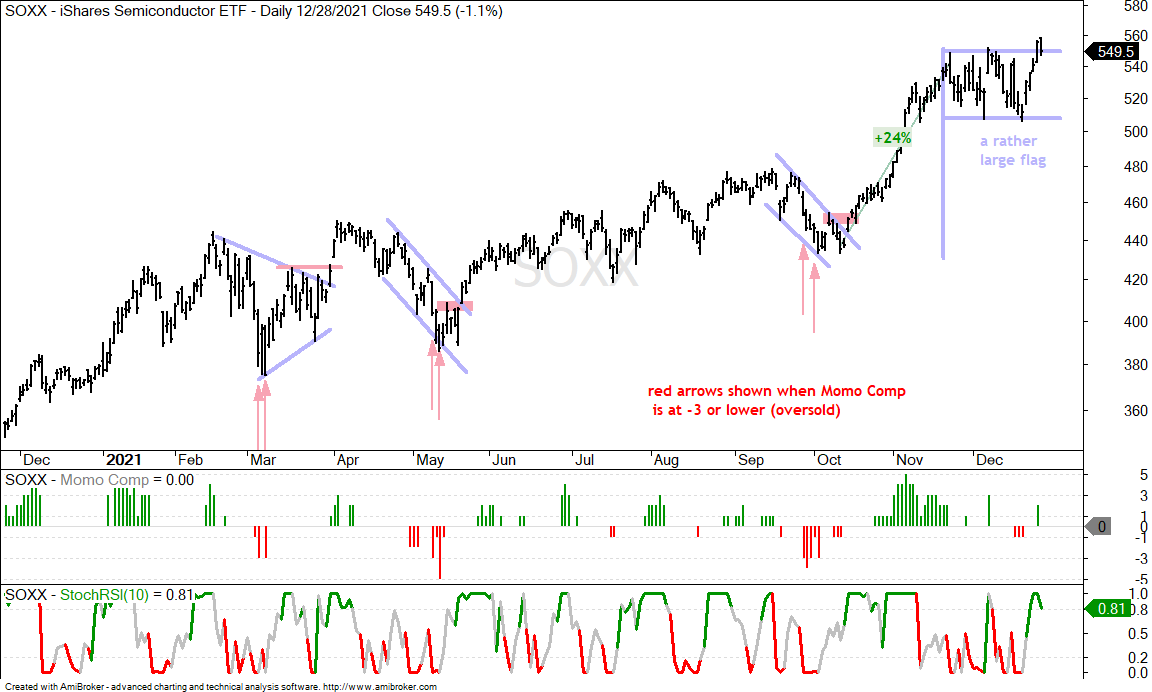
Software (33.15%) and Semis (20.70%) are the biggest industry groups within the Technology sector. The Semiconductor ETF (SOXX) is doing its part, but the Software ETF (IGV) is lagging here in December. The chart below shows SOXX breaking out to a new high on Monday and falling back on Tuesday. Even though the breakout and new high are bullish, I would put this pattern/setup in the observable category, as opposed to the actionable. Observable and actionable are terms used by Greg Morris. In my judgment, observable patterns and breakouts are ones that affirm an underlying trend, but do not offer a good reward-to-risk ratio or tradable setup. Actionable breakouts, on the other hand, occur after pullbacks and represent a short-term reversal that offers a good reward-to-risk ratio. The flag in SOXX is quite large with the breakout occurring around 550. The flag low is around 506, which is 8-10% lower.
While the Next Gen Connectivity ETF (FIVG) and SOXX exceeded their early December highs and recorded new highs this week, the Software ETF (IGV) did not exceed its early December high and remains a laggard. As noted before, I liken the 15% decline from mid November to early December to the 15% decline in February-March. The Feb-Mar decline did not result in an extended downtrend, but it did foreshadow a corrective period that extended into May (yellow shading).
Note that the Cloud Computing ETF (SKYY), FinTech ETF (FINX), Internet ETF (FDN) and Mobile Payments ETF (IPAY) did not surpass their early December highs on the recent bounce and are also lagging short-term. The Cybersecurity ETF (CIBR) is performing better because it broke above its early December low with a bounce the last five days. The CIBR chart also sports a more consistent uptrend that the other four.
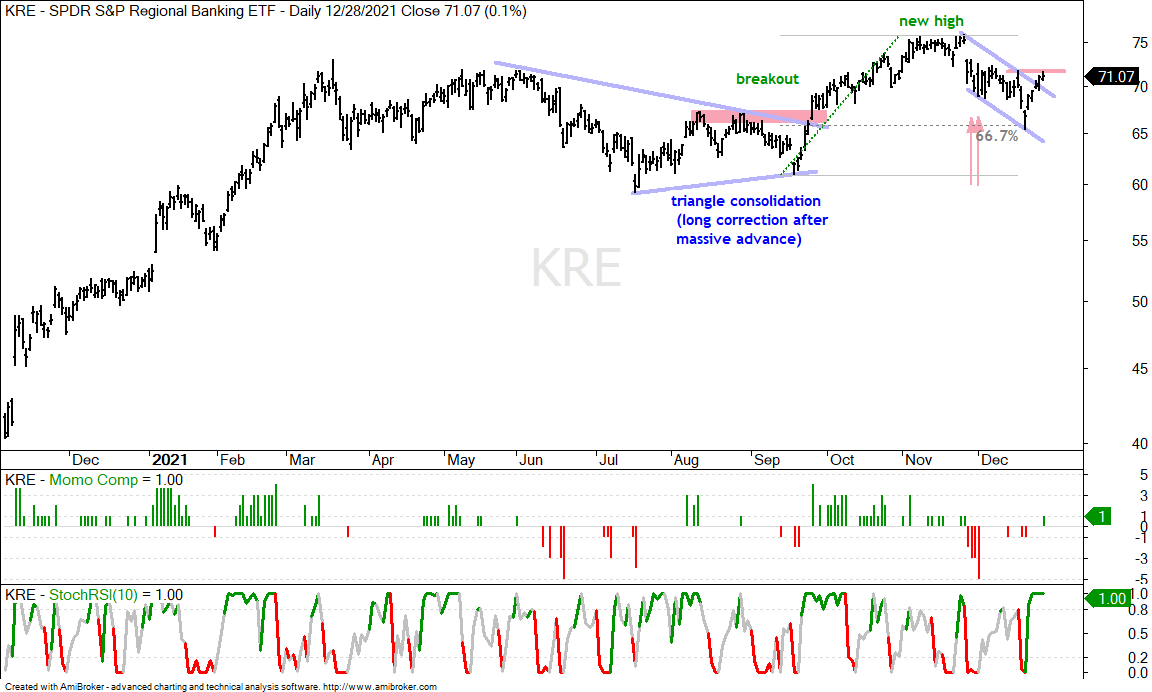
KRE Corrects and Pops
The Regional Bank ETF (KRE) is making a bid to reverse its pullback with a surge the last five days and break above the upper line. StochRSI also popped above .80 for the first time since the ETF became oversold in late November. Technically, a signal is in the making here because the December decline is viewed as a pullback within a bigger uptrend.
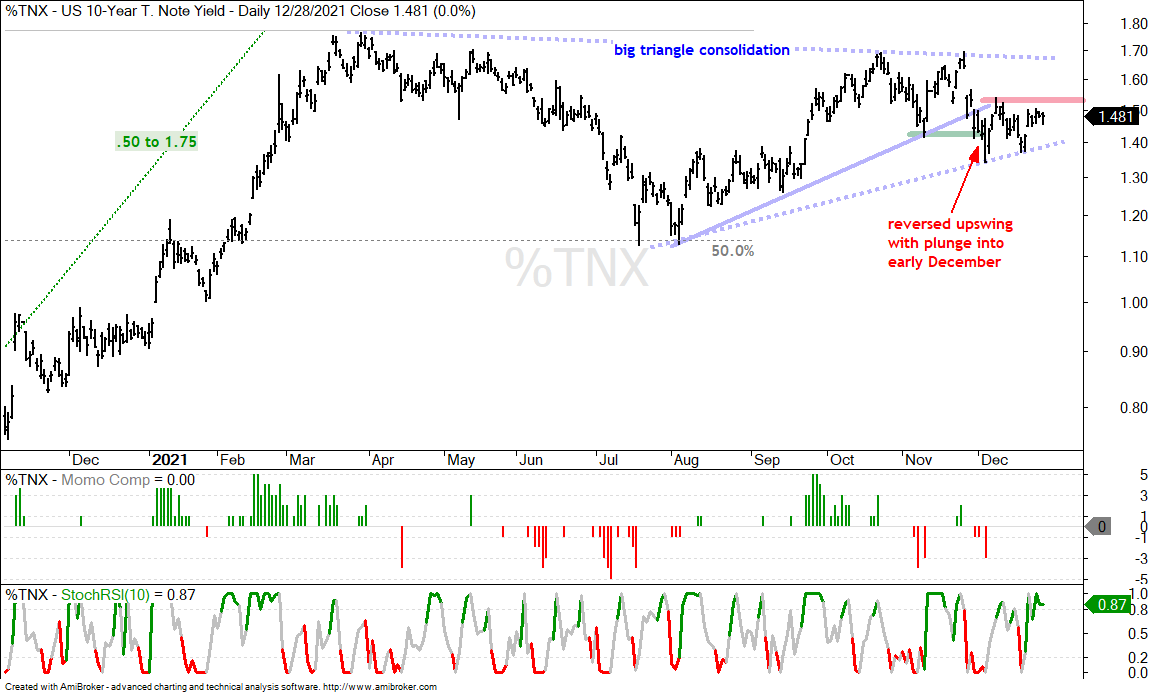
The 10-yr Treasury Yield could hold the key to the next move in XLF and the bank ETFs. Banks are positively correlated with the 10-yr yield and this means a breakout in the 10-yr would be bullish for banks. The chart below shows $TNX within a large triangle consolidation and the swing within this consolidation is down. A break above the mid December highs is needed to signal an upturn.
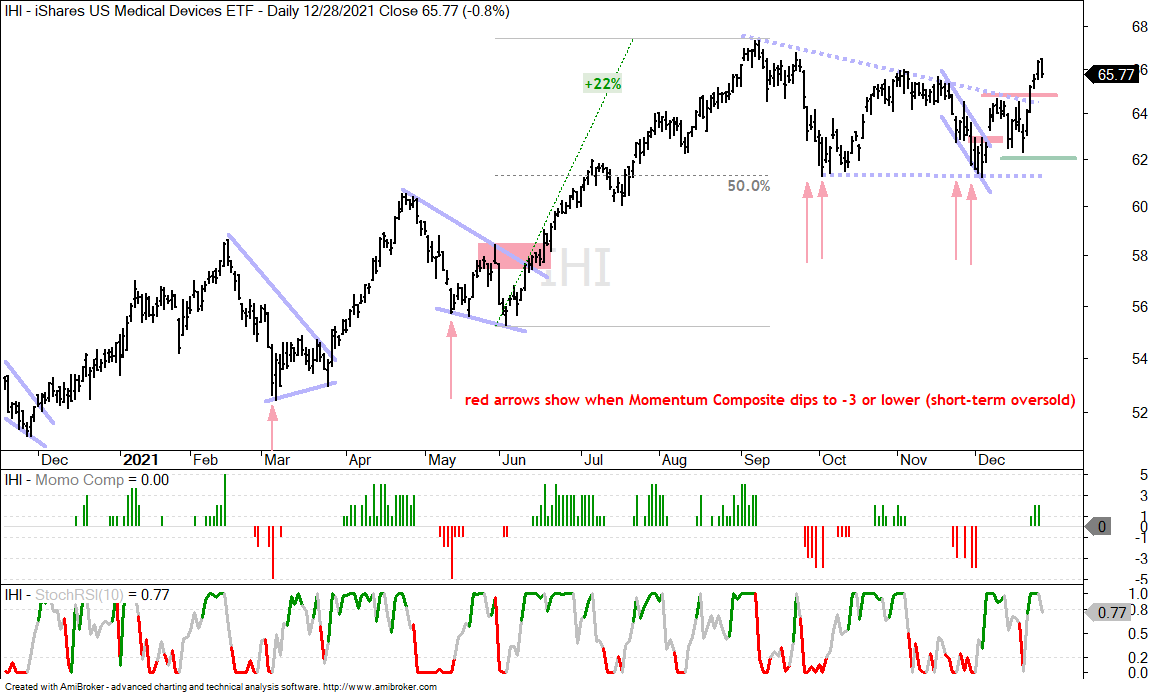
The Medical Devices ETF (IHI) has been on the radar since it became oversold in late November and surged in early December. This surge reversed the downswing within the bigger triangle and the ETF followed through with a triangle breakout the last five days.
You can learn more about exit strategies in this post[4], which includes a video and charting options for everyone.
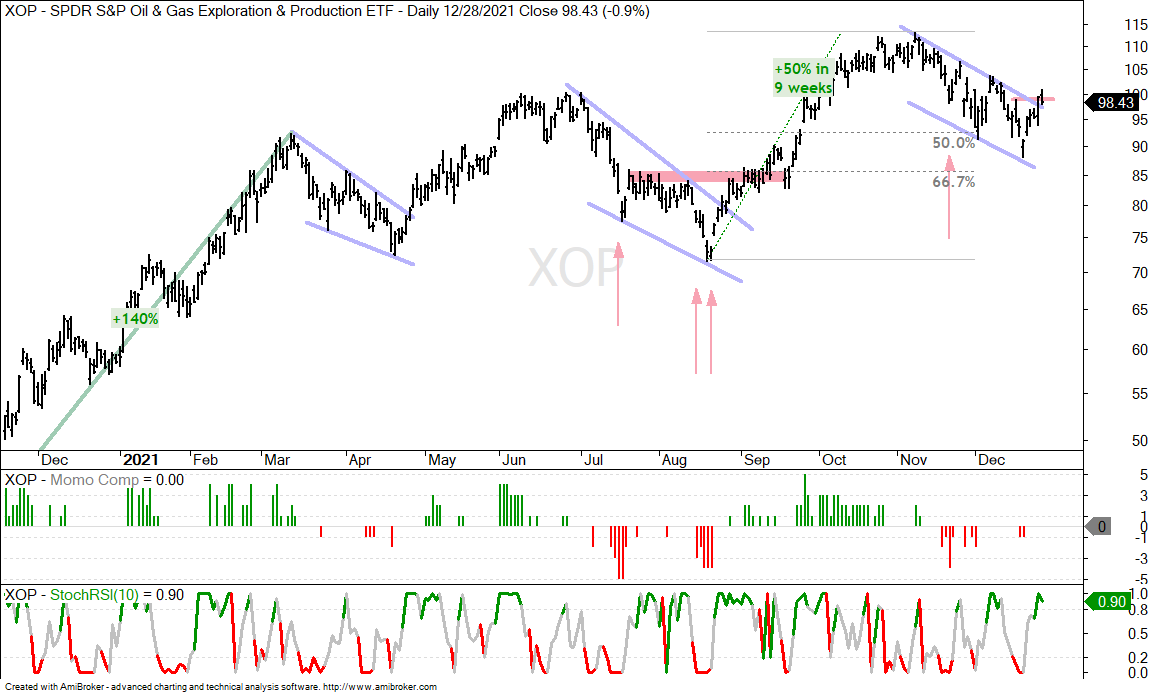
The Energy SPDR (XLE) and the Oil & Gas Exploration & Production ETF (XOP) hit new highs in early November and then corrected into December with falling flag patterns that retraced around half of the prior advance. Both ETFs became oversold in mid November and there were StochRSI pops, but a breakout did not take hold. XOP is currently making a breakout attempt and XLE is challenging the upper line of the flag.
The next chart shows West Texas Intermediate ($WTIC) bouncing off the dashed green line as a higher low formed from August to November. This bounce is bullish and keeps the bigger uptrend alive. A close below 69 would argue for a re-evaluation.
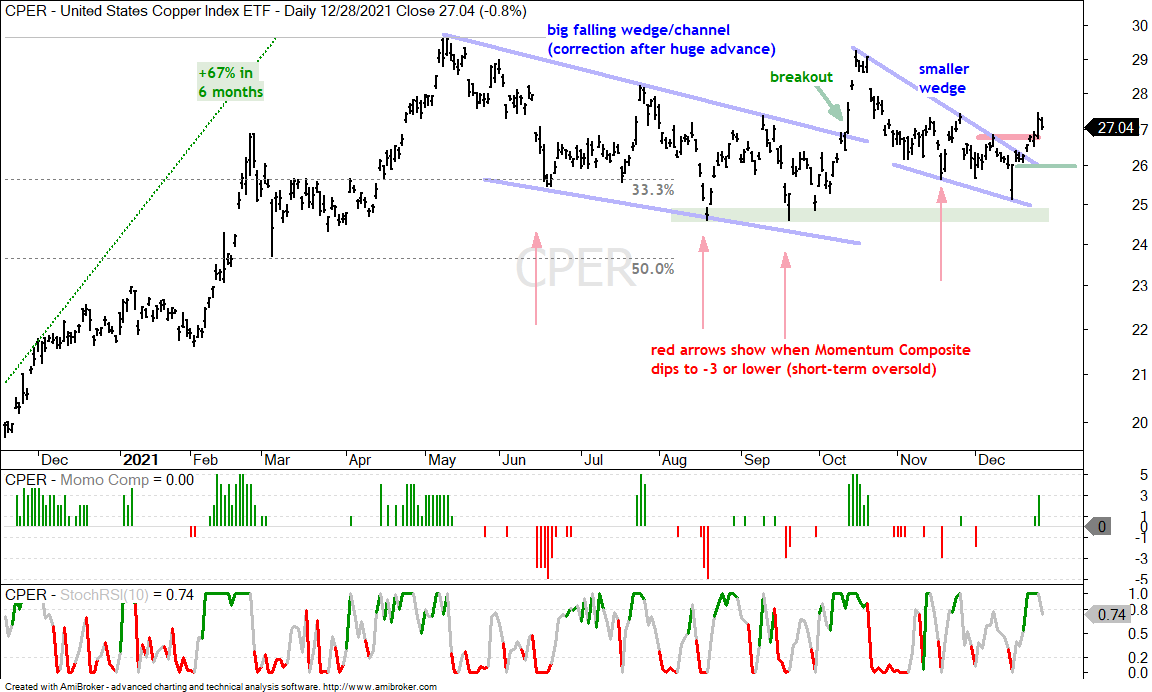
The Copper ETF (CPER) took part in the risk-on moves the last five days and extended on its (smaller) wedge breakout. This breakout is bullish and I would re-evaluate on a close below 26.
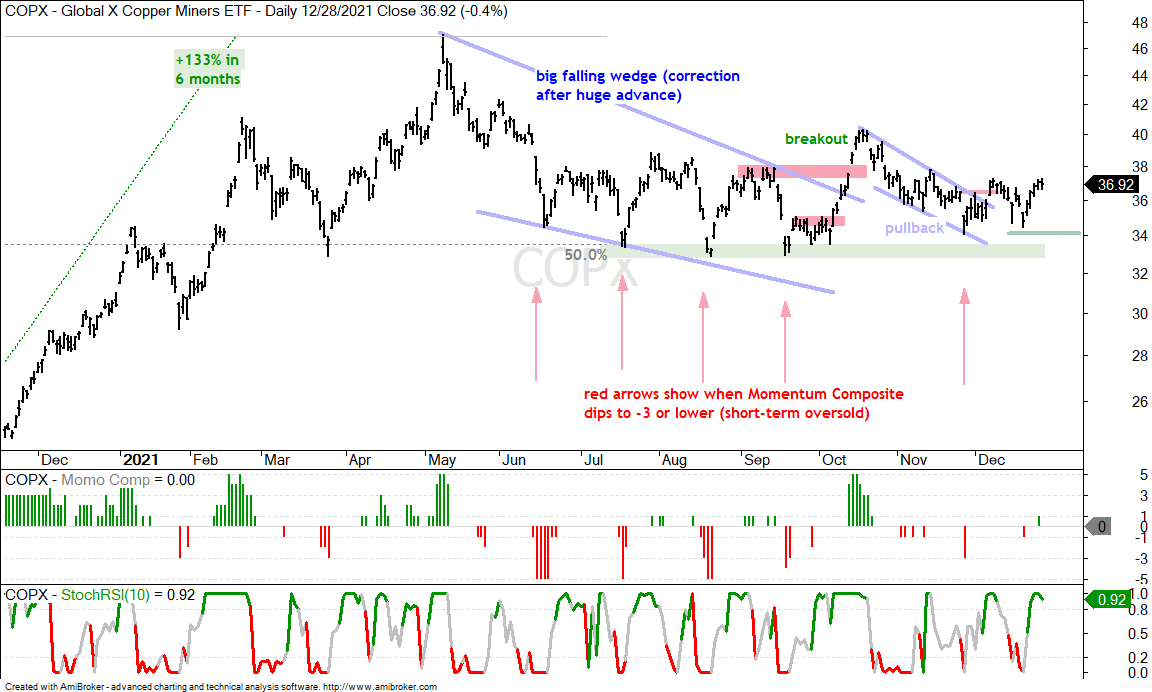
The Copper Miners ETF (COPX) also advanced the last five days and is holding its (smaller) wedge breakout more or less. A close below the mid December low would argue for a re-evaluation.
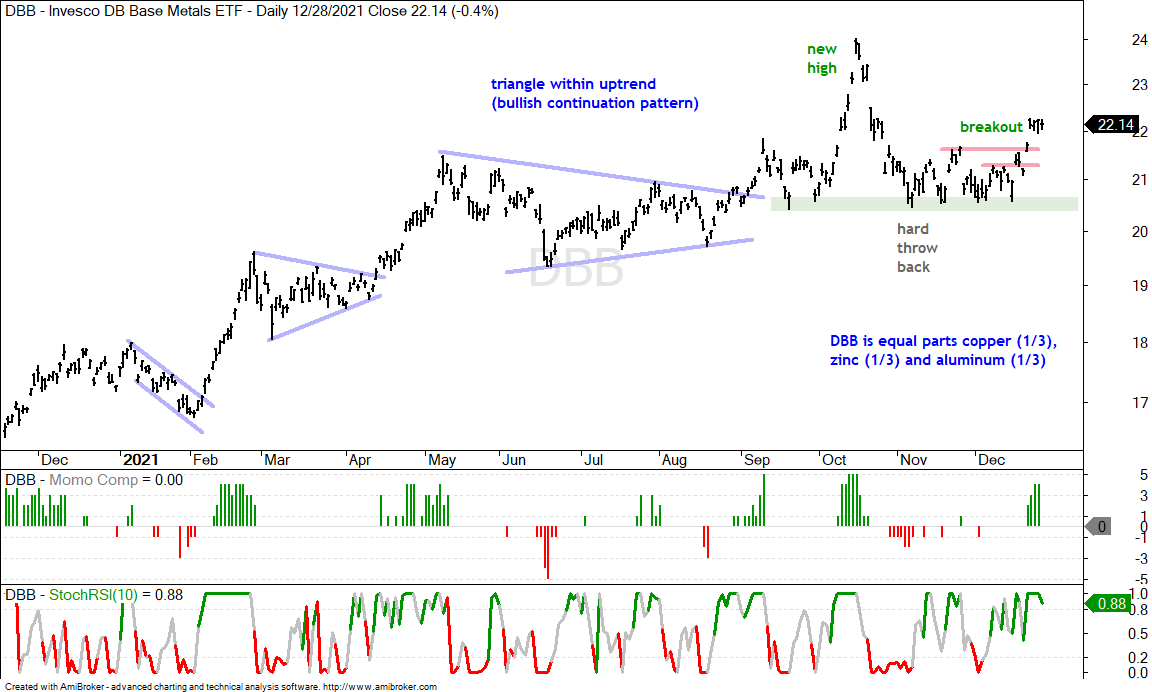
The DB Base Metals ETF (DBB) broke out as well and the breakout is holding.
The Momentum Composite aggregates signals in five momentum indicators. RSI(10) is oversold below 30 and overbought above 70. 20-day StochClose is oversold below 5 and overbought above 95. CCI Close (20) is oversold below -200 and overbought above +200. %B (20,2) is oversold below 0 and overbought above 1. Normalized ROC (10) is oversold below -3 and overbought above +3. Normalized ROC is the 10-day absolute price change divided by ATR(10). -3 means three of the five indicators are oversold and +3 means three of the five are overbought.
The Momentum Composite and StochClose are part of the TIP Indicator Edge Plugin for StockCharts ACP. Click here for more details.[5]
The Metals & Mining SPDR (XME) sports a large Ascending Triangle, which is a bullish continuation pattern. The swing within the pattern was down and XME reversed this downswing with a breakout five days ago and followed through with further gains. This increases the chances for a bigger breakout at 48. A close below 42 would argue for a re-evaluation.
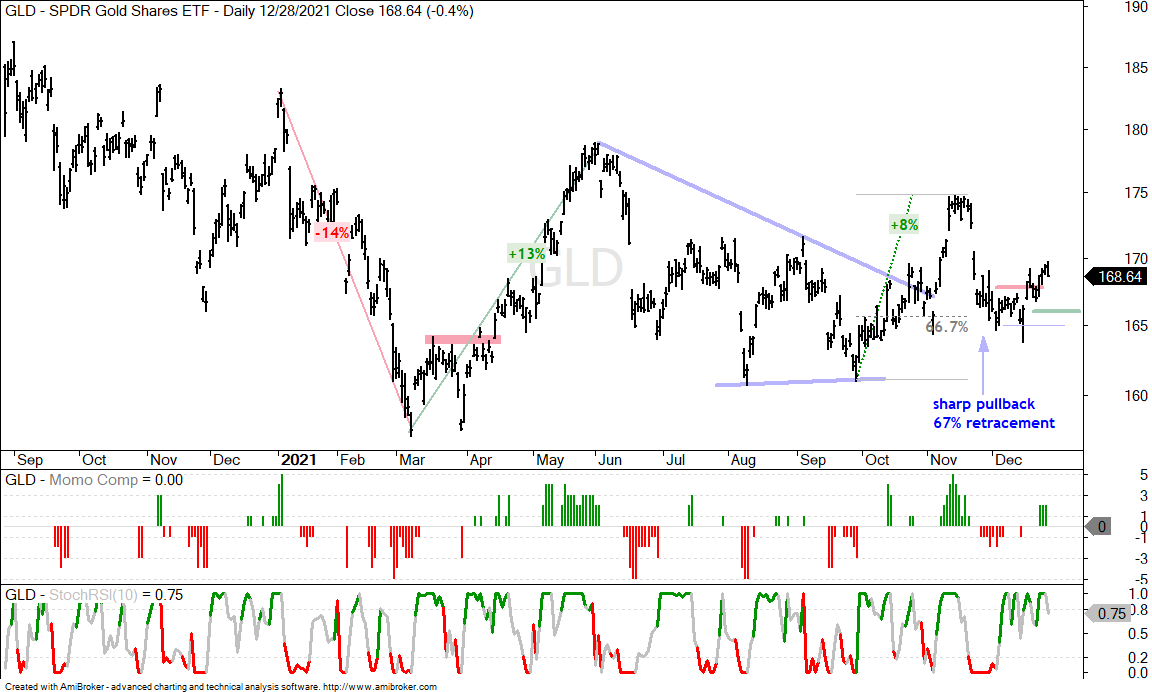
The Gold SPDR (GLD) has gone either way since this year, and could still go either way. How’s that for ambiguous! GLD started the year with a 14% plunge and answered that decline with a 13% advance. The swings since these two double digit moves have been smaller and GLD is largely range bound. Short-term, the 8% surge and breakout were bullish and GLD retraced 2/3 of this surge with a decline back to the 165 area. The ETF broke out with the surge in mid December and this breakout is holding for the most part. A close below 166 would negate this breakout and call for a re-evaluation.