
Samples
Market-ETF Report – Long-term Down + Short-term Overbought = Not Ideal
This sample is taken from an actual report coving broad market conditions, SPY/QQQ charts and leading ETFs Click here to

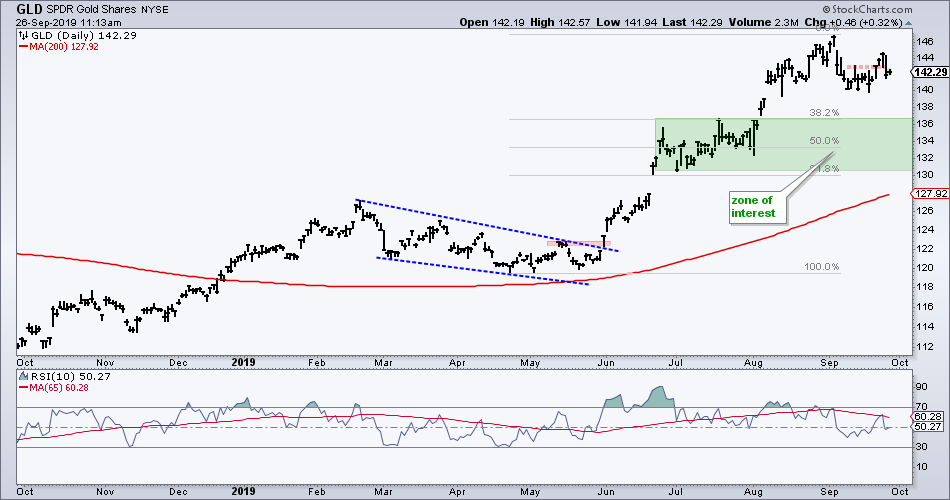
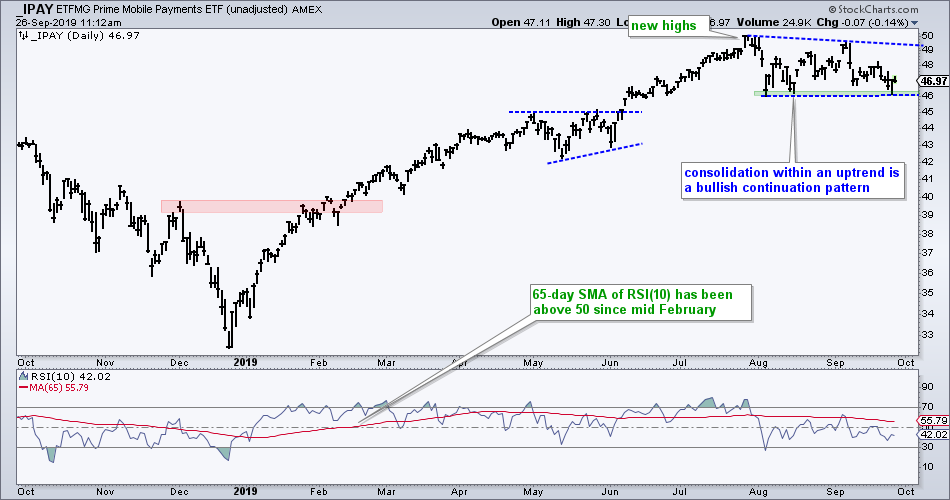
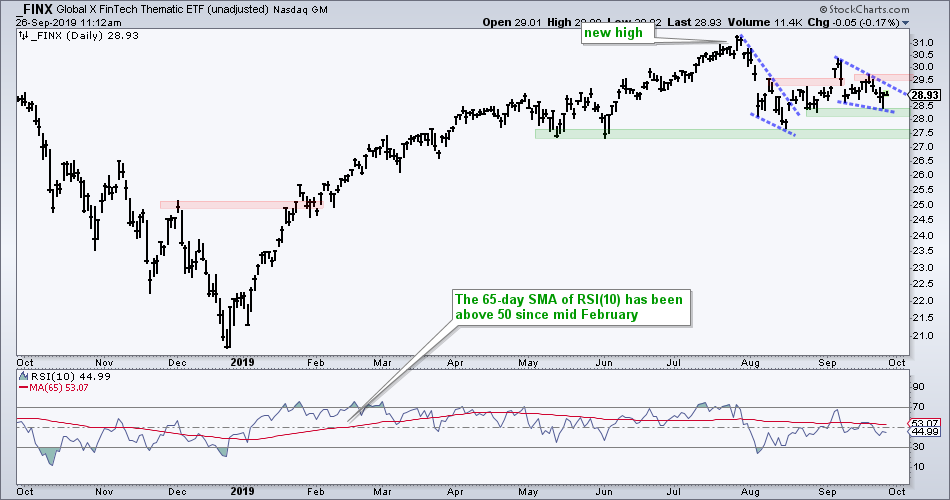
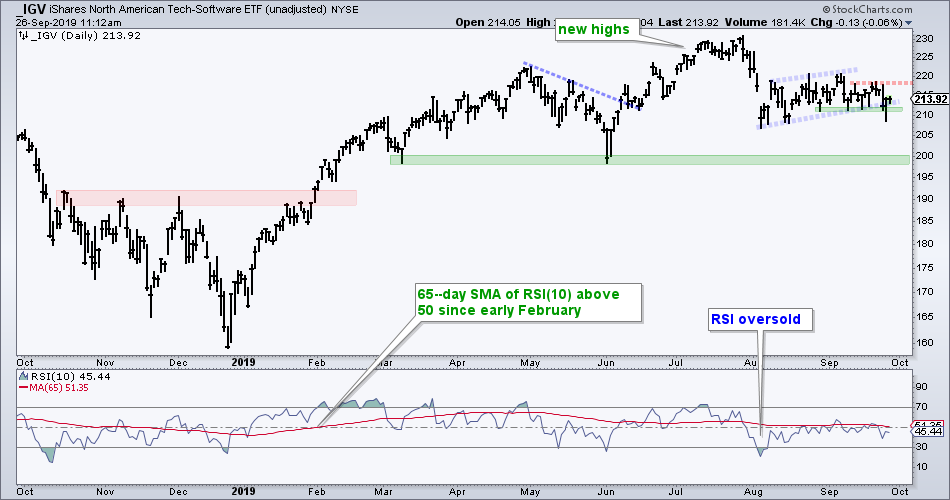
Samples
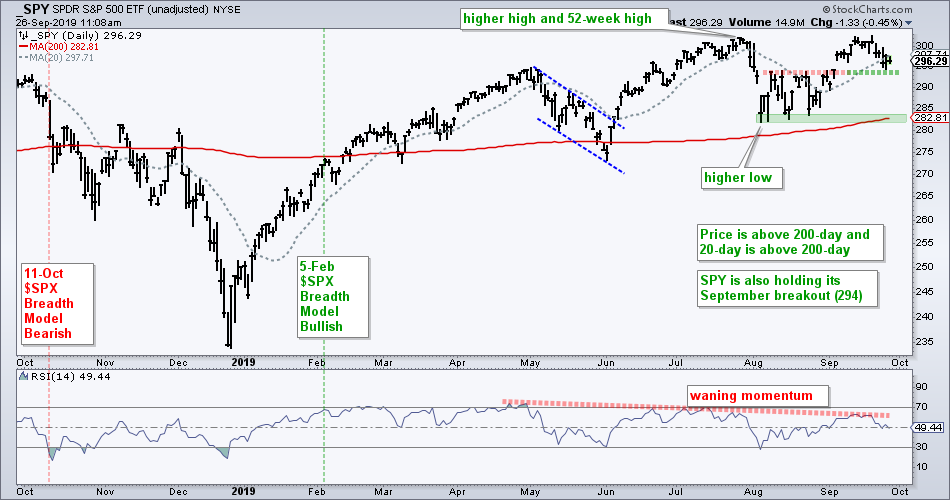
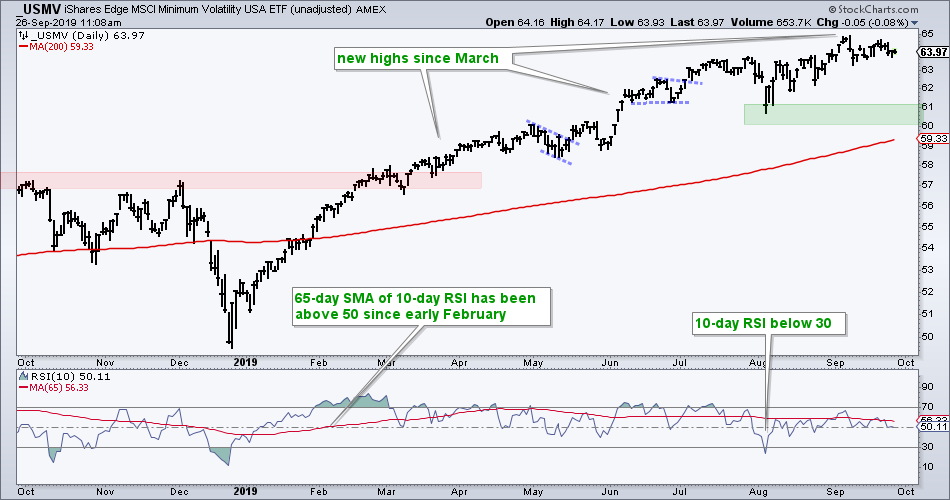
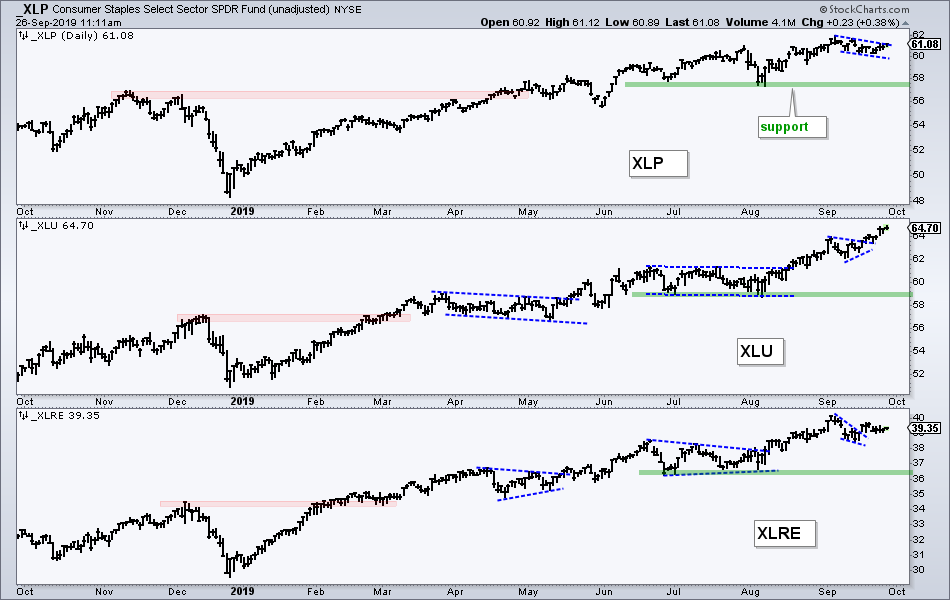
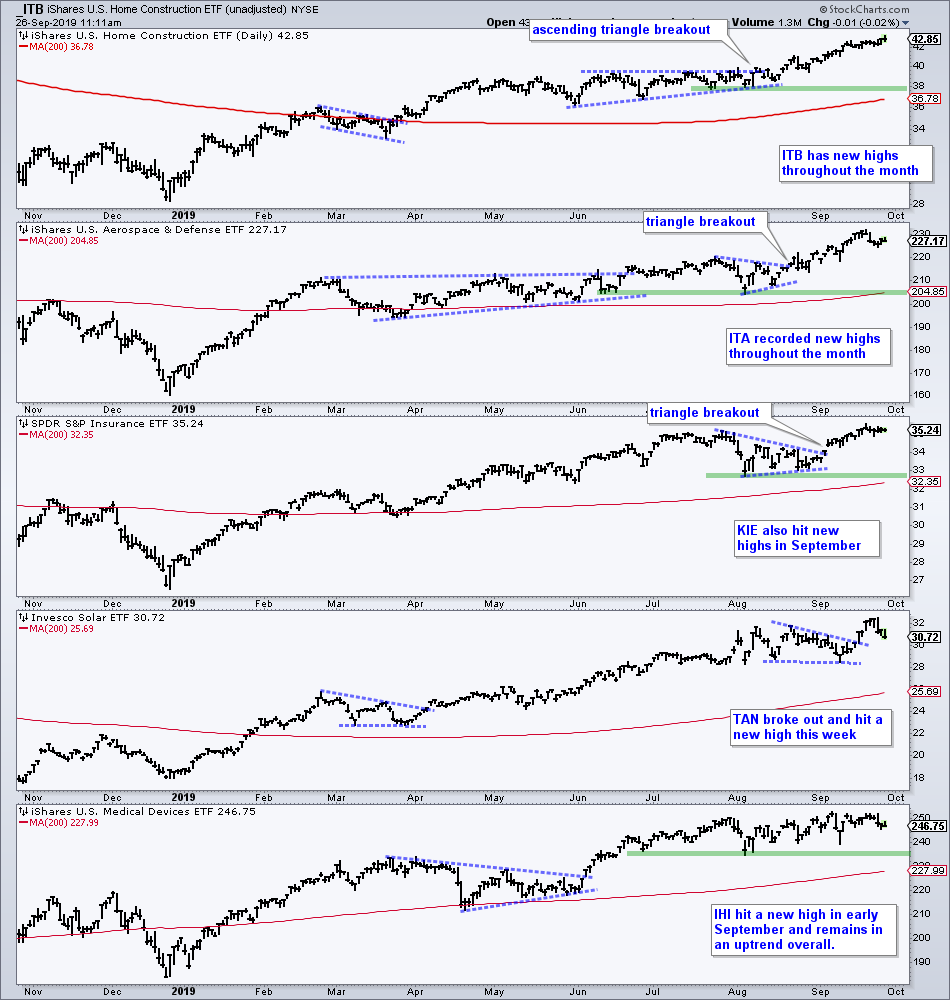
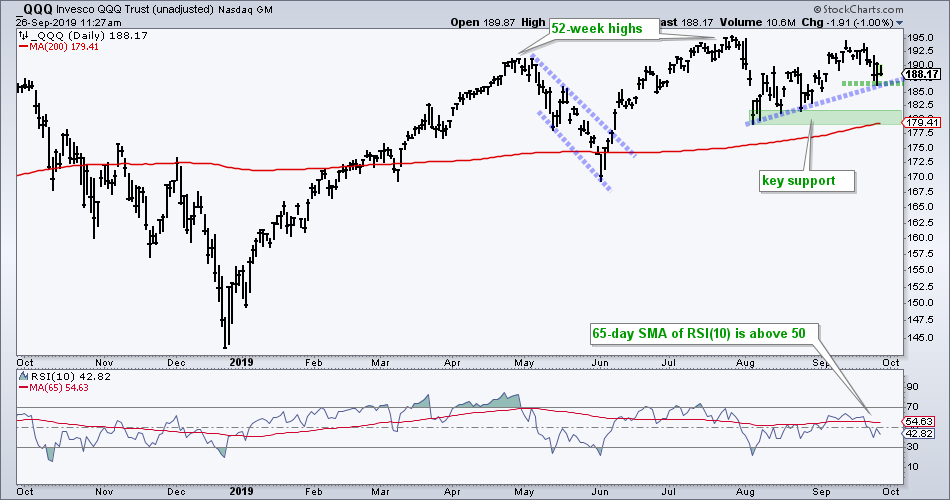
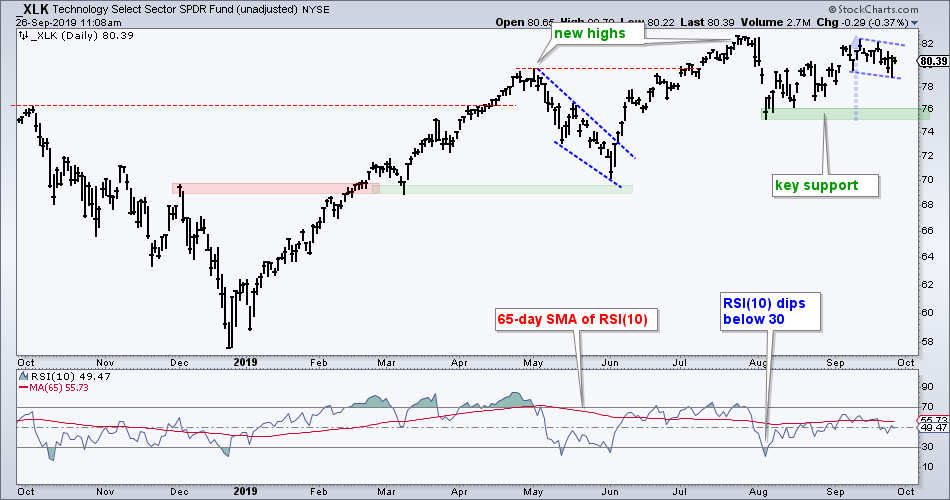
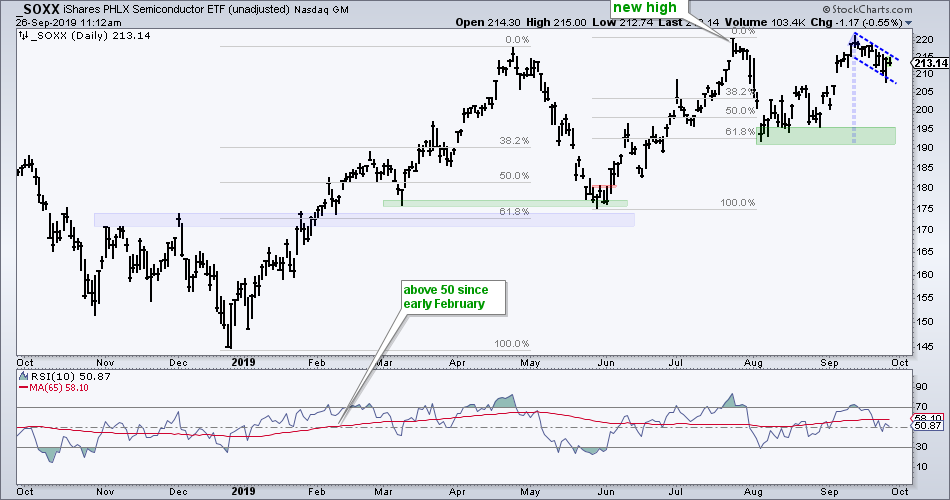
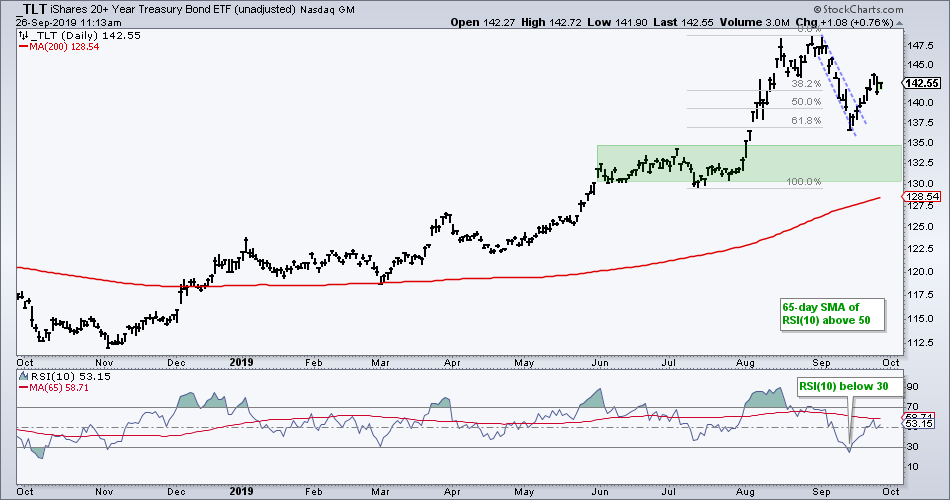
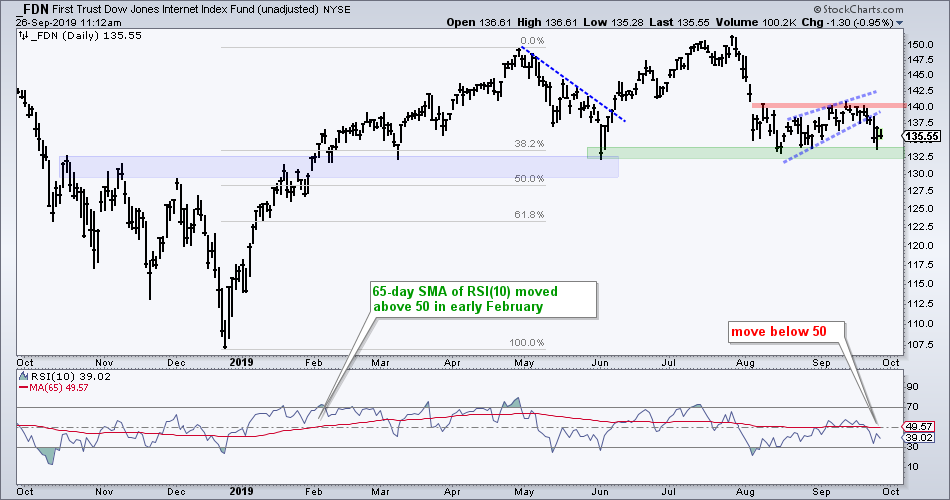
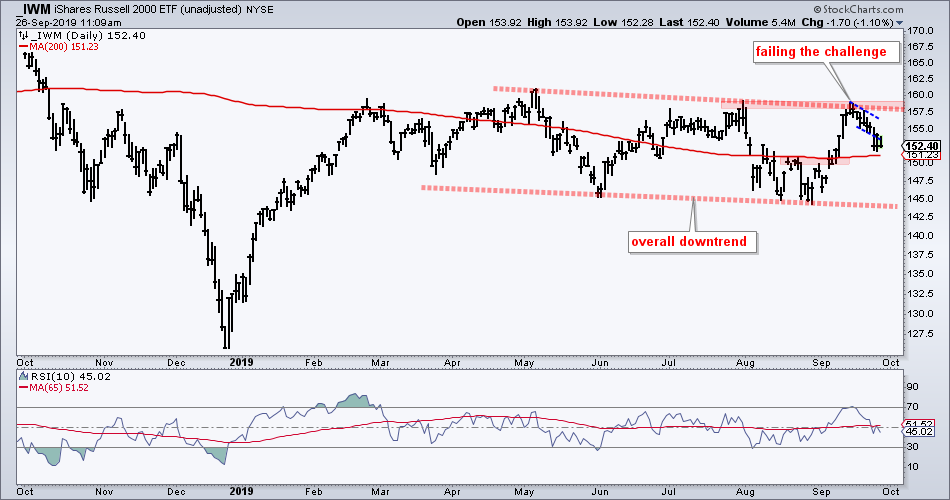
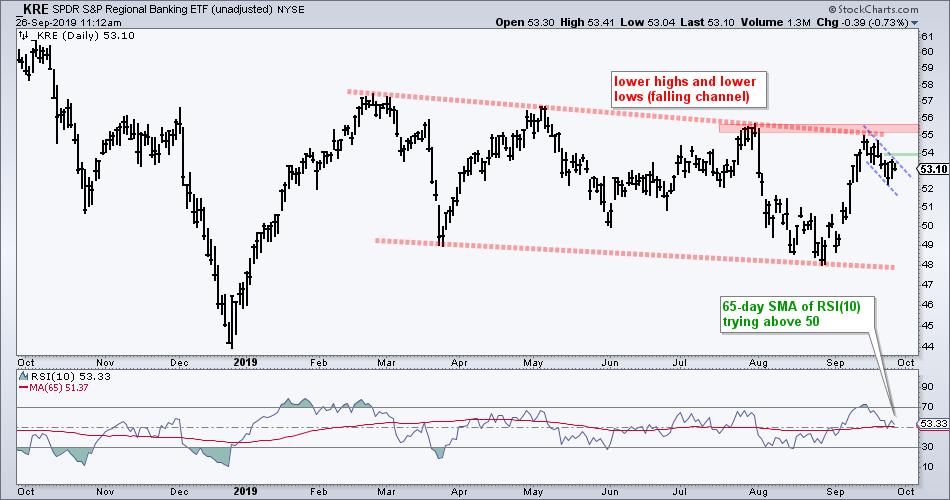
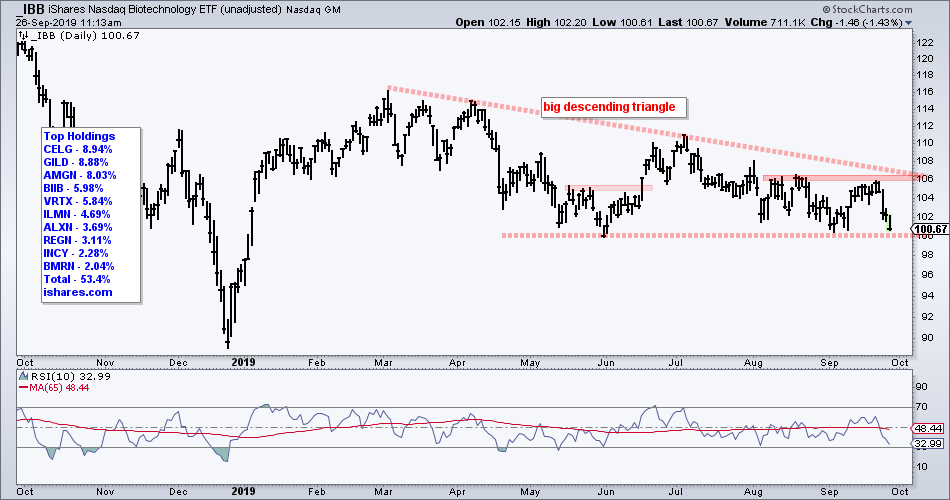
Chart Trader – Sample Report
Here is some sample charts and analysis from our reports. Reports are posted Tuesdays, Wednesdays and Thursdays by 8AM ET.
Dual Momentum Rotation Strategy (S&P 500) – Details and Performance (latest)
Strategy Update (last close: August 31st, 2024) The S&P 500 (SPX) continues to lead the way for the Dual Momentum