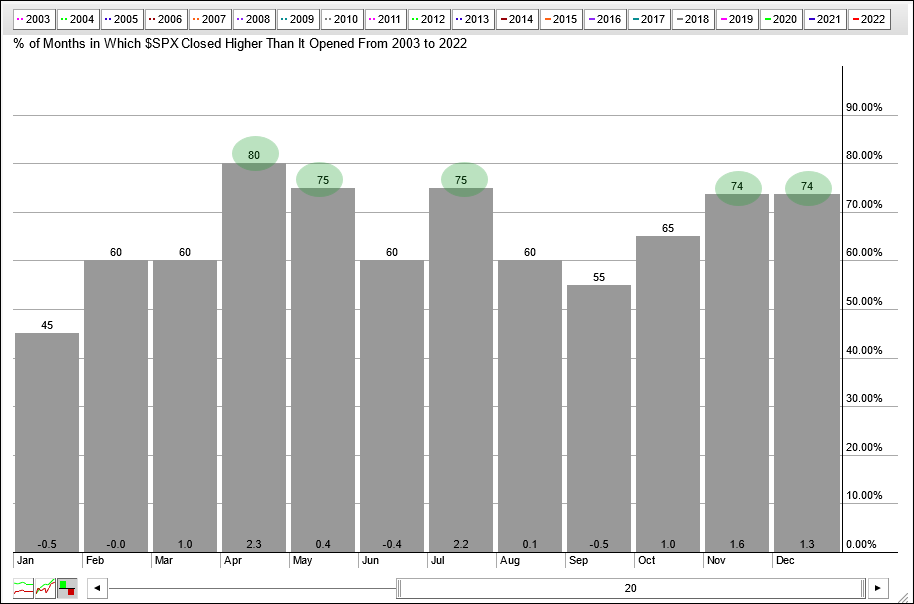
The seasonal patterns for October and yearend are quite positive, but seasonality is just one aspect of broad market analysis and the weight of the evidence remains bearish.
The histogram below shows the seasonal patterns for the S&P 500 over the last twenty years. Five of the twelve months stand out because they closed higher more than 70% of the time (April, May, July, November and December). October is the sixth strongest month of the year because it closed higher 65% of the time. Not bad, but this also means October closed lower 35% of the time.
Even though October has positive expectations and November-December are even stronger, I am putting seasonal patterns on the back burner because the tape is bearish and the Fed is tightening. I bet many of you can guess what I am going to say next! Don’t fight the tape or the Fed. This phrase, which was coined by the late Marty Zweig, is as prevalent today as it was in the 80s. Yes, the 80s are back! The tape is bearish because the S&P 500 is in a downtrend. This key benchmark is below the falling 200-day SMA and the Trend Composite [1] has been negative since April 19th.
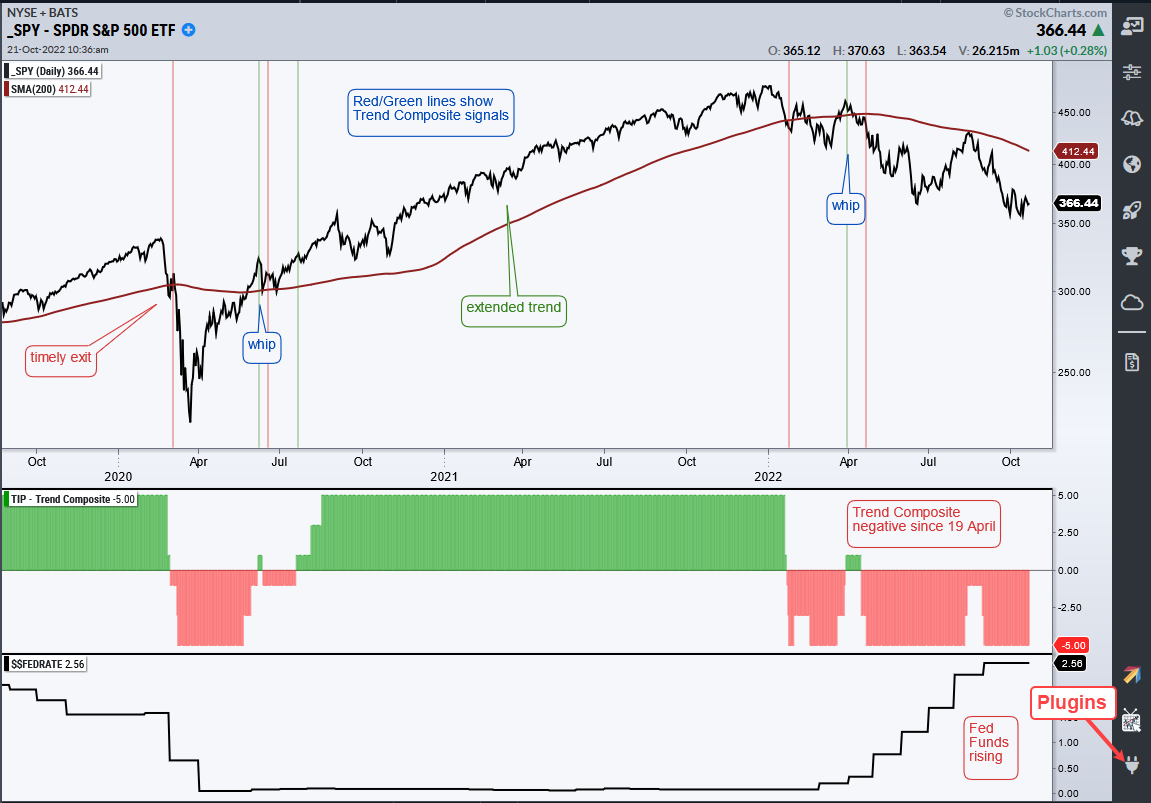
The bottom window shows the Effective Fed Funds Rate ($$FEDRATE) turning up in March and stair-stepping higher since. Rates are rising sharply so being bullish now would be fighting the Fed. I would also note that the balance sheet has been contracting since April. Even though I am showing Fed Funds here, I will be watching the 10-yr Treasury Yield for the first signs of a change in Fed policy because the bond market tends to lead the Fed.
Bullish seasonal patterns may produce a counter-trend bounce or consolidation because the S&P 500 became quite oversold recently, but the index remains in a long-term downtrend and the Fed is still in tightening mode. Nobody knows when the bear market will end or how far it will extend. The best we can do is accept the evidence and trade accordingly until it changes. Personally, I will be watching the breadth thrust indicators that are part of the TrendInvestorPro Composite Breadth Model, which has been bearish since April 11th. Click here for immediate access to our timing model [2], ETF reports, comprehensive videos and ETF Trend/Rank table.
The Trend Composite, Momentum Composite, ATR Trailing Stop and eight other indicators are part of the TrendInvestorPro Indicator Edge Plugin for StockCharts ACP. Click here to learn more and take your analysis process to the next level. [1]