Chart Trader Weekly Report – Broad Market Analysis, Leading Groups (ETFs), Chart Setups and Trading Ideas (Premium)
Posted By
Arthur Hill, CMT
On
In
Archive |
No Comments
Video and Report Headlines
September Scheduling
Composite Breadth Model is Bullish
BAA-AAA Spread Remains Bullish for Stocks
BBB Spread Widens in Sept, but Remain Narrow
SPY Gets Oversold Bounce after Steep Drop
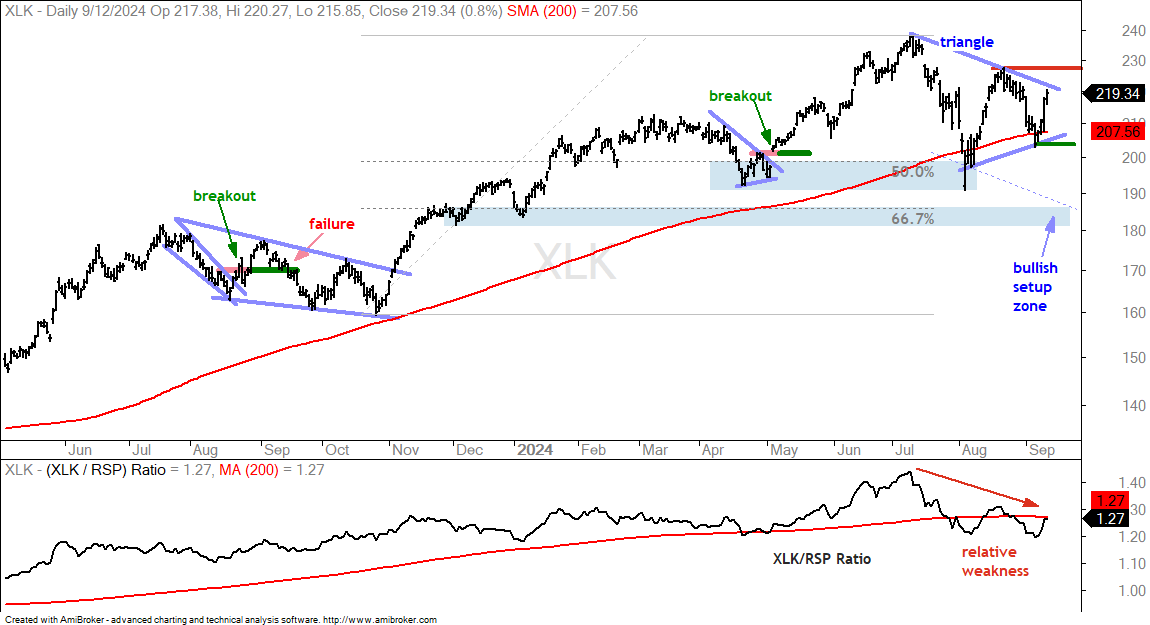
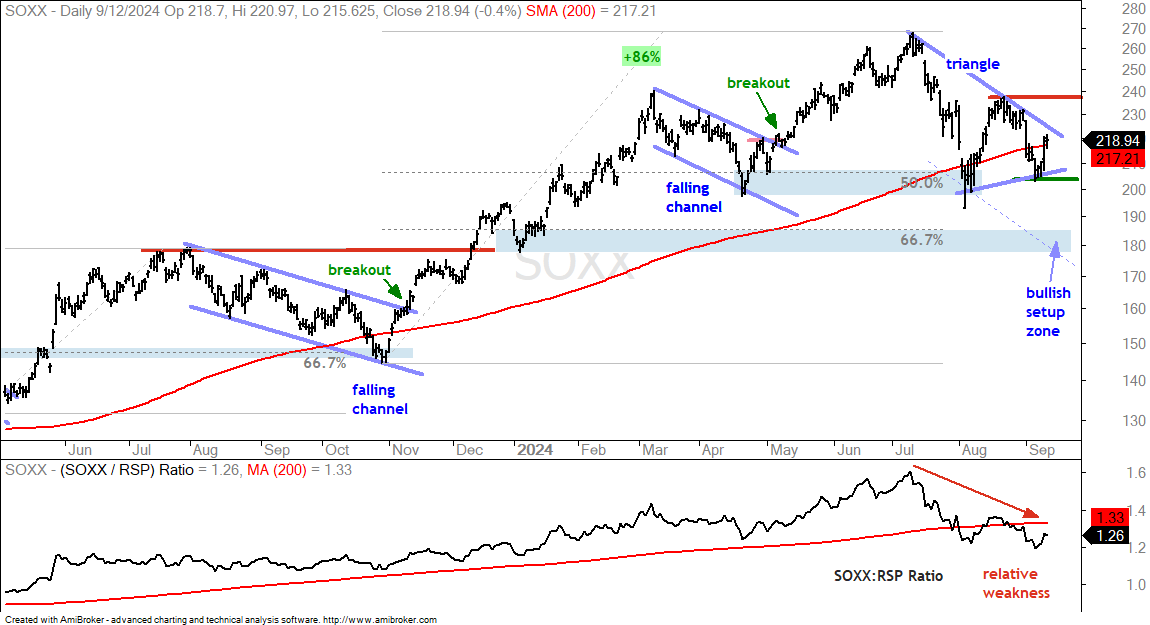
QQQ and Big Tech ETFs Triangulate (MAGS, XLK, SOXX)
Software, Cybersecurity, Cloud and Fintech Lead within Tech
MSFT, META, QCOM, ARM, DELL, AVGO and NVDA
Medical Devices Breakout and Biotech Setup
Wind Energy ETF Renews Breakout
Home Construction ETF Remains Strong
Aerospace & Defense ETF Sports Consistent Uptrend
TLT Extends Uptrend with Pennant Breakout
GLD Consolidates after Pennant Breakout
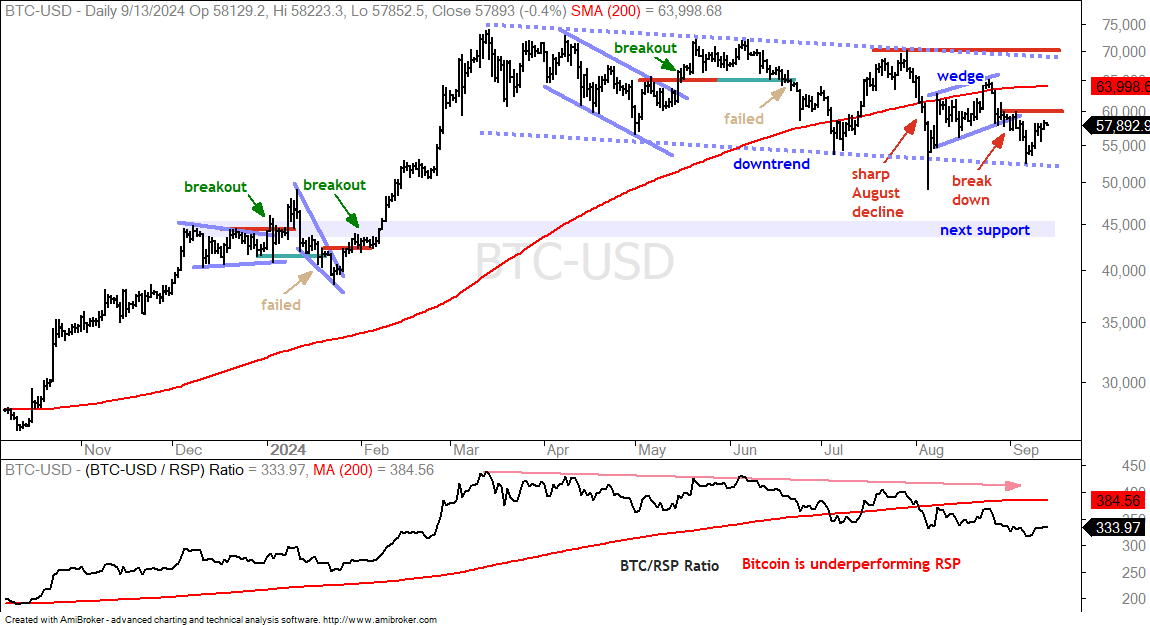
Bitcoin Breaks Wedge Support
The next Weekly Report will be posted on Thursday morning, September 19th.
September Scheduling
Due to upcoming travel, the September publishing schedule for the Chart Trader Weekly Report/Video will be as follows:
Friday, September 13th
Thursday, September 19th
Sunday, September 28th
I will also publish two educational reports and videos.
Friday, September 20th – Finding and Trading Bullish Setup Zones
Friday, September 27th – Breadth for Capitulation, Thrust and Market Signals
Composite Breadth Model is Bullish
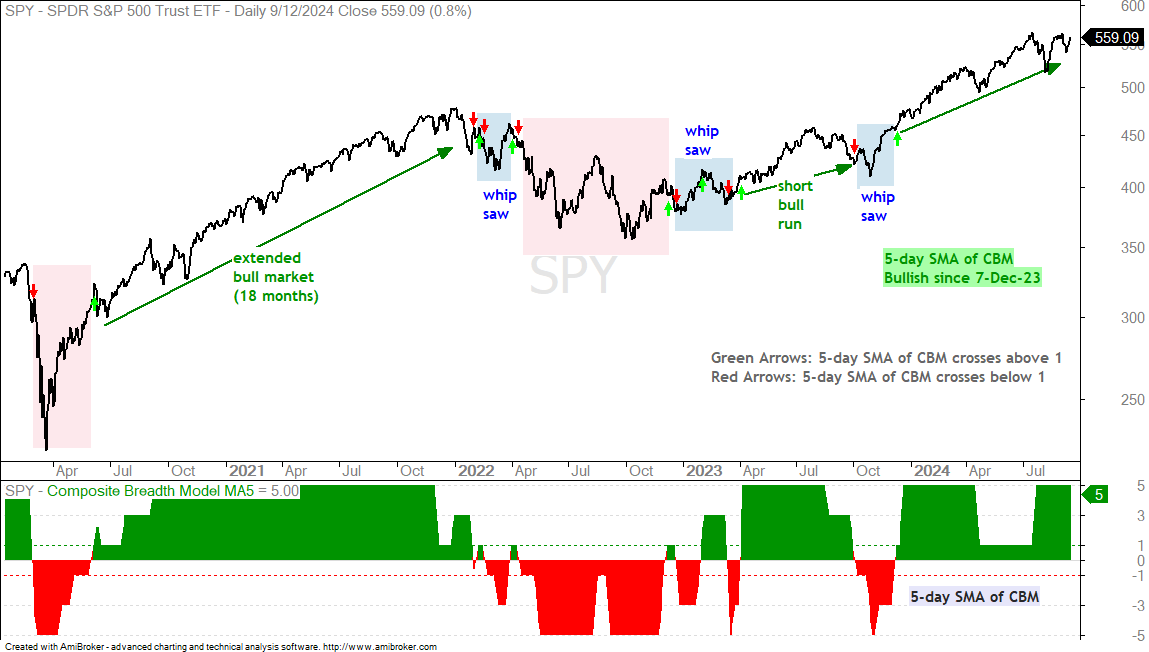
The chart below shows SPY with the 5-day SMA of the Composite Breadth Model at +5. This model turned bullish on December 7th and remains bullish. A positive CBM signals a favorable environment for stocks (bull market). Even with a bullish CBM, we can still see pullbacks, corrections, volatility, rotations and trading ranges.
The Composite Breadth Model aggregates[1] signals in over a dozen breadth indicators from the S&P 500 and S&P 1500. This means it covers large-caps, mid-caps, small-caps, NYSE stocks and Nasdaq stocks. It ranges from +5 to -5. A bull market is present when the 5-day SMA of the CBM is at +1 or higher. A bear market is present when below +1.
BAA-AAA Spread Remains Bullish for Stocks
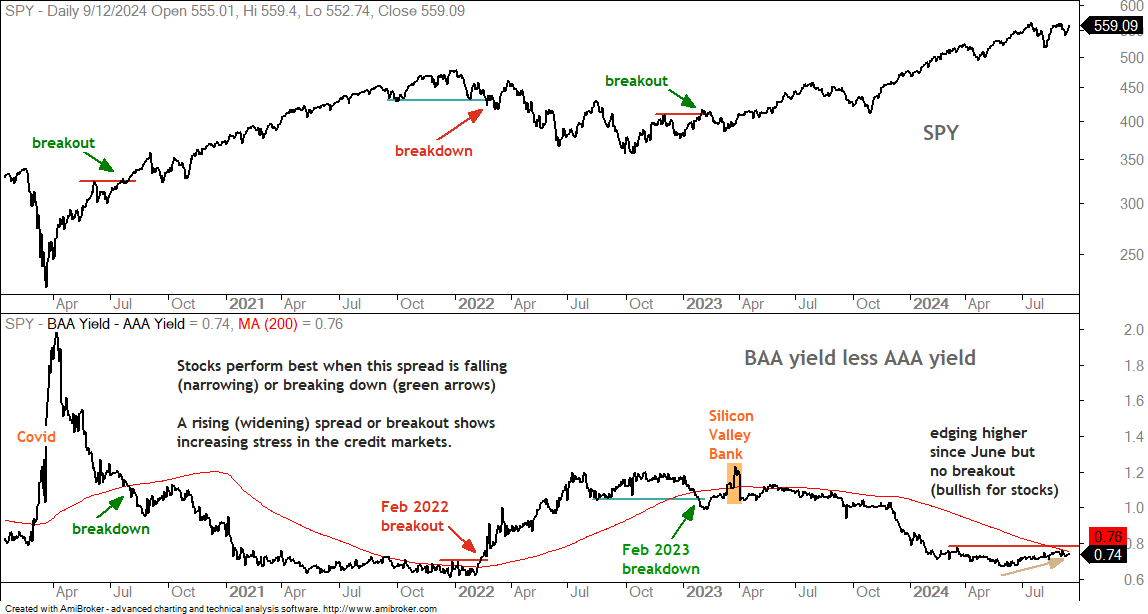
The next chart shows the BAA-AAA yield spread edging higher since June, but short of a breakout (red line). This spread is not showing stress and remains bullish. A break above .78 would put this spread at its widest level since January and signal increasing stress in the corporate bond market.
According to Moody’s, AAA bonds are the highest grade corporate bonds with the lowest level of default risk. BAA bonds have moderate credit risk and “certain speculative characteristics”. The spread between these two narrows (falls) when credit conditions are favorable (no stress). The spread widens (rises) when conditions are deteriorating (increasing stress).
BBB Spread Widens in Sept, but Remains within 2024 Range
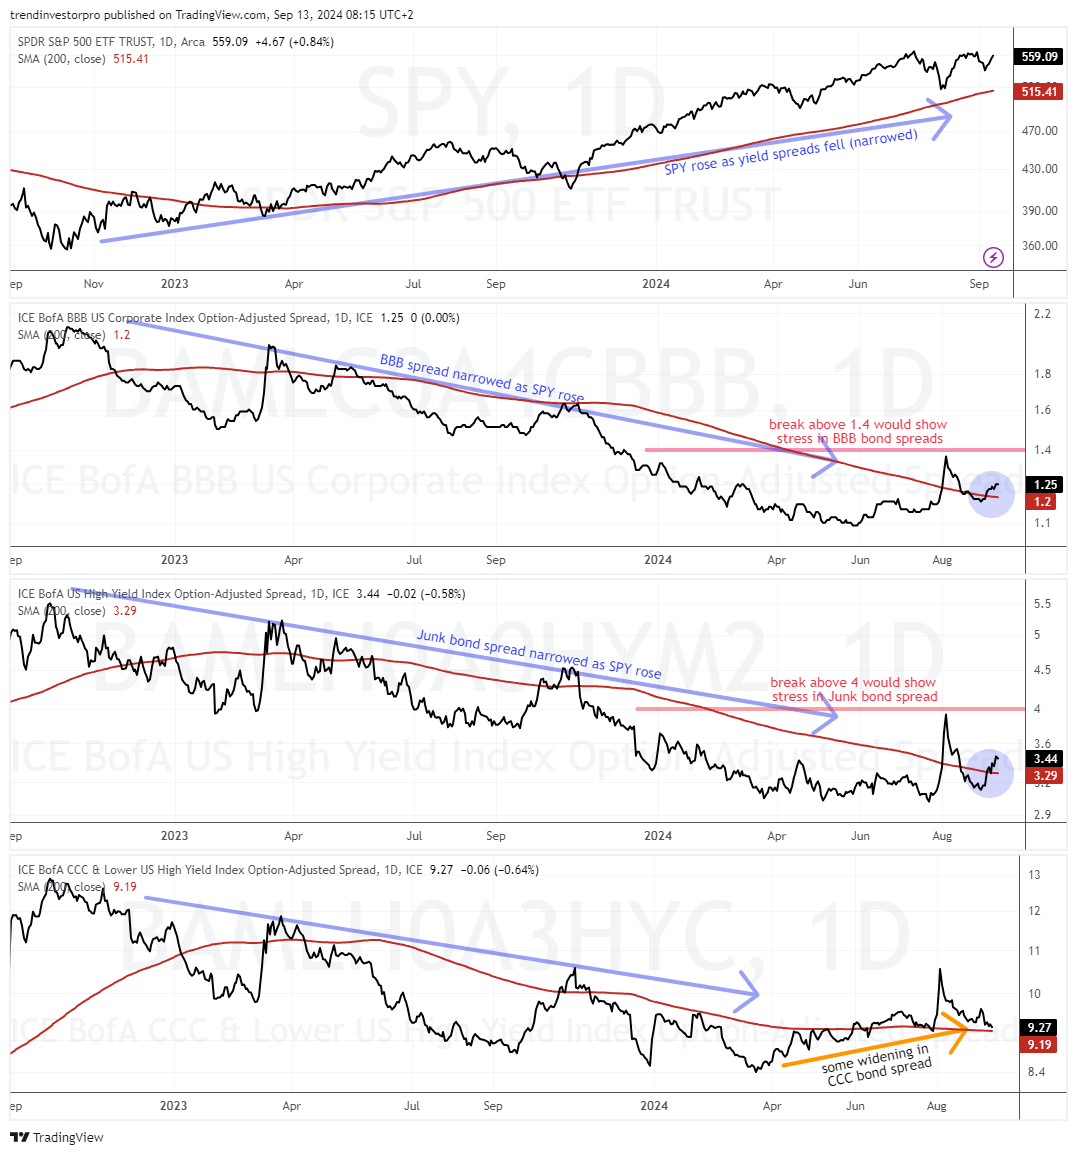
The next chart shows SPY, the BBB spread, the Junk bond spread and the CCC bond spread with their 200-day SMAs. The BBB and Junk bond spreads turned up in September and broke back above their 200-day SMAs (blue shading). They are still within their 2024 ranges and have yet to make a major breakout. These upturns, however, should be watched because follow through above the red lines would show stress in the corporate bond market. Breakouts at 1.4 in the BBB spread and 4 in the Junk spread would be bearish for stocks.
These spreads show the difference between a corporate bond yield (BBB) and the equivalent US Treasury bond yield. BBB bonds are the lowest rated investment grade bonds. US Treasuries are the ultimate safe-haven bonds. The spread between these two widens (rises) when stress builds in the corporate bond market. This is negative for stocks. The spread narrows (falls) when stress levels are low or subsiding. This is positive for stocks.
Near Term Concerns
The weight of the evidence remains long-term bullish for stocks. The Composite Breadth Model is bullish, SPY is well above its rising 200-day SMA and yield spreads are relatively narrow (no stress). Even so, we are still seeing relative weakness in several key groups (growth, semis, tech). In addition, defensive groups are leading as staples, utilities and healthcare hit new highs this month.
Relative Weakness in Key Groups
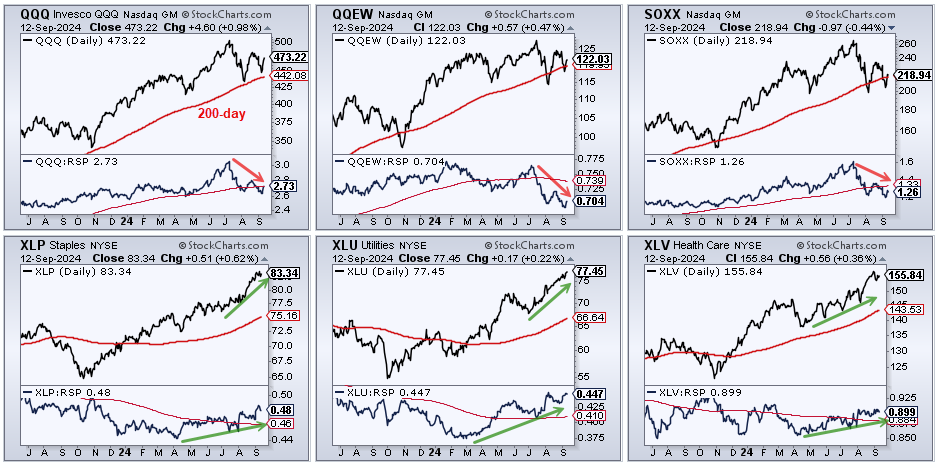
The CandleGlance chart below shows QQQ with a lower high from July to August. Meanwhile, the Nasdaq 100 Equal-Weight ETF (QQEW) and Semiconductor ETF (SOXX) are battling their 200-day SMAs. We will cover QQQ, SOXX and other tech names later in this report. The indicator windows show the price-relatives (QQQ/RSP Ratio) moving lower since July, which means they are underperforming the broader market (S&P 500 EW ETF).
The bottom half shows the three defensive sectors hitting new highs in September, and in leading uptrends. The Consumer Staples SPDR (XLP) and Utilities SPDR (XLU) are looking quite extended and ripe for a rest (ditto for the Real Estate SPDR (not shown)). All three price-relatives are moving higher over the last few months and above their 200-day SMAs. These groups are leading right now.
September is a Coin Flip
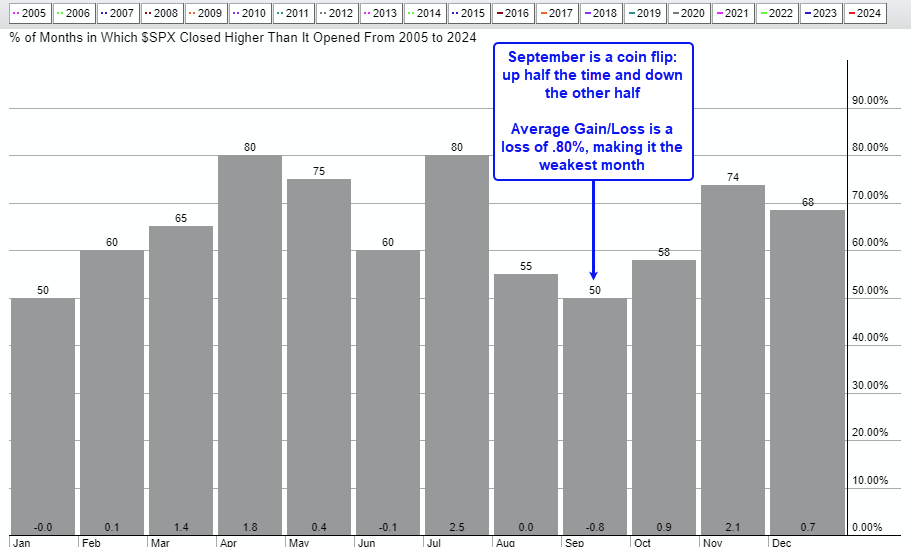
There is also some concern with September because it is historically the weakest month of the year. The seasonality chart below shows September rising 50% of the time over the last twenty years. This is tied with January for the lowest winning percentage. Even the lowest winning percentage is still a coin flip. September experienced an average loss of -.80%, which is the lowest of all months. This number is also not that low, but is the lowest of the 12 months.
Stocks were hit hard the first week of the month with SPY falling 4.14%. This created a short-term oversold condition and stocks bounced this week with a big reversal day on Wednesday. SPY was down around 1.5% in early trading and then rallied to close up 1% on the day. The ETF also gained on Thursday. This is impressive price action that establishes short-term support on many charts. Tech stocks and ETFs led the rebound, but we need to see follow through and some breakouts before calling for the end of the correction. Resistance levels are marked on the chart below.
SPY Gets Oversold Bounce after Steep Drop
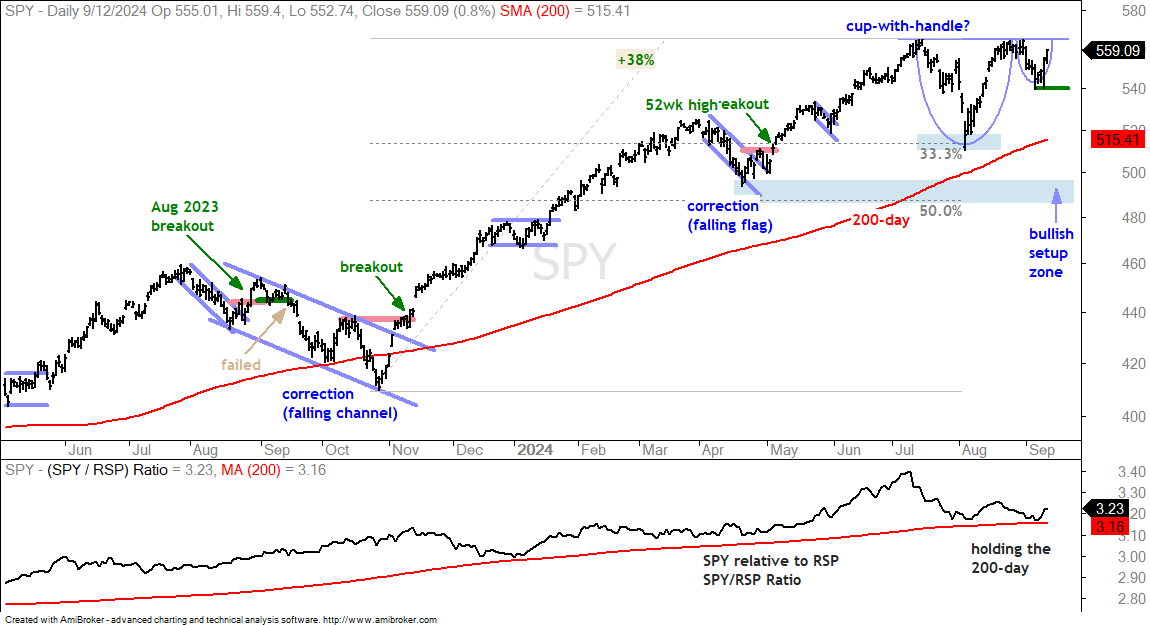
SPY and QQQ are in long-term uptrends. Both are above their rising 200-day SMAs and both recorded new highs in July. SPY challenged its July high with a surge in mid August, but QQQ fell well short of its prior high and is lagging the broader market. Overall, I think that SPY and QQQ are currently correcting within bigger uptrends. Corrections are like a box of chocolates: you never know what you are going to get. We could see sideways trading ranges, choppy declines or even a break below the August low.
The first chart shows SPY hitting its July high in August and falling sharply the first week of September. SPY immediately recovering with a 3.5% gain the last four days. Stocks were short-term oversold at the end of last week and ripe for an oversold bounce. An oversold bounce turns into something more when we see a breakout. Should SPY move back to its prior highs, a cup-with-handle would take shape and this is a bullish continuation pattern. A break above rim resistance would signal a continuation higher. Barring a breakout, I remain in the correction camp.
QQQ and Big Tech ETFs Triangulate
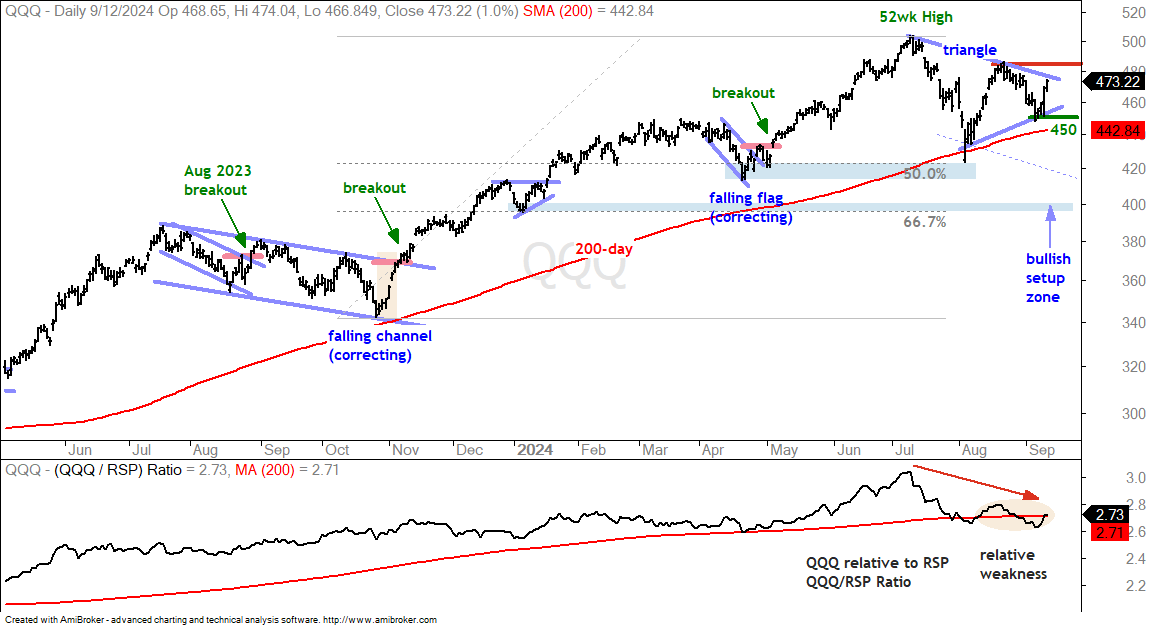
The next chart shows QQQ forming a possible triangle since July. Triangles are consolidations that reflect a narrowing range. Within a bigger uptrend, triangles are bullish continuation patterns and a break above the late August high would signal a bullish resolution. This means we need follow through to this week’s 5.5% gain. With this week’s bounce, we can mark support at 450. A break here would negate the triangle and argue for a deeper correction.
I am marking lower bullish setup zones on several charts, but these do not come into play until we see support breaks. On the QQQ chart above, the dashed line extends to the 410 area in October and marks a possible falling channel. I am also marking a bullish setup zone around 400 (67% retracement and January support low). Once a pullback is underway, a bullish setup zone is an area to watch for signs of buying pressure and a reversal that could end the correction. An ideal setup would include oversold conditions. Next Friday (20-Sept), I will publish a full report and video explaining these zones.
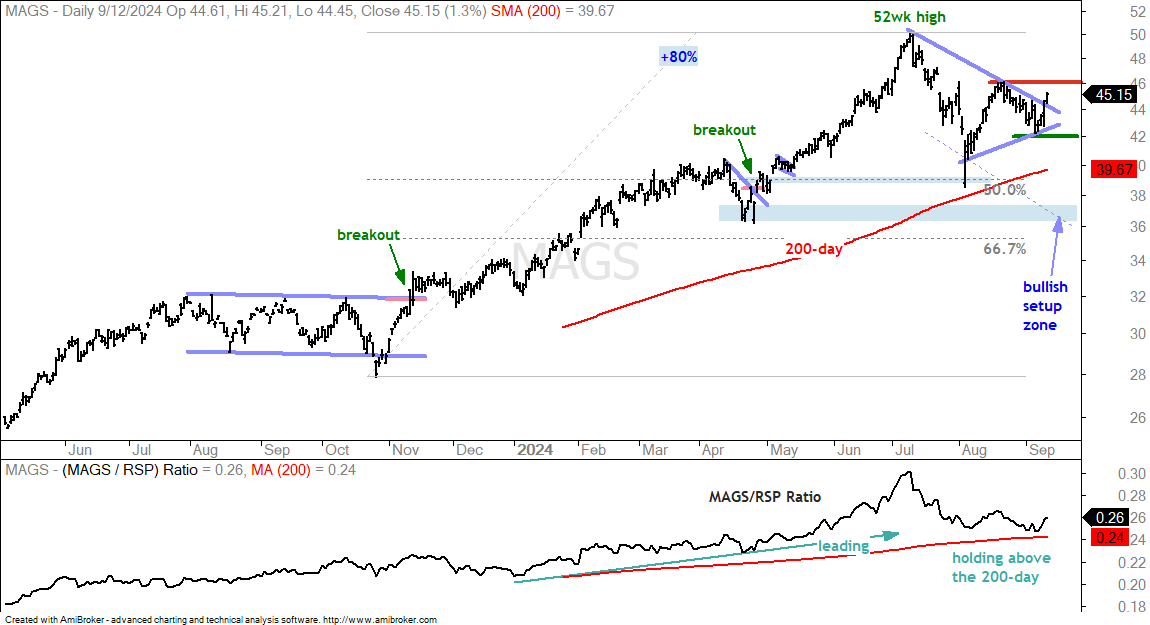
The next chart shows the Mag7 ETF (MAGS) with characteristics similar to QQQ. MAGS surged 2.5% on Wednesday to establish support at 42. One day is good for an oversold bounce (bottom pickers). Follow through would signal expanded buying pressure and a breakout at 46 would be bullish.
Software, Cybersecurity, Cloud and Fintech Hold 200-day SMAs
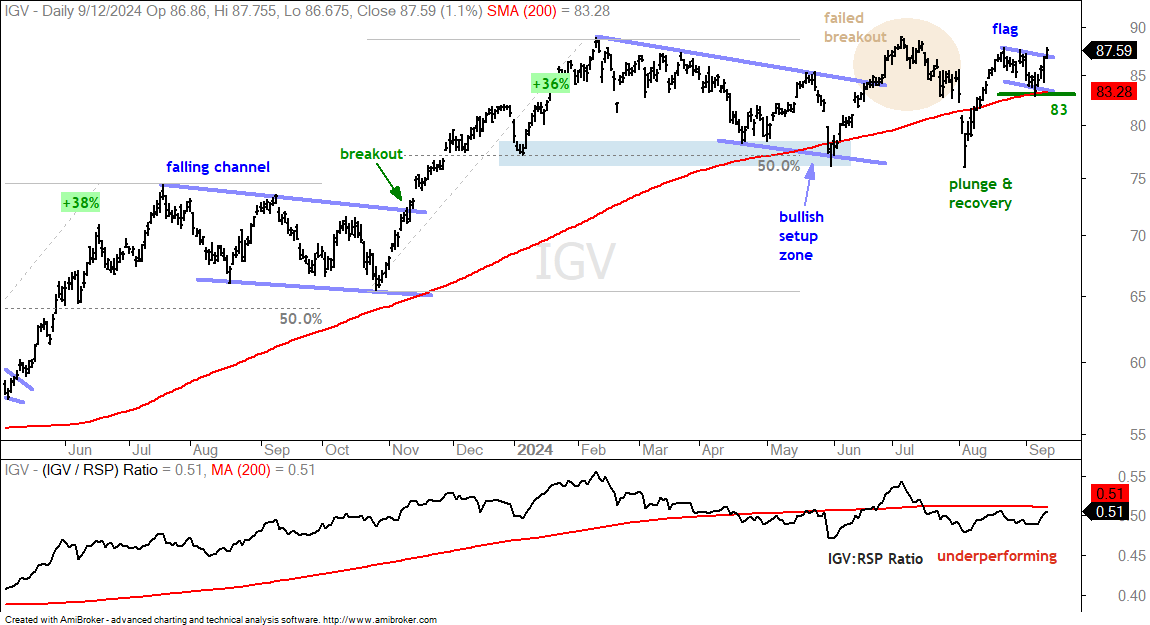
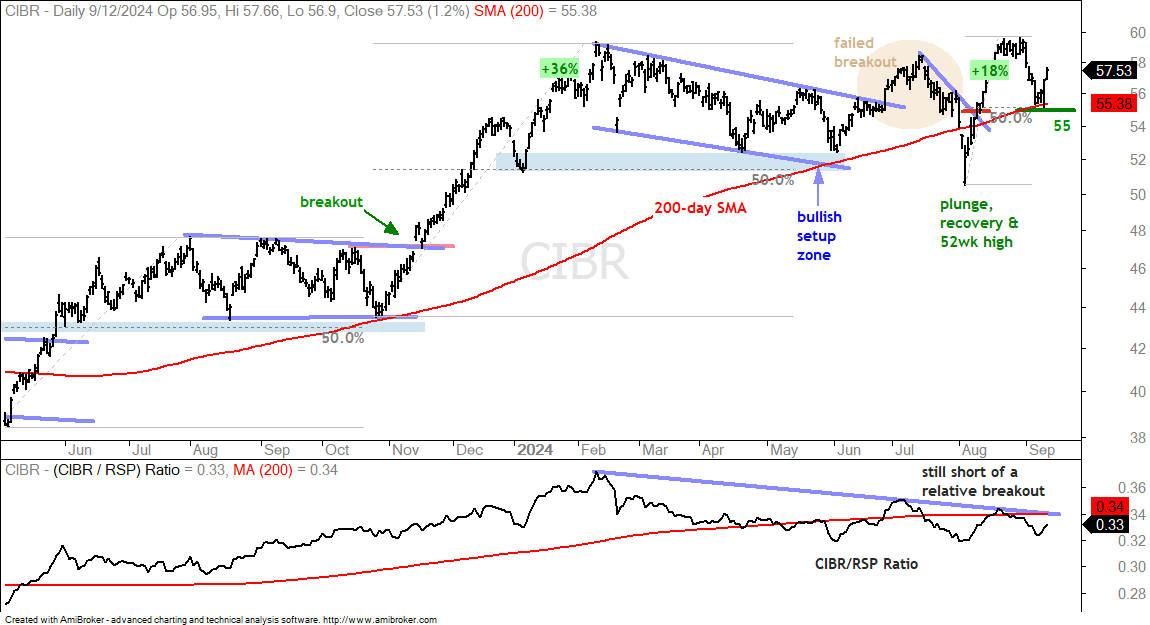
The Software ETF (IGV), Cybersecurity ETF (CIBR) and FinTech ETF (FINX) are holding up better than QQQ and the big tech ETFs above. These charts show breakouts in June-July and sharp declines in August that negated the breakouts. All three then recovered with big advances into mid August. They then pulled back in September. It’s been a wild and volatile ride since June (failed breakouts, early August plunges, mid August recovery surges). Let’s try to make some sense of it.
The first chart shows IGV with a breakout in late June, a sharp decline into early August (failed breakout) and a steep recovery. The ETF then formed a flag over the last few weeks and this is a bullish continuation pattern. IGV broke out at 88 and this is short-term bullish. It also keeps the long-term trend alive as IGV is above the 200-day SMA. I am marking first support at 83 and a break here would be negative.
The next chart shows the Cybersecurity ETF (CIBR) surging 18% in mid August and hitting a new high. The ETF then fell back to its 200-day SMA as it retraced 50% of this 18% surge. CIBR firmed for two days and then surged off the 200-day SMA. This bounce reinforces support at 55. A break here would put CIBR back below the 200-day and be negative.
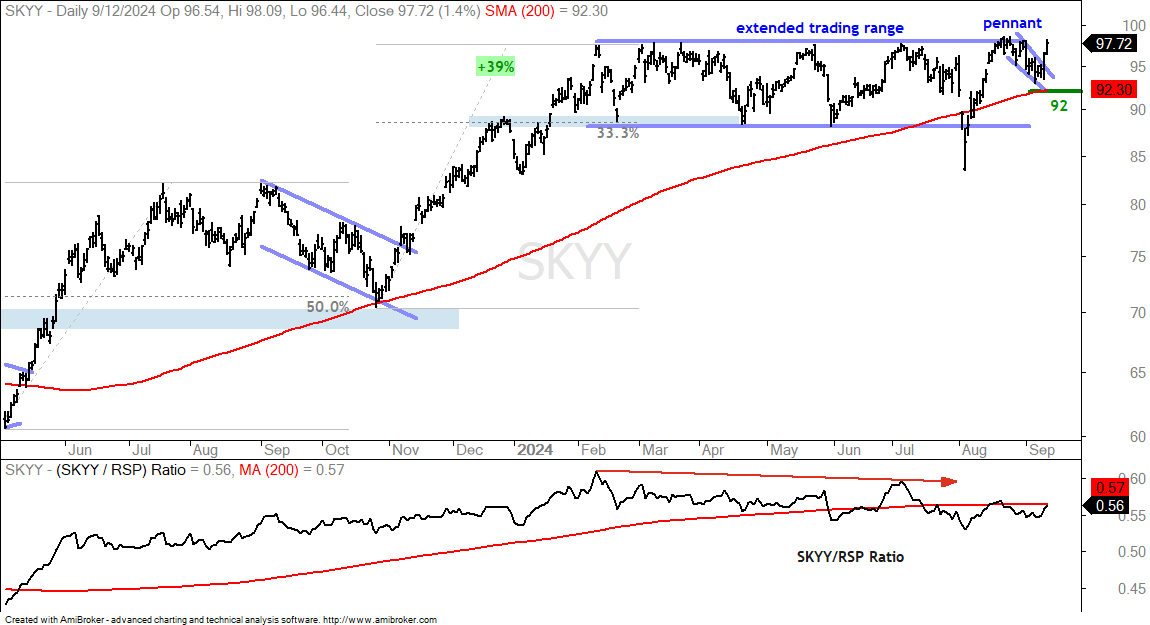
The next chart shows the Cloud Computing ETF (SKYY) advancing some 39% and then consolidating from February to September. SKYY surged to resistance in mid August and then fell back with a small wedge/pennant in September. This is a short-term bullish continuation pattern and SKYY broke the upper line with a surge on Wednesday. This signals a continuation of the mid August surge and increases the chances for a bigger breakout. This week’s bounce also reinforces support at 92, a break of which would be negative.
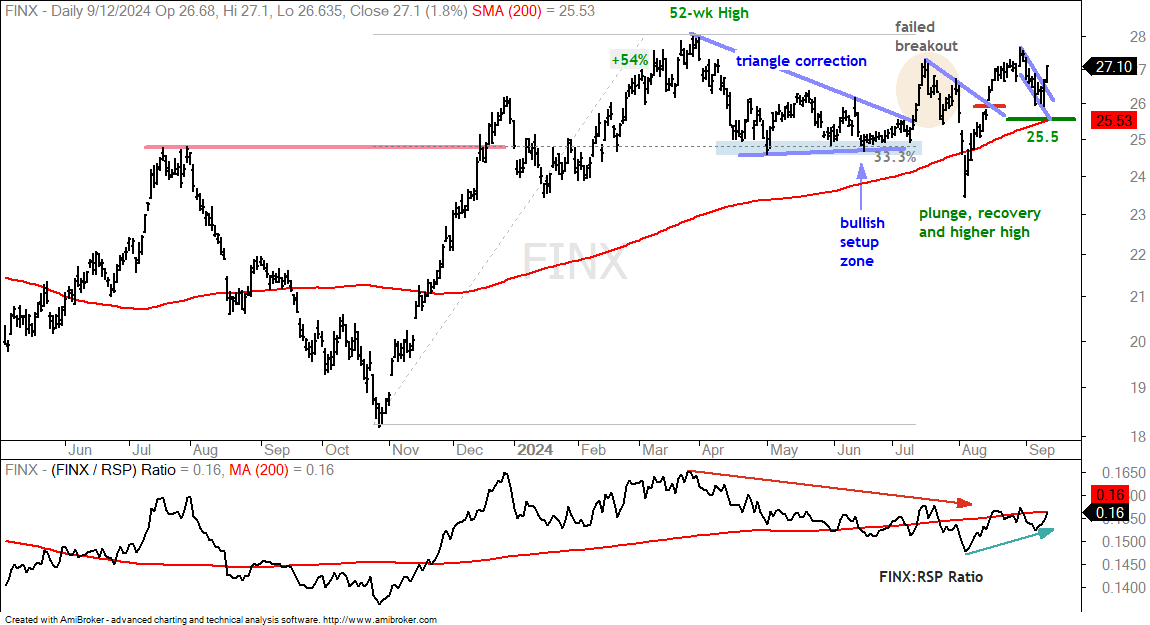
The next chart shows the FinTech ETF (FINX) first crossing above 26 in late December. Yesterday’s low was at 25.93 as the ETF crossed this level again in August. Basically, FINX has gone nowhere (and everywhere) for eight months. The cup is still half full right now because the ETF surged in mid August and exceeded its July high. It fell back here in September and remains above the rising 200-day. A falling flag also formed and FINX broke out with a two day surge. FINX remains in bull mode as long as 25.50 holds.
Seven Big Techs to Watch
The next charts cover some of the leading tech stocks. MSFT and META are in the Mag7 ETF (MAGS). QCOM, ARM, AVGO and NVDA are part of the Semiconductor ETF (SOXX). DELL is part of the Cloud Computing ETF (SKYY). Many were leading into July and then corrected into August-September. They remain in correction mode because they have yet to break resistance levels to signal and end to the correction (except ARM). QCOM, ARM, AVGO, NVDA and DELL sell the equipment and services needed for AI. The hyperscalers, MSFT, META, GOOGL and AMZN, are the Nvidia customers building AI.
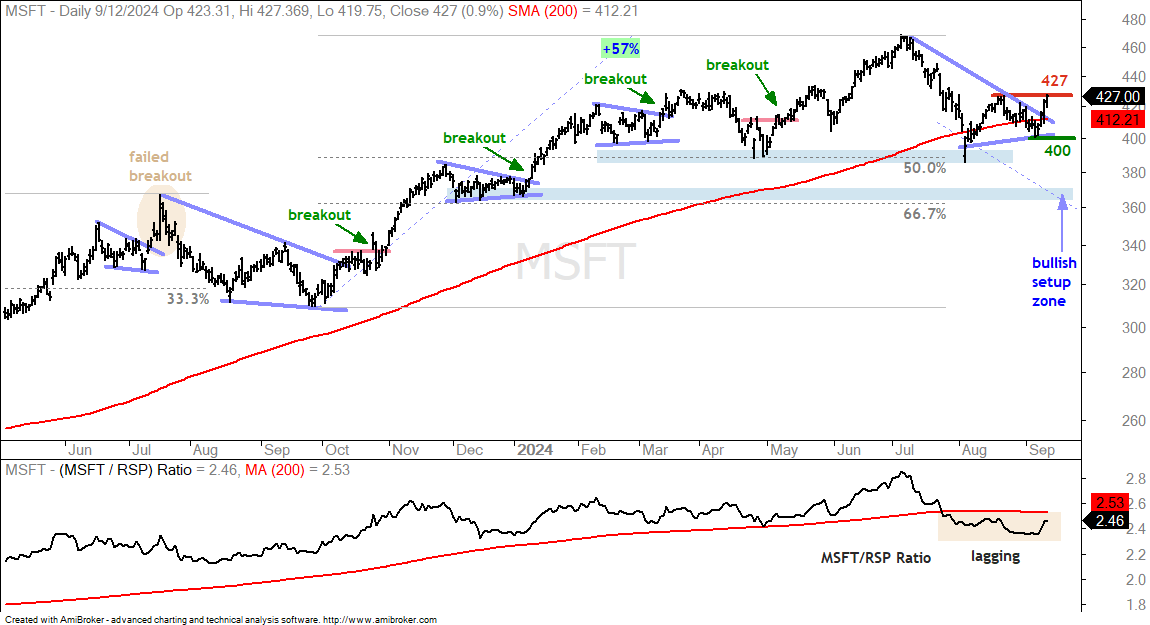
The next chart shows Microsoft (MSFT) falling back to the 200-day SMA (red line) and trading around this key moving average the last several weeks. This is a make or break area for the pullback. The blue lines show a possible triangle with resistance marked at 427. MSFT surged off the 400 level this week and a follow through breakout here would be bullish. This could signal an end to the corrective period and a resumption of the bigger uptrend. With this week’s bounce, I am marking support at 400. A break here would negate the triangle and argue for a deeper correction. The next target is the bullish setup zone in the 360-370 area. The indicator window shows MSFT lagging because the price-relative (MSFT/RSP ratio) remains below its 200-day SMA.
META Holds Strong with Flag Breakout
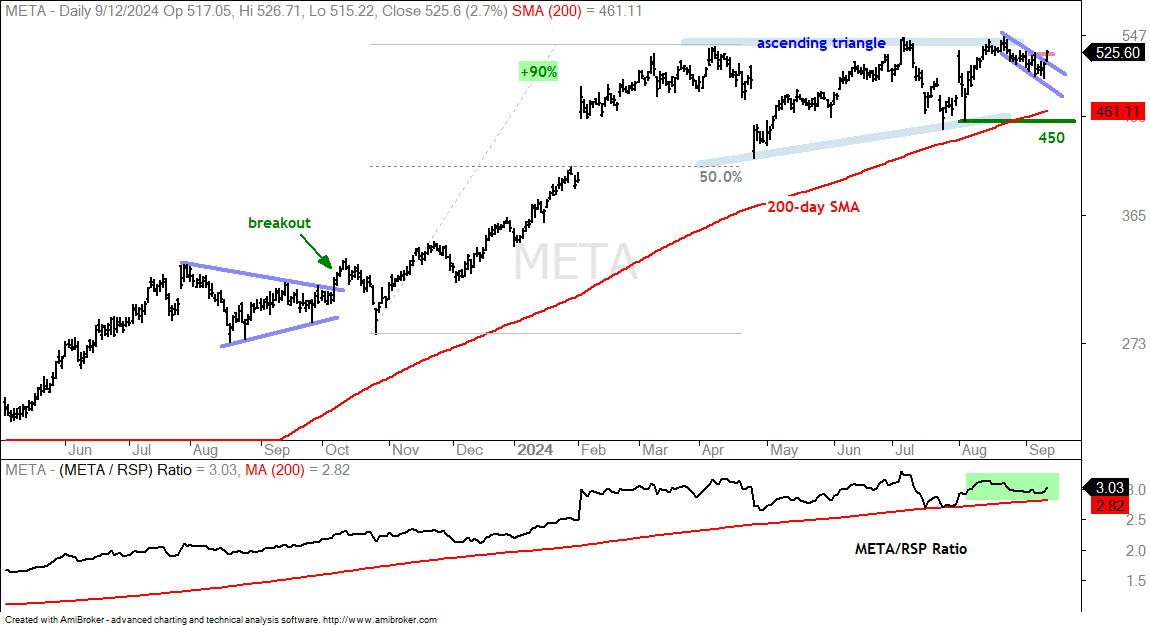
Meta Platforms (META) remains in play with a flag breakout this week. Overall, the stock is holding up exceptionally well the last few months and weeks. Long-term, the stock advanced 90% and the retraced around half with a decline into late April. META worked its way back to its spring highs in July and then got caught up in broad market volatility in August. Overall, a large Ascending Triangle is forming and this is a bullish continuation pattern. A breakout would forge a new high and signal a continuation of the bigger uptrend. Short-term, the stock surged to resistance in August and then worked its way lower with a falling flag into September. This is a short-term bullish continuation pattern and the breakout increases the chances of a long-term breakout.
Note that next Friday (20-Sept) I will publish a detailed report and video covering bullish setup zones.
QCOM Firms in Bullish Setup Zone
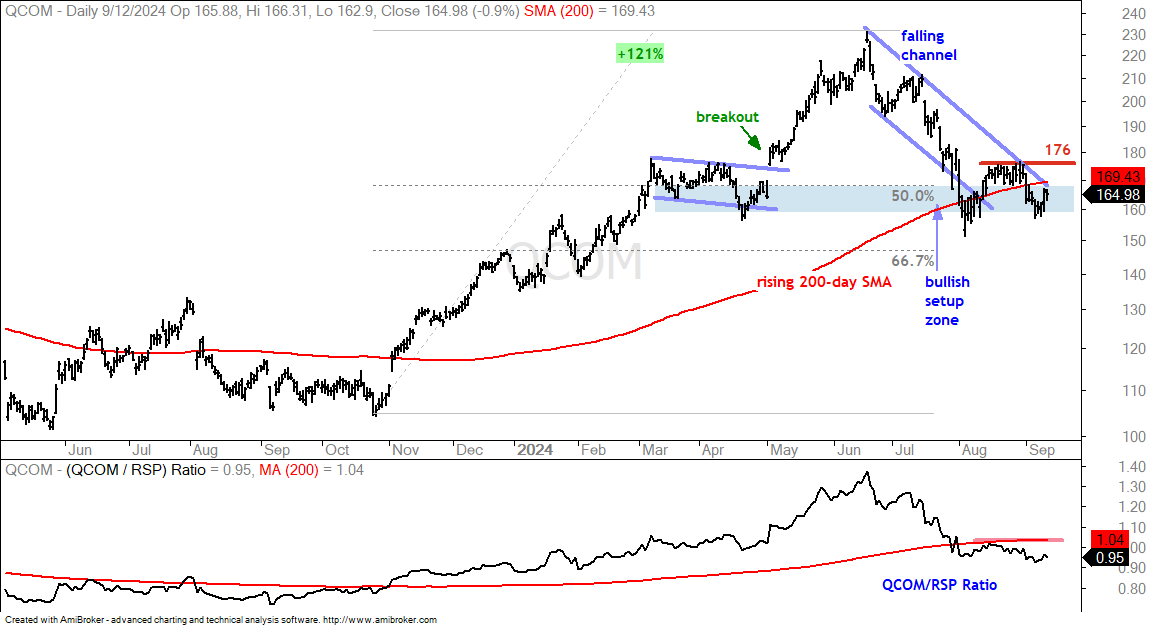
The next chart shows Qualcomm (QCOM) hitting a new high in June and falling sharpy into August. As with Microsoft, the stock is battling its 200-day SMA. It is also trading in a bullish support zone marked by the 50% retracement and support from the March-April lows. QCOM also became oversold in early August after a 20+ percent decline in 20 days. A bullish setup zone is an area to watch for support and a reversal. The stock is attempting to firm, but remains short of a breakout. QCOM established resistance at 176 in the second half of August and a breakout here is needed to reverse the immediate downtrend. Barring a breakout, we could see further correction towards the 145 area (67% retracement).
ARM Holds 200-day SMA and Breaks Out
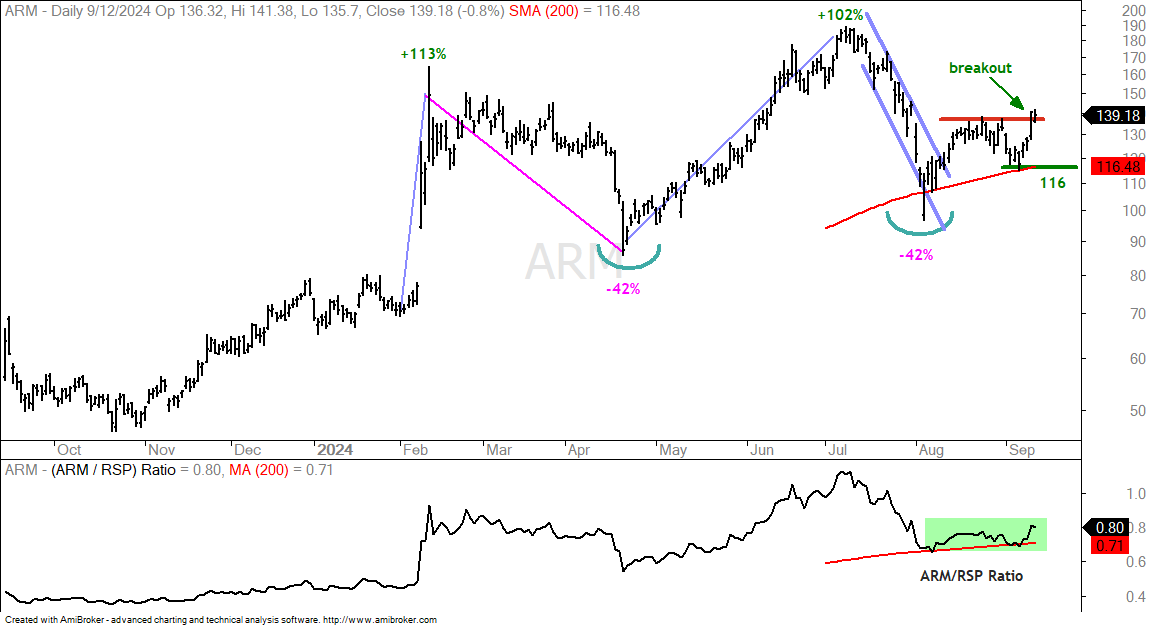
Arm Holdings (ARM) captures the volatility of the current market quite well. Just this year alone, the stock surged over 100% twice and the fell over 40%. The stock is in a long-term uptrend with a higher high from February to July and a higher low from April to August. Most recently, the stock fell back to the 200-day SMA in August, firmed for several weeks and broke above its August high with a surge this week. First support is set at 116. The indicator windows shows the price-relative (ARM:RSP ratio) holding above its 200-day SMA and rising since early August.
DELL Challenges Channel Resistance
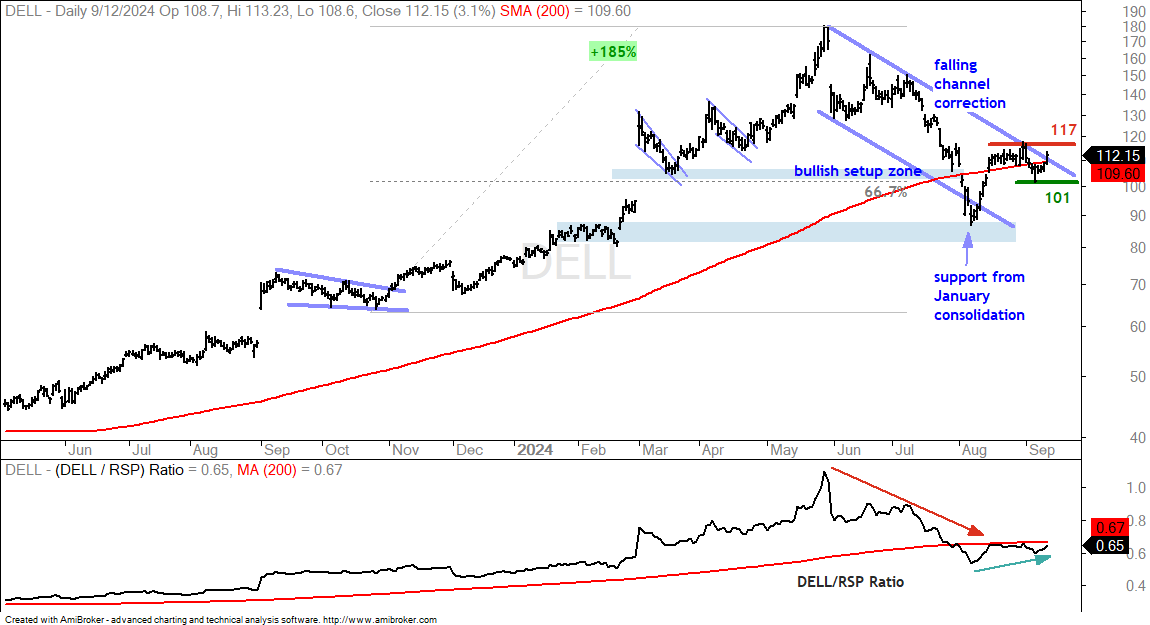
Dell Technologies (DELL) is part of the data center trade. The stock led the market on the way up with a 185% advance and on the way down with a 50% decline from its July high. The stock did not stop at the bullish setup zone (105-110) and plunged into early August. Perhaps this was an overshoot because the stock quickly rebounded and then consolidated near the old bullish setup zone, and the 200-day SMA (red line). It is as if early August never happened. Overall, I see a big falling channel correction with resistance marked at 117. A breakout here would reverse this downtrend. I would then mark support using the early September low.
Broadcom Surges within Triangle
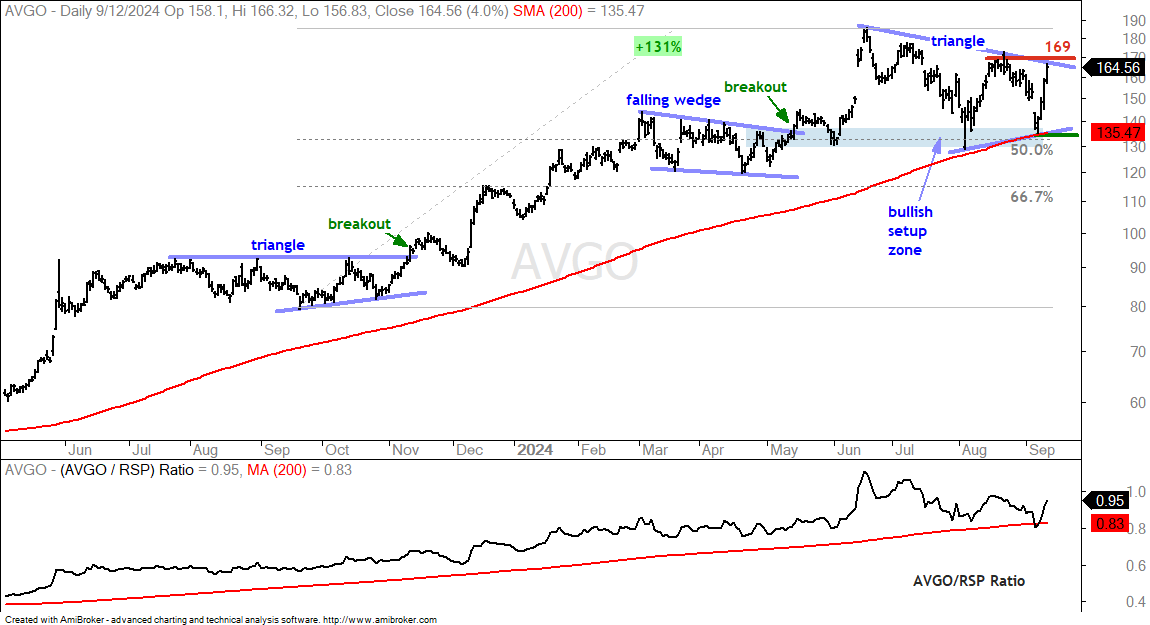
The next chart shows Broadcom (AVGO) surging of a bullish setup zone in the 135 area. This zone stems from broken resistance (May breakout), the May-August lows (support), the 50% retracement and the rising 200-day SMA. All combine to mark support and an area that may produce an upside reversal. AVGO formed a triangle over the last few months. This is a consolidation within a bigger uptrend, which makes it a bullish continuation pattern. A breakout at 169 would be bullish.
NVDA Forms Triangle within Uptrend
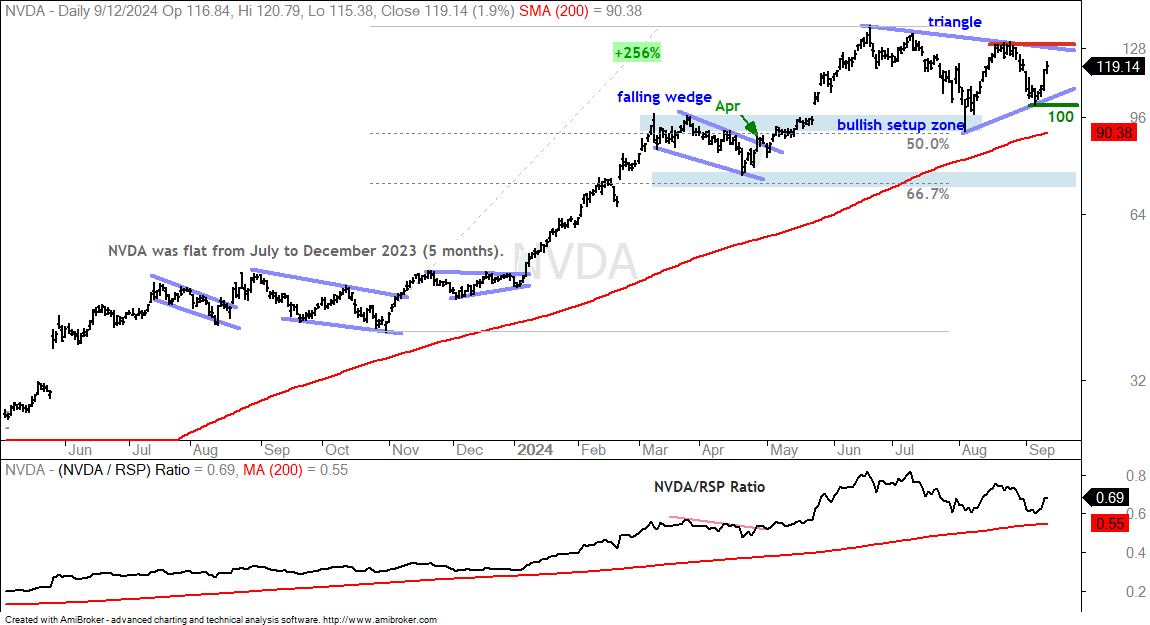
The next chart shows Nvidia (NVDA) also forming a triangle within an uptrend. NVDA plunged with the market in early August, but found support near the bullish setup zone (50% retracement and prior resistance). The stock was also extremely oversold then. NVDA bounced with a strong move in mid August, but fell back rather hard in early September.
Medical Devices Breakout and Biotech Setup
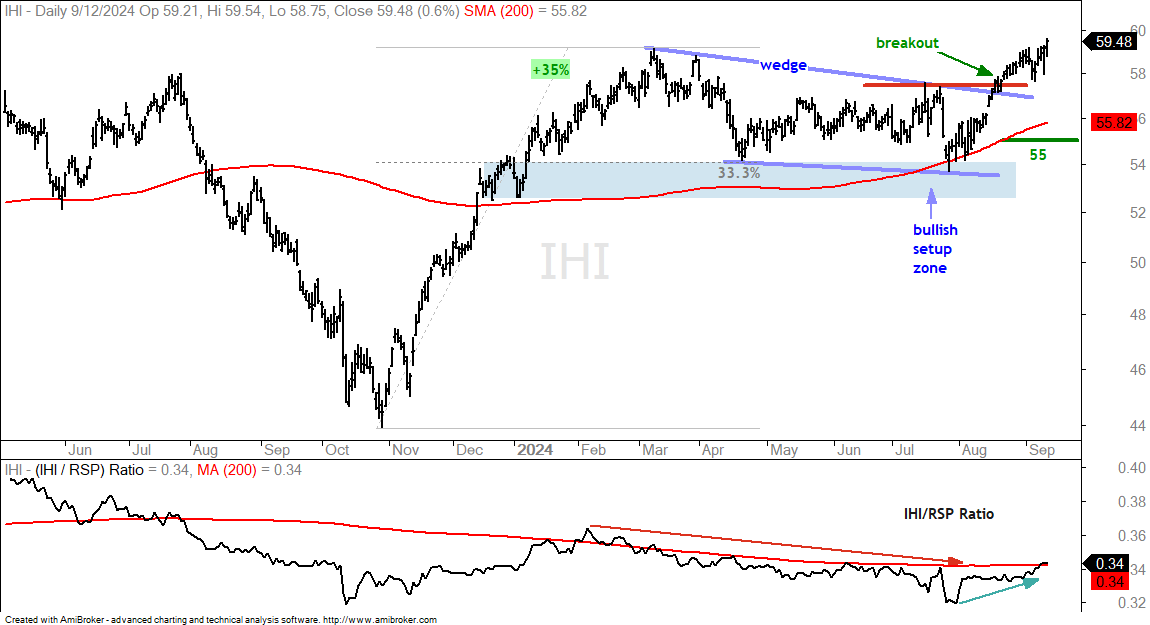
The Healthcare SPDR (XLV) is one of the leading sectors as the ETF tagged a new high last week. I would like to expand within the sector by showing the Medical Devices ETF (IHI) and Biotech SPDR (XBI). The chart below shows IHI with a 35% advance into March and a long falling wedge into early August. IHI underperformed during this correction as the price-relative (IHI/RSP ratio) fell. Even so, the decline looks like a big correction after the 35% advance. This decline retraced a normal amount (~33%), found support near the rising 200-day SMA and formed a classic correction pattern (falling wedge). The ETF broke out with a strong move in August and is very close to a 52-week high. I view this breakout as bullish and will mark the first re-evaluation level at 55.
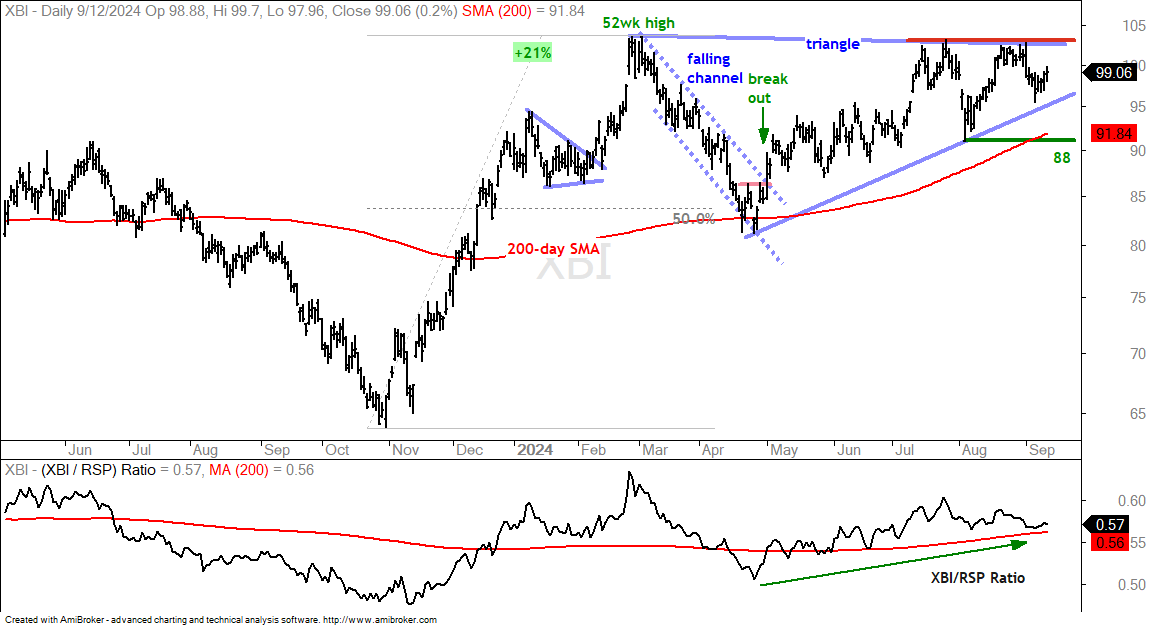
The next chart shows the Biotech SPDR (XBI) with a 21% advance into March, a falling channel into April and a breakout in early May. This setup and breakout were featured on May 2nd (here)[2]. XBI worked its way higher after this breakout and hit resistance in the 103 area from mid July to early September. Overall, a large triangle is taking shape and I view this as a big consolidation within a long-term uptrend. XBI is above its rising 200-day. A triangle breakout would signal a continuation higher. I am marking support using the August low and 200-day SMA (88).
Wind Energy ETF Renews Breakout
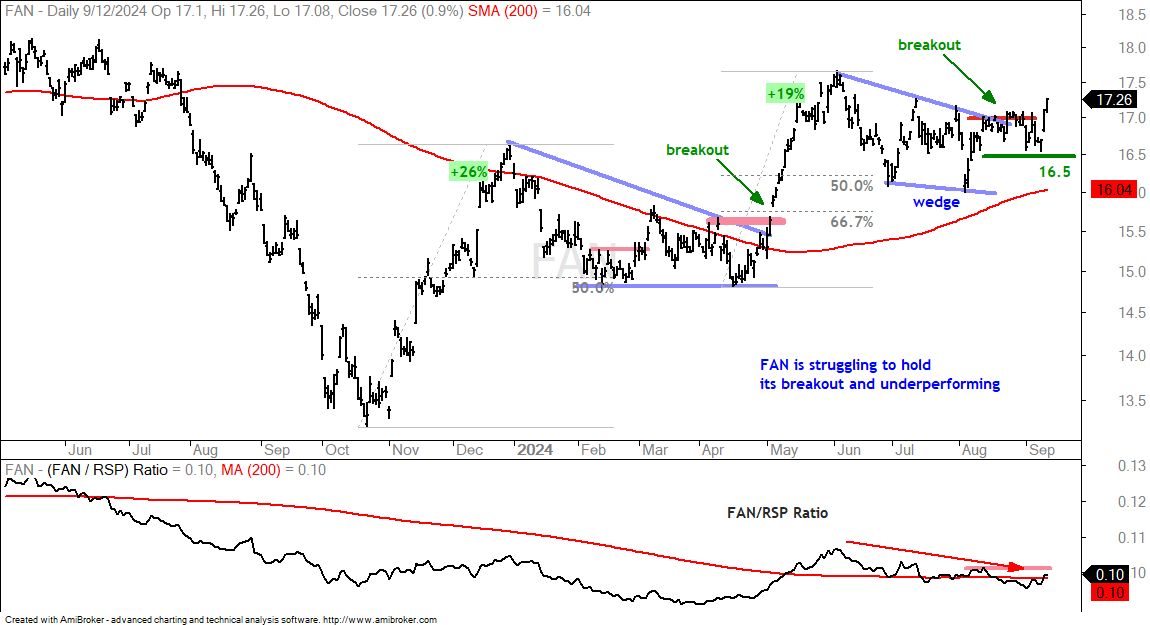
The Wind Energy ETF (FAN) continues to battle its breakout zone and keep the cup half full. Overall, the ETF surged some 19% from mid April to mid June and then corrected with a falling wedge into August. FAN surged in mid August and broke resistance on August 23rd. The ETF was struggling to get follow through and produce a convincing breakout. It found some mojo this week as it held the re-evaluation level in early September and surged back above 17 this week. The breakout remains in play with 16.50 as the re-evaluation level.
Home Construction ETF Remains Strong
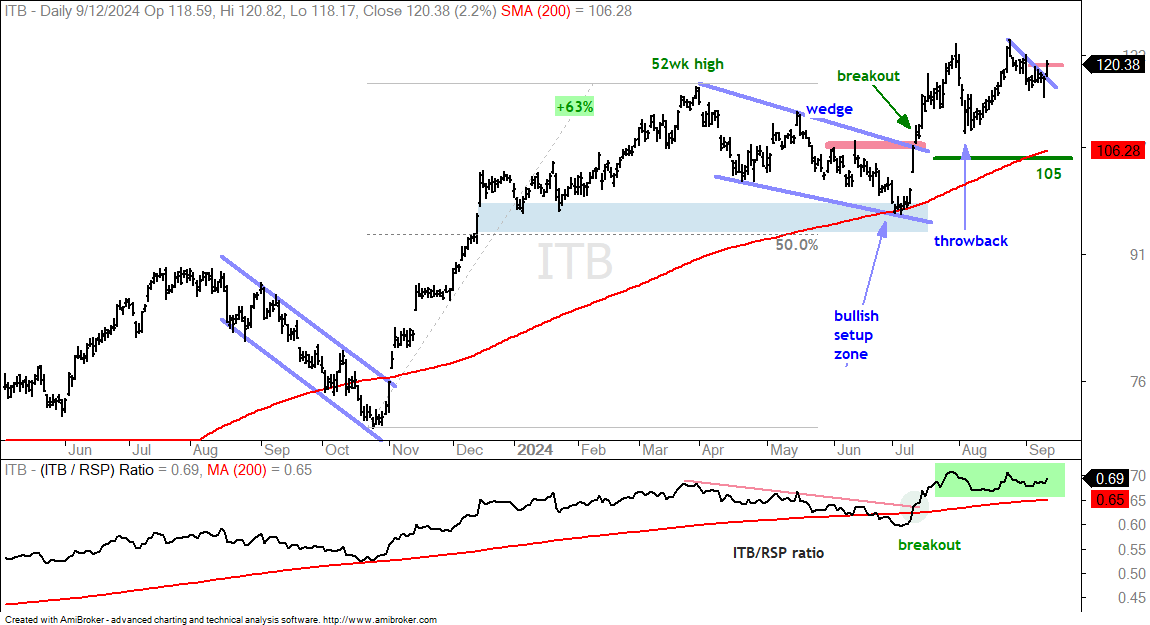
The Home Construction ETF (ITB) remains one of the strongest ETFs in the market right now. ITB hit a bullish setup zone in early June and broke falling wedge resistance with a surge in mid July. Trading after the breakout has been choppy, but the breakout is bullish and holding. ITB even tagged a 52-week high in late August, before pulling back with the market in September. Short-term resistance is set at 120 and ITB broke out with a surge on Thursday. Long-term, I am marking key support at 105 using the breakout zone, the August low and the rising 200-day SMA.
Aerospace & Defense ETF Sports Consistent Uptrend
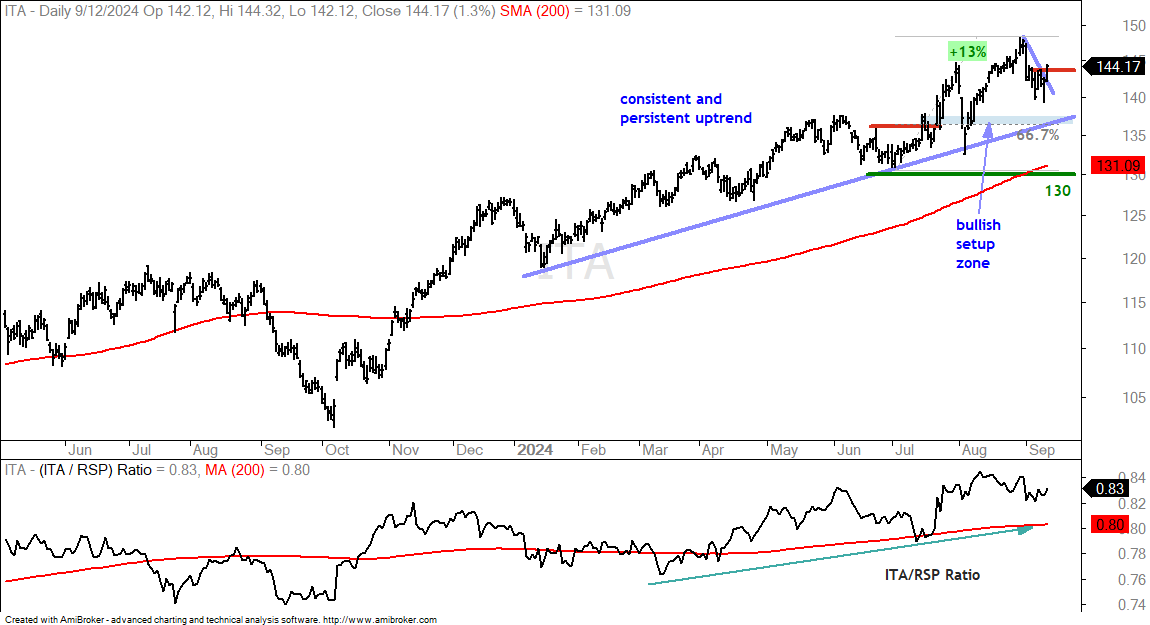
The Aerospace & Defense ETF (ITA) has one of the most consistent and persistent uptrends in the market. I am using the July lows and rising 200-day SMA to mark long-term support at 130. In addition, I am marking a bullish setup zone in the 137-138 area. This zone stems from broken resistance, the 67% retracement line and the January trendline. Should the pullback extend, this is the area to watch for support and a reversal. We may not get there as ITA pulled back in early September and broke short-term resistance with a surge this week.
TLT Extends Uptrend with Pennant Breakout
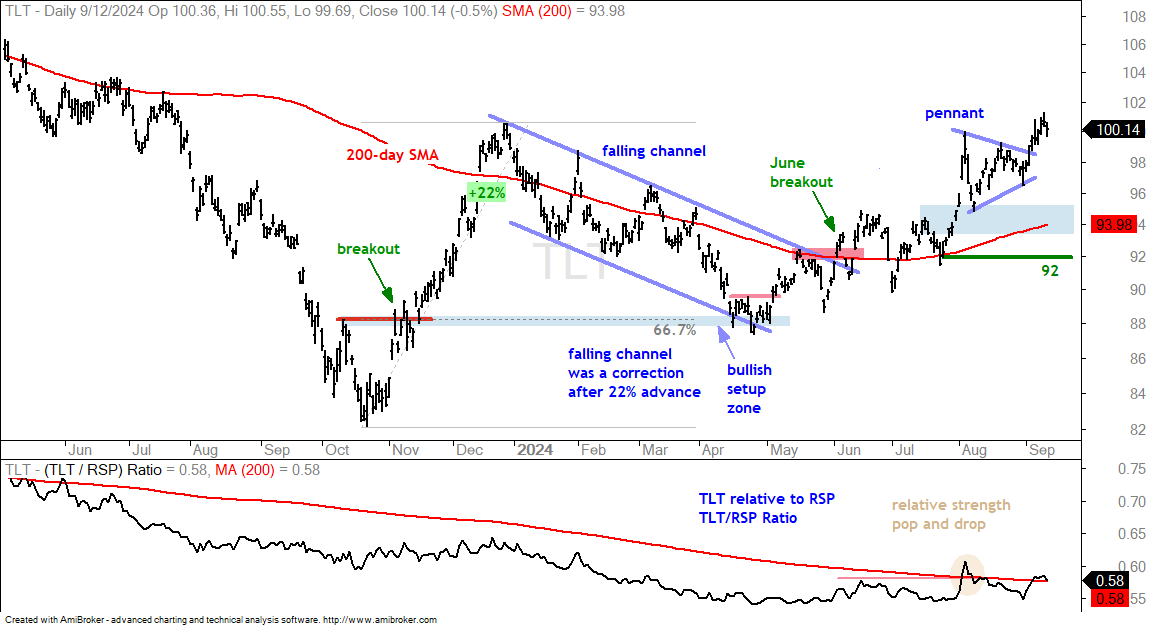
The next chart shows the 20+ Yr Treasury Bond ETF (TLT) within an uptrend since the June breakout. The July low marks long-term support at 92, and the upside target for this breakout is around 108 (highs from March-April 2023). More recently, TLT surged in early August, consolidated with a pennant into early September and broke out of this pennant last week. Pennants are short-term bullish continuation patterns and the breakout signals a continuation of the bigger uptrend.
GLD Consolidates after Pennant Breakout
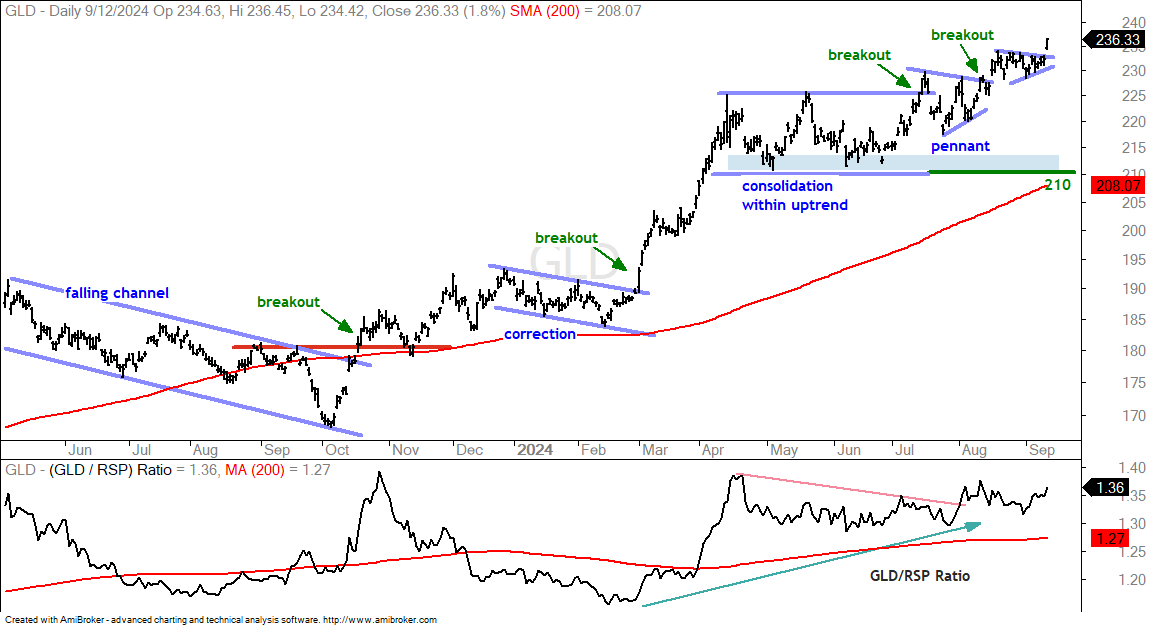
GLD remains in a long-term uptrend and continues to lead with a new high this week. The ETF is well above its rising 200-day SMA with the May-June lows marking long-term support at 210. Most recently, the ETF broke to new highs in mid July, consolidated around this breakout with a pennant and broke out of the pennant in mid August. Pennants are short-term bullish continuation patterns and this breakout keeps the uptrend alive, and kicking. Another pennant formed into September and the ETF broke out again this week.
Bitcoin Breaks Wedge Support within Bigger Downtrend
Bitcoin remains in a long-term downtrend with a series of lower lows and lower highs since April (blue dashed lines). This benchmark crypto currency fell sharply in early August as the market got hit with a risk-off rush. Bitcoin then recovered with a rising wedge, which I viewed as an oversold bounce or corrective bounce. It broke the lower line of the wedge last week to signal a continuation lower. The lower trendline extends to the 52,000 area for the first downside target. Below this level, the next support zone is around 45,000.