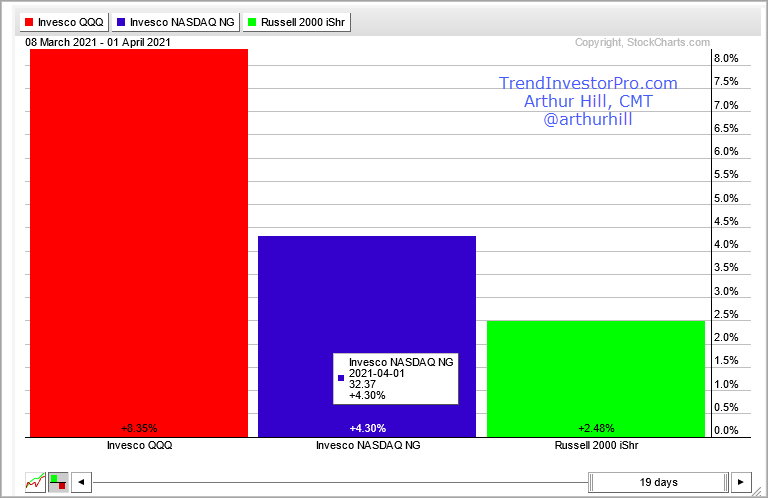
The Nasdaq 100 ETF (QQQ) represents the largest stocks in the Nasdaq and the Nasdaq 100 Next Gen ETF (QQQJ) covers the next 100 (101 to 200). Stocks at the top of the latter group are knocking on the door and trying to fatten up for inclusion into the legendary QQQ. The Next Gen stocks (QQQJ) outperformed QQQ from November to February, but the performance picture is starting to change in favor of QQQ.
There are a number of ways to measure relative performance and look for signs of relative strength. One of my preferred methods is to simply compare corresponding peaks and troughs on the price charts. Let’s try this exercise with QQQ, QQQJ and IWM. The chart below shows all three with two benchmark lows and one benchmark high. First, the blue lines mark the lows on January 29th. QQQ broke this low on February 25th (1), but QQQJ and IWM held this low. QQQ showed relative “chart” weakness” and led the way lower into early March.
The green lines mark the lows on March 8th. All three bounced into mid March and then fell in late March. QQQ held well above the March 8th low (2), but QQQJ and IWM exceeded this low. QQQ showed relative chart strength by holding above the low, while the other two showed relative weakness by breaking it. This was the early sign that foreshadowed this week’s breakout. The red line shows the mid March highs. Notice that QQQ is the only one of the three that broke this high (3). QQQ is leading again and showing relative chart strength.
TrendInvestorPro [1] focuses on price chart analysis to separate the leading ETFs from the lagging ETFs and identify bullish setups within bigger uptrends. There were lots of breakouts this week with focus on the Video Game eSports ETF, Cybersecurity ETF and Copper Miners ETF. Click here for immediate access [1] to our comprehensive ETF Trends, Patterns & Setups Report, Market Timing Report, Ranking Tables and weekend video.

